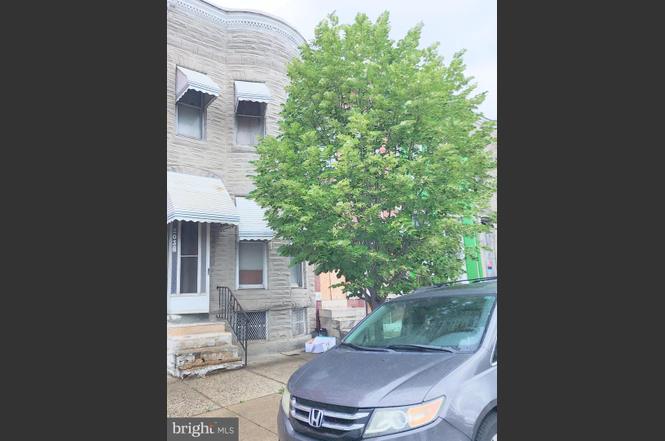
2030 N Fulton Ave · Baltimore, MD
Flood risk 9/10 · Severe
- FEMA flood zone
- X (unshaded)
- Chance of flooding over 30 yrs
- 0.99%
- Est. flood insurance / yr
- $507 – $1,088
Fire risk 1/10 · Minimal
- Est. fire insurance / yr
- $755 – $1,403
Heat risk 7/10 · Major
- Hot days now (above 103°F)
- 7 days/yr
- Hot days in 30 yrs
- 15 days/yr
Wind risk 6/10 · Moderate
- Chance of severe wind over 30 yrs
- 27.0%
Air-quality risk 4/10 · Minor
- Unhealthy air days now
- 6 days/yr
- Unhealthy air days in 30 yrs
- 7 days/yr
Risk factors via First Street. Map © Google.
Why this score? — see what drove the D grade
The composite is a weighted blend of 9 inputs, each scored 0–100. Each bar is that input's sub-score; the figure is the points it added to the 100-point composite (weight × sub-score).
- Cash flow +15.0/30.0
- ARV discount +7.5/15.0
- 1% rule +5.0/10.0
- DSCR +5.0/10.0
- Rent growth +4.2/5.0
- Livability +3.8/5.0
- Condition / age +2.5/5.0
- Schools +1.0/10.0
- Appreciation +0.0/10.0
$30,000
🖨 Deal sheet 📄 Offer letter ✓ Due diligence
Listing remarks
Attention investors and renovators! This vacant 3-bedroom, 1-bath Baltimore rowhome offers a great opportunity to create value and build equity. Featuring approximately 1,120 square feet, the property is ready for renovation and is being sold as-is.
Key facts
- Built 1920
- Listed 3 days
Property features AI
Exterior
- Utilities: Public water; Public sewer; Natural gas hot water
- Home design: Interior townhouse/rowhouse; Fee simple ownership
- Construction: Brick construction; Brick/mortar foundation; Above-grade and below-grade structures
- Exterior features: No tidal water
Interior
- Bedrooms: Three bedrooms on the main level
- Bathrooms: One full bathroom on the main level
- Heating & cooling: Central heating; Natural gas heating; Cooling system (electric)
- Interior features: Partially finished basement; Living area measurement sourced from assessor
Neighborhood map
What this means for you Summary
Snapshot
- This is a 3-bed/1.0-bath townhouse listed at $30k.
Deal economics
- At list price, monthly cash flow is $1k ($14k/yr) — positive.
- The deal already cash-flows at list — no discount required.
- Meets the 1% rule at list price ($2k rent vs $30k).
- Cap rate 55.6% vs local median 6.0% in Baltimore — top-decile yield for the area; either an underpriced asset or a hidden risk that comps aren't pricing in. Stress-test before assuming the spread holds.
Location & tenants
- Location reads 76/100 on livability (#90 in MD, #3,396 nationally) — a middle-class / working-renter tenant base. Strengths: amenities A+, commute A+, housing A+; Watch: schools D, crime F.
- Baltimore City Public Schools (urban): math 7% / reading 16% proficiency, ranked #24 of 24 in MD (top 100%) — low school quality limits family demand, transient renter base, plan for 1-2y turnover; 79% free/reduced lunch — lower-income household profile, screen leases tightly.
- Market conditions: Rents rising fast (+6.6%/yr); 331 active listings in the ZIP; 40 comparable units currently listed for rent nearby; rentals at typical pace (median 24d on market — plan ~3-4 weeks tenant-placement turnaround); lower-income renter base — watch delinquency; 1,273 units permitted in Baltimore city in 2024 (1,104 in 5+ unit buildings).
- At $1,828/mo this rent would consume 57% of the median local household income ($38k/yr) (locally 2921% of renters already pay >50% of income on rent) — very limited rent-growth headroom before tenants either downsize or default.
Forward outlook
- Local home prices are declining (-3.0%/yr); year-one equity from $207 of loan paydown is wiped out by about $900 of value loss. Plan a longer hold.
- Baltimore County population projected to shrink 4% by 2050 — rents likely to lag national; underwrite the cash flow, not the appreciation.
- At projected returns (-3.0% appreciation + 6.6% rent growth), your $8k cash investment doubles in ~1 year — after that, you're playing with house money.
Negotiation context
- Only 3 days on market — expect competitive offers; lowballing is unlikely to land.
Risks & watch-outs
- Watch-outs: flood insurance adds $66/mo; built in 1920 — expect roof / HVAC / electrical / plumbing capex.
- Climate carrying-cost: severe flood risk; major wind risk, 27% chance of damaging wind over 30y; extreme-heat days projected 7→15/yr by 2055 (HVAC capex compounding) — expect insurance premiums to compound above CPI over the hold.
Questions for the listing agent
- Built in 1920 — when were the roof, HVAC, electrical panel, plumbing, and water heater last replaced?
- What's the actual annual flood-insurance premium (NFIP or private), and is the property in a SFHA with mandatory coverage?
- Is there a deadline driving the sale (1031 exchange, divorce, estate, relocation)? That informs how much negotiation room exists.
- Schools are D-rated, which usually means shorter tenancies and higher turnover. Who's the typical renter profile here, and what's been the actual vacancy rate?
- Crime grade is F in this area — have there been break-ins, vandalism, or insurance claims at this property in the last 3 years? What carrier currently insures it and at what premium?
- The area grade is low — what's the realistic commute time and amenity access for the typical tenant pool here? Any planned neighborhood developments (good or bad) we should know about?
- What's the average days-on-market for RENTAL listings here right now (not sales)? A rising rental-DOM trend means longer vacancies and softer asking-rent achievability than the comps imply.
- What's the recent tenant-quality profile in this submarket — average credit score on applications, eviction rate, late-payment / NSF rate, and stable-employment percentage? A property-management company in the area should have these aggregated.
- How much new for-sale + rental construction is in the pipeline within 1–3 miles? Heavy new supply typically softens prices + rents 12–24 months out; constrained supply supports both.
Investment metrics
- 1% rule
- 6.09% ✓
- Cap rate
- 55.64%
- Cash-on-cash
- 176.23%
- DSCR
- 8.84
- GRM
- 1.4
CMA / ARV
- ARV (on-the-fly)
- $206,976
- Comps found
- 12
Show comp detail 12 sales within ~0.75 mi
| Address | Dist | Beds/Ba | Sqft | Sold | Price | $/sf | Match |
|---|---|---|---|---|---|---|---|
| 2400 Reisterstown Rd | 0.31mi | 3/2.0 | 1,752 (-5%) | 5mo | $75,000 | $43 | 69 |
| 608 Cumberland St | 0.30mi | 3/2.0 | 1,700 (-8%) | 2mo | $90,000 | $53 | 67 |
| 2117 N Smallwood St | 0.31mi | 3/2.5 | 1,680 (-9%) | 1mo | $192,000 | $114 | 64 |
| 1520 Appleton St | 0.42mi | 3/3.5 | 1,920 (+4%) | 4mo | $215,000 | $112 | 61 |
| 2105 Whittier Ave | 0.29mi | 3/1.5 | 1,587 (-14%) | 1mo | $80,000 | $50 | 60 |
| 1920 N Bentalou St | 0.41mi | 4/3.5 (+1) | 1,928 (+4%) | 1mo | $255,000 | $132 | 58 |
| 2402 Liberty Heights Ave | 0.63mi | 4/1.5 (+1) | 1,800 (-3%) | 4mo | $90,000 | $50 | 56 |
| 1501 N Payson St N | 0.46mi | 4/2.0 (+1) | 2,000 (+8%) | 4mo | $162,000 | $81 | 52 |
| 2500 Brookfield Ave | 0.72mi | 3/3.0 | 1,786 (-3%) | 1mo | $365,000 | $204 | 52 |
| 2009 Ruxton Ave | 0.43mi | 4/2.0 (+1) | 1,600 (-13%) | 1mo | $234,000 | $146 | 48 |
| 2521 Reisterstown Rd | 0.46mi | 3/2.0 | 1,578 (-15%) | 3mo | $215,000 | $136 | 48 |
| 2312 Edgemont Ave | 0.30mi | 4/1.5 (+1) | 2,118 (+15%) | 9mo | $147,000 | $69 | 48 |
Match score weights: distance 35% · size 25% · config 20% · recency 20%. Top-matched comps best support the ARV.
Projected returns pro-forma
-3.0% appreciation · 6.63% rent growth · sell at horizon
- IRR
- —
- Equity multiple
- 10.10×
- Total profit
- $76,466
- Equity at exit
- $4,473
- IRR
- —
- Equity multiple
- 24.00×
- Total profit
- $193,198
- Equity at exit
- $2,594
Cash invested: $8,400 (down + closing). Projections, not guarantees.
Landlord ↔ Tenant lean methodology
- Overall (CITY)
- 12 Strongly Tenant-Friendly
- State Maryland
- 27 Tenant-Leaning · D+14
- County
- — inherits STATE
- City Baltimore
- 12 Strongly Tenant-Friendly · D+58
ZIP-level market 21217
- Rents YoY
- 6.6%
- Active inventory
- 331
- Price-to-rent
- 1.4×
Monthly cashflow live
- Estimated rent
- $1,828 high interval (Pro) →
- Mortgage (P&I)
- −$157
- Tax from tax record
- −$41 /mo · $493/yr
- Insurance
- −$12
- Flood insurance flood zone
- −$66 /mo · $798/yr
- HOA
- −$0
- Vacancy / Maint / Mgmt
- −$384
- Net cashflow
- $1,167
Break-even live
UW: 25.0% down · 7.5% · 30yr · 1.5% tax · 5.0% vac · 8.0% maint · 8.0% mgmt
Financing live
Cash to close
- Down payment
- $7,500
- Closing costs
- $900
- Reserves months
- —
- Total cash needed
- —
Loan-product check · same deal, 3 products live
Conventional
25% down · 7.5% · 30yr
- Down + closing
- —
- Monthly P&I
- —
- Monthly cashflow
- —
- DSCR
- —
- Eligible?
- —
Personal DTI + credit; lowest rate.
DSCR
20% down · 8.5% · 30yr
- Down + closing
- —
- Monthly P&I
- —
- Monthly cashflow
- —
- DSCR
- —
- Eligible?
- —
No personal income docs; deal must DSCR.
Hard money
10% down · 12.0% · 12mo
- Down + closing
- —
- Monthly P&I
- —
- Monthly cashflow
- —
- DSCR
- —
- Eligible?
- —
Short-term bridge; refi at stabilization.
Rent comps 40 comps
| Address | Beds | Baths | Sqft | Rent | $/sqft | DOM | Units | Dist |
|---|---|---|---|---|---|---|---|---|
| 2614 Pennsylvania Ave Baltimore, MD | 1.0–3.0 | 1.0–2.0 | 982 | $1,141 | $1.16 | 4d | 4 | 0.14mi |
| 2505 Woodbrook Ave Baltimore, MD | 4.0 | 2.0 | 1256 | $1,745 | $1.39 | 2d | 1 | 0.20mi |
| 2128 N Pulaski St Baltimore, MD | 4.0 | 3.0 | 2166 | $2,200 | $1.02 | 43d | 1 | 0.26mi |
| 2201 Whittier Ave Baltimore, MD | 4.0 | 2.0 | 1750 | $1,700 | $0.97 | 17d | 1 | 0.27mi |
| 2201 Whittier Ave Baltimore, MD | 4.0 | 2.0 | 1750 | $1,700 | $0.97 | 43d | 1 | 0.27mi |
| 1616 N Fulton Ave Baltimore, MD | 3.0 | 2.0 | 1620 | $1,795 | $1.11 | 4d | 1 | 0.34mi |
| 2204 Clifton Ave Baltimore, MD | 3.0 | 1.0 | 1400 | $1,450 | $1.04 | 4d | 1 | 0.35mi |
| 2409 Francis St Baltimore, MD | 3.0 | 1.0 | 1298 | $1,500 | $1.16 | 43d | 1 | 0.35mi |
| 519 Sanford Pl Baltimore, MD | 3.0 | 1.0 | 1300 | $1,650 | $1.27 | 16d | 1 | 0.40mi |
| 1516 N Mount St Baltimore, MD | 3.0 | 1.5 | 1830 | $1,750 | $0.96 | 14d | 1 | 0.43mi |
| 1816 N Bentalou St Baltimore, MD | 3.0 | 2.0 | 1350 | $1,700 | $1.26 | 24d | 1 | 0.44mi |
| 1816 N Bentalou St Baltimore, MD | 3.0 | 2.0 | 1350 | $1,700 | $1.26 | 11d | 1 | 0.44mi |
| 1501 N Payson St Baltimore, MD | 3.0 | 1.0 | 1400 | $1,550 | $1.11 | 43d | 1 | 0.48mi |
| 1205 Clendenin St Baltimore, MD | 3.0 | 1.5 | 1560 | $800 | $0.51 | 24d | 1 | 0.49mi |
| 2405 W North Ave Baltimore, MD | 4.0 | 3.0 | 1826 | $1,900 | $1.04 | 4d | 1 | 0.53mi |
| 1617-A Moreland Ave Unit 2nd Flr Baltimore, MD | 2.0 | 1.0 | 1500 | $1,400 | $0.93 | 43d | 1 | 0.56mi |
| 1315 Presstman St Baltimore, MD | 4.0 | 2.0 | 1700 | $2,000 | $1.18 | 43d | 1 | 0.59mi |
| 2339 Eutaw Pl Ste 1 Baltimore, MD | 2.0 | 1.0 | 1300 | $1,275 | $0.98 | 43d | 1 | 0.60mi |
| 2028 Druid Hill Ave Baltimore, MD | 3.0 | 2.5 | 1437 | $1,799 | $1.25 | 11d | 1 | 0.65mi |
| 2028 Druid Hill Ave Unit 1 Baltimore, MD | 3.0 | 2.5 | 1437 | $1,750 | $1.22 | 2d | 1 | 0.65mi |
| 2020 McCulloh St Unit 2 Baltimore, MD | 2.0 | 2.0 | 2440 | $1,950 | $0.80 | 43d | 1 | 0.68mi |
| 2020 McCulloh St Unit 1 Baltimore, MD | 2.0 | 2.0 | 2440 | $1,650 | $0.68 | 43d | 1 | 0.68mi |
| 805 Brooks Ln #2 Baltimore, MD | 2.0 | 1.0 | 2120 | $1,500 | $0.71 | 3d | 1 | 0.73mi |
| 2407 Brookfield Ave Unit 4 Baltimore, MD | 2.0 | 2.0 | 1300 | $1,550 | $1.19 | 43d | 1 | 0.74mi |
| 3104 Tioga Pkwy Baltimore, MD | 3.0 | 2.0 | 1640 | $2,050 | $1.25 | 21d | 1 | 0.76mi |
| 1613 Riggs Ave Baltimore, MD | 3.0 | 2.5 | 1800 | $1,800 | $1.00 | 24d | 1 | 0.79mi |
| 2305 Wichita Ave Unit 1 Baltimore, MD | 3.0 | 1.0 | 1950 | $1,300 | $0.67 | 24d | 1 | 0.86mi |
| 1829 Eutaw Pl Unit B Baltimore, MD | 2.0 | 2.0 | 1278 | $2,100 | $1.64 | 4d | 1 | 0.86mi |
| 1725 Druid Hill Ave Baltimore, MD | 4.0 | 3.0 | 2195 | $2,100 | $0.96 | 24d | 1 | 0.88mi |
| 815 Lennox St Baltimore, MD | 3.0 | 3.5 | 1600 | $2,790 | $1.74 | 24d | 1 | 0.88mi |
| 1628 McCulloh St Unit 2 Baltimore, MD | 4.0 | 2.5 | 2000 | $2,000 | $1.00 | 4d | 1 | 0.94mi |
| 2812 Clifton Ave Baltimore, MD | 3.0 | 1.5 | 1650 | $1,850 | $1.12 | 43d | 1 | 0.95mi |
| 1702 Eutaw Pl Baltimore, MD | 2.0 | 2.0 | 2000 | $1,550 | $0.78 | 17d | 1 | 0.95mi |
| 736 Watts St Baltimore, MD | 3.0 | 3.5 | 2000 | $3,250 | $1.62 | 43d | 1 | 0.96mi |
| 734 Watts St Baltimore, MD | 3.0 | 3.5 | 1720 | $2,900 | $1.69 | 43d | 1 | 0.96mi |
| 918 N Bentalou St Baltimore, MD | 3.0 | 1.5 | 1485 | $1,750 | $1.18 | 43d | 1 | 0.96mi |
| 2302 Mount Royal Ter Baltimore, MD | 4.0 | 3.5 | 2351 | $3,000 | $1.28 | 24d | 1 | 0.98mi |
| 2800 Presstman St Baltimore, MD | 3.0 | 2.5 | 1460 | $1,799 | $1.23 | 24d | 1 | 1.03mi |
| 2917 Clifton Ave Baltimore, MD | 4.0 | 4.0 | 1700 | $2,150 | $1.26 | 24d | 1 | 1.04mi |
| 549 Mosher St Baltimore, MD | 3.0 | 1.0 | 2200 | $1,350 | $0.61 | 43d | 1 | 1.05mi |
Listing history 4 events
-
2026-06-18days on market $30,000 Active 3 DOM
-
2026-06-17days on market $30,000 Active 2 DOM
-
2026-06-16remarks 249-char remark
-
2026-06-16$30,000 Active 1 DOM
ⓘ Source: listings_history table (triggers on properties + properties_extension) + one-shot
backfill from property_details.listing_events for pre-trigger history.
Tax reassessment forecast MD · Partial reset (capped growth)
- Current annual tax
- $493 · $41/mo
- Projected year-2 tax
- $493 · $41/mo
- Expected delta
- $0/yr ($0/mo · 0.0%)
ⓘ Screening estimate from a state-policy table — verify with the county assessor before closing.
Climate risk First Street
- Flood 9/10 Extreme FEMA zone X (unshaded) · 99% chance over 30 yrs
- Wildfire 1/10 Low
- Heat 7/10 Severe 7 d/yr ≥103°F today · 15 d/yr by 30 yrs out
- Wind 6/10 Major 27% chance of damaging wind over 30 yrs
- Air quality 4/10 Moderate 6 unhealthy d/yr today · 7 by 30 yrs out
Nearby sold comps map
Loading sold comps map…
Walkable amenities ~0.75 mi
Loading nearby amenities…
Taxation est. · year 1
- Rental income
- $21,942
- − Mortgage interest
- −$1,680
- − Property taxes
- −$493
- − Insurance
- −$948
- − Repairs & maintenance
- −$1,755
- − Management
- −$1,755
- − Depreciation
- −$873
- Taxable income
- $14,437
- Est. tax owed @ 24.0%
- −$3,465
- After-tax cash flow
- $10,541/yr
For passive investors: Depreciation is non-cash, so a rental often shows a tax loss while cash-flowing — sheltering income. Rental losses are passive: they offset passive income freely, and up to $25,000/yr can offset ordinary (W-2) income if you actively participate and your MAGI is under $100k (phasing out to $0 by $150k); unused losses carry forward. On sale, claimed depreciation is recaptured at up to 25%, and gains may owe capital-gains tax (a 1031 exchange can defer both). Figures are a year-1 estimate at your 24.0% rate — not tax advice; consult a CPA.
Schools (NCES district)
- District
- Baltimore City Public Schools
- NCES district ID
- 2400090
- Math proficiency
- 7% ▼ -9.00%
- Reading proficiency
- 16% ▼ -5.00%
- Median HH income
- $42,108
- Composite
- 10.08/100
- National rank
- #9805
- State rank
- #24 of 24 in MD
Livability — Baltimore
- Score
- 76/100
- State rank
- #90
- US rank
- #3396
Category grades
Schools grade is shown separately in the Schools card above.
Census & demographics
- Census place
- Baltimore, MD
- County
- Baltimore City · 558,601 people
- City population
- 588,727
- Metro
- Baltimore-Columbia-Towson, MD
- Population (ZIP)
- 30,792
- Household income
- $38,409
- Rent vs Own
- Severe rent burden
- 2921.0
Population outlook (Baltimore County) Hauer SSP2
- Today (2025)
- 624,249 people
- By 2030
- 621,541 · -0.4%
- By 2040
- 609,756 · -2.3%
- By 2050
- 597,249 · -4.3%
- By 2075
- 552,236 · -11.5%
- By 2100
- 513,934 · -17.7%
Race, ethnicity, and origin ACS 2023
- Neighborhood character
- Predominantly Black (81%)
- Race & ethnicity
- Black 81% White 12% Two or more races 4% Hispanic / Latino 2% Asian 2%
- Common ancestry
- Romanian 1% Hispanic 1% Italian 1%
- Foreign-born
- 5% · Canada, China, South Korea
- Languages at home
- 94% English-only · Spanish 2% French/Haitian/Cajun 1% Chinese 1%
Political lean MEDSL · Baltimore
- 2024 margin
- Solid D (+73.0) · D 85.2% · R 12.2% · Other 2.6%
- 2008→2024 swing
- -2.5pp toward R · 2008: 75.5pp · 2024: 73.0pp
- All cycles
- 2024: D+73.0 2020: D+76.6 2016: D+74.6 2012: D+76.4 2008: D+75.5
Not yet ingested
- Civics
- —
Market trends
- HPI YoY
- ▼ -187.20%
- Current HPI
- 104.2102
- Rent YoY
- ▲ 6.63%
- Metro
- Baltimore-Columbia-Towson, MD
- State GDP YoY
- ▲ 2.97%
- F500 in state
- 12
Industry mix (Fortune 500 HQ in MD)
| Industry | F500 HQs | Revenue |
|---|---|---|
| Aerospace / Defense | 1 | $71B |
|
||
| Utilities | 1 | $25B |
|
||
| Hotels | 1 | $24B |
|
||
| Consumer Goods | 1 | $7B |
|
||
| Real Estate | 1 | $6B |
|
||
| Chemicals | 1 | $2B |
|
||
Price history
1 event — show timeline
- 2026-06-15 Listed $30,000 BRIGHT MLS
Property tax history
-0.1%/yrLatest (2025): $493 · +3.3% YoY. Source: county tax records.
Cash-flow waterfall
monthlySold comps — $/sqft
last 12 mo · ≤1 miLoading sold comps…