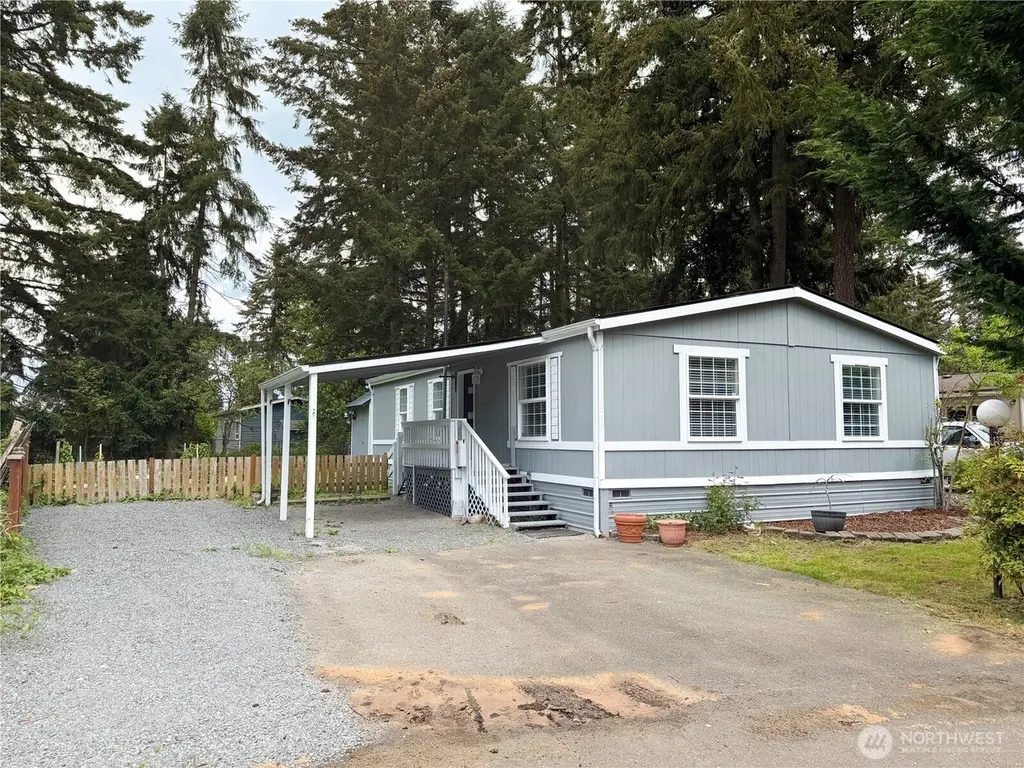
13519 201st St Ct E #135 · Graham, WA
Flood risk 1/10 · Minimal
- FEMA flood zone
- X (unshaded)
- Chance of flooding over 30 yrs
- 0.0%
- Est. flood insurance / yr
- $507 – $1,088
Fire risk 3/10 · Minor
- Est. fire insurance / yr
- $604 – $1,122
Heat risk 2/10 · Minimal
- Hot days now (above 87°F)
- 7 days/yr
- Hot days in 30 yrs
- 14 days/yr
Wind risk 1/10 · Minimal
- Chance of severe wind over 30 yrs
- —
Air-quality risk 7/10 · Major
- Unhealthy air days now
- 9 days/yr
- Unhealthy air days in 30 yrs
- 10 days/yr
Risk factors via First Street. Map © Google.
Why this score? — see what drove the B+ grade
The composite is a weighted blend of 9 inputs, each scored 0–100. Each bar is that input's sub-score; the figure is the points it added to the 100-point composite (weight × sub-score).
- Cash flow +30.0/30.0
- ARV discount +15.0/15.0
- 1% rule +10.0/10.0
- DSCR +10.0/10.0
- Schools +4.5/10.0
- Rent growth +3.3/5.0
- Livability +3.2/5.0
- Condition / age +2.5/5.0
- Appreciation +0.0/10.0
$165,000
🖨 Deal sheet 📄 Offer letter ✓ Due diligence
Listing remarks
Beautiful fully Remodel 3Bed and 2Bath Home! Welcome to Angler’s Pointe, friendly all-ages Family Park; New Roof and gutters House offers a bright, open floor plan with updated flooring lighting and painting, a spacious eat-in kitchen with new cabinets and counters; Appliances that STAY with the home! a large living room and three spacious Bedrooms The property boasts a large, fenced yard and a shed. Plus, just minutes to JBLM, freeways, and shops. Schedule you're showing today!
Key facts
- Open floor plan
- Shed
- Fenced yard
Tags
Property features AI
Finance
- Other: Taxes reported (2025); Buyer brokerage compensation: 3%
- Financial info: Land lease amount: $1,208; Listing terms: Cash, Conventional
- HOA & community: Pets allowed (see remarks); Land lease in effect
Exterior
- Parking: Carport
- Utilities: Water: Graham Hill Mutual; Power: PSE; Sewer: Park (septic); Internet: Xfinity; Electric water heater
- Home design: Manufactured home (double wide); Fleetwood make; Updated/remodeled; One level; Manufactured after 06/15/1976; Mobile home remains; Park approved for sale
- Construction: Composition and shake roof; Tie down foundation; Manufactured house structure
- Exterior features: Located in Anglers Pointe park; Bus line nearby
Interior
- Kitchen: Dishwasher; Refrigerator; Stove/Range
- Bedrooms: 3 bedrooms
- Flooring: Laminate flooring
- Bathrooms: 1 full bath; 1 three-quarter bath; 1 bathtub; 1 shower
- Heating & cooling: Forced air heating; Forced air cooling; Electric energy source
- Interior features: Water heater; Electric fireplace
- Laundry & utility: Water heater located in laundry room
Neighborhood map
What this means for you Summary
Snapshot
- This is a 3-bed/2.0-bath manufactured listed at $165k.
Deal economics
- At list price, monthly cash flow is $1k ($14k/yr) — positive.
- The deal already cash-flows at list — no discount required.
- Meets the 1% rule at list price ($3k rent vs $165k).
- Recommended offer: $163k (1.5% below list) — sets the bar for market timing.
- Cap rate 14.9% vs local median 3.6% in Graham — top-decile yield for the area; either an underpriced asset or a hidden risk that comps aren't pricing in. Stress-test before assuming the spread holds.
Location & tenants
- Location reads 64/100 on livability (#373 in WA) — a middle-class / working-renter tenant base. Strengths: employment A+, housing A+; Watch: crime C-, health & safety C-, amenities F.
- Orting School District (suburban): math 40% / reading 56% proficiency, ranked #142 of 291 in WA (top 49%) — families likely to look elsewhere, expect single-tenant / working-renter base with shorter leases.
- Zoned schools: Ptarmigan Ridge Elementary School (665 students, 35% FRL); Orting High School (864 students, 31% FRL) — zoned schools at 33% FRL track the district average.
- Market conditions: Rents rising (+3.3%/yr); 232 active listings in the ZIP; 1 comparable units currently listed for rent nearby; high-income renter base; 3,209 units permitted in Pierce County in 2024 (1,269 in 5+ unit buildings).
Forward outlook
- Local home prices are declining (-3.0%/yr); year-one equity from $1k of loan paydown is wiped out by about $5k of value loss. Plan a longer hold.
- Pierce County population projected at +26% by 2050 — long-run rental-demand tailwind backs the buy-and-hold thesis.
- At projected returns (-3.0% appreciation + 3.3% rent growth), your $46k cash investment doubles in ~4 years — after that, you're playing with house money.
Negotiation context
- It's been on market 19 days — a 2% lower offer ($163k) is reasonable based on typical stale-listing flexibility.
Questions for the listing agent
- Is there a deadline driving the sale (1031 exchange, divorce, estate, relocation)? That informs how much negotiation room exists.
- What's the average days-on-market for RENTAL listings here right now (not sales)? A rising rental-DOM trend means longer vacancies and softer asking-rent achievability than the comps imply.
- What's the recent tenant-quality profile in this submarket — average credit score on applications, eviction rate, late-payment / NSF rate, and stable-employment percentage? A property-management company in the area should have these aggregated.
- How much new for-sale + rental construction is in the pipeline within 1–3 miles? Heavy new supply typically softens prices + rents 12–24 months out; constrained supply supports both.
Investment metrics
- 1% rule
- 1.68% ✓
- Cap rate
- 14.86%
- Cash-on-cash
- 30.59%
- DSCR
- 2.36
- GRM
- 5.0
CMA / ARV
- ARV (median comp)
- $310,141
- List price
- $165,000
- Delta
- -46.80%
- Verdict
- UNDERPRICED
- Comps
- 6 within 1.0 mi
Show comp detail 12 sales within ~0.75 mi
| Address | Dist | Beds/Ba | Sqft | Sold | Price | $/sf | Match |
|---|---|---|---|---|---|---|---|
| 20020 135th Ave E #57 | 0.07mi | 3/2.0 | 1,188 (0%) | 2mo | $156,000 | $131 | 95 |
| 13609 201st Street Ct E #145 | 0.06mi | 3/2.0 | 1,188 (0%) | 15mo | $120,000 | $101 | 85 |
| 13524 200th Street Ct E #58 | 0.04mi | 3/2.0 | 1,344 (+13%) | 9mo | $175,000 | $130 | 69 |
| 20213 136th Ave E #106 | 0.08mi | 3/2.0 | 1,120 (-6%) | 23mo | $130,000 | $116 | 67 |
| 20513 135th Ave E #8 | 0.27mi | 3/2.0 | 1,296 (+9%) | 13mo | $127,000 | $98 | 61 |
| 20023 137th Avenue Ct E #138 | 0.14mi | 3/2.0 | 1,344 (+13%) | 14mo | $189,500 | $141 | 60 |
| 20403 135th Avenue Ct E #84 | 0.18mi | 3/2.0 | 1,344 (+13%) | 14mo | $179,000 | $133 | 58 |
| 20415 135th Ave E #14 | 0.22mi | 3/2.0 | 1,080 (-9%) | 22mo | $125,000 | $116 | 56 |
| 20321 135th Avenue Ct E #86 | 0.17mi | 3/2.0 | 1,344 (+13%) | 19mo | $170,000 | $126 | 54 |
| 20403 135th Ave E #20 | 0.18mi | 3/2.0 | 1,344 (+13%) | 18mo | $182,000 | $135 | 54 |
| 20204 135th Ave E #45 | 0.09mi | 3/2.0 | 1,026 (-14%) | 24mo | $115,000 | $112 | 53 |
| 13508 204th Street Ct E #70 | 0.23mi | 3/2.0 | 1,344 (+13%) | 20mo | $189,500 | $141 | 50 |
Match score weights: distance 35% · size 25% · config 20% · recency 20%. Top-matched comps best support the ARV.
Projected returns pro-forma
-3.0% appreciation · 3.32% rent growth · sell at horizon
- IRR
- 25.6%
- Equity multiple
- 2.06×
- Total profit
- $49,124
- Equity at exit
- $24,602
- IRR
- 33.5%
- Equity multiple
- 4.09×
- Total profit
- $142,909
- Equity at exit
- $14,266
Cash invested: $46,200 (down + closing). Projections, not guarantees.
Landlord ↔ Tenant lean methodology
- Overall (STATE)
- 28 Tenant-Leaning
- State Washington
- 28 Tenant-Leaning · D+8
- County
- — inherits STATE
- City
- — inherits STATE
ZIP-level market 98338
- Rents YoY
- 3.3%
- Active inventory
- 232
- Price-to-rent
- 5.0×
Monthly cashflow live
- Estimated rent
- $2,774 medium interval (Pro) →
- Mortgage (P&I)
- −$865
- Tax from tax record
- −$80 /mo · $961/yr
- Insurance
- −$69
- HOA
- −$0
- Vacancy / Maint / Mgmt
- −$583
- Net cashflow
- $1,178
Break-even live
UW: 25.0% down · 7.5% · 30yr · 1.5% tax · 5.0% vac · 8.0% maint · 8.0% mgmt
Financing live
Cash to close
- Down payment
- $41,250
- Closing costs
- $4,950
- Reserves months
- —
- Total cash needed
- —
Loan-product check · same deal, 3 products live
Conventional
25% down · 7.5% · 30yr
- Down + closing
- —
- Monthly P&I
- —
- Monthly cashflow
- —
- DSCR
- —
- Eligible?
- —
Personal DTI + credit; lowest rate.
DSCR
20% down · 8.5% · 30yr
- Down + closing
- —
- Monthly P&I
- —
- Monthly cashflow
- —
- DSCR
- —
- Eligible?
- —
No personal income docs; deal must DSCR.
Hard money
10% down · 12.0% · 12mo
- Down + closing
- —
- Monthly P&I
- —
- Monthly cashflow
- —
- DSCR
- —
- Eligible?
- —
Short-term bridge; refi at stabilization.
Rent comps 1 comps
| Address | Beds | Baths | Sqft | Rent | $/sqft | DOM | Units | Dist |
|---|---|---|---|---|---|---|---|---|
| 14025 198th St E Graham, WA | 3.0 | 2.0 | 1047 | $2,795 | $2.67 | 1d | 1 | 0.37mi |
Listing history 6 events
-
2026-06-04status $165,000 Pending 19 DOM
-
2026-06-03days on market $165,000 Active 19 DOM
-
2026-06-02days on market $165,000 Active 18 DOM
-
2026-06-01days on market $165,000 Active 17 DOM
-
2026-05-31days on market $165,000 Active 16 DOM
-
2026-05-15$165,000 Active
ⓘ Source: listings_history table (triggers on properties + properties_extension) + one-shot
backfill from property_details.listing_events for pre-trigger history.
Tax reassessment forecast WA · Resets to sale price
- Current annual tax
- $961 · $80/mo
- Projected year-2 tax
- $1,617 · $135/mo
- Expected delta
- +$656/yr (+$55/mo · 68.2%)
ⓘ Screening estimate from a state-policy table — verify with the county assessor before closing.
Climate risk First Street
- Flood 1/10 Low FEMA zone X (unshaded) · 0% chance over 30 yrs
- Wildfire 3/10 Moderate
- Heat 2/10 Low 7 d/yr ≥87°F today · 14 d/yr by 30 yrs out
- Wind 1/10 Low
- Air quality 7/10 Severe 9 unhealthy d/yr today · 10 by 30 yrs out
Nearby sold comps map
Loading sold comps map…
Walkable amenities ~0.75 mi
Loading nearby amenities…
Taxation est. · year 1
- Rental income
- $33,292
- − Mortgage interest
- −$9,243
- − Property taxes
- −$961
- − Insurance
- −$825
- − Repairs & maintenance
- −$2,663
- − Management
- −$2,663
- − Depreciation
- −$4,800
- Taxable income
- $12,136
- Est. tax owed @ 24.0%
- −$2,913
- After-tax cash flow
- $11,218/yr
For passive investors: Depreciation is non-cash, so a rental often shows a tax loss while cash-flowing — sheltering income. Rental losses are passive: they offset passive income freely, and up to $25,000/yr can offset ordinary (W-2) income if you actively participate and your MAGI is under $100k (phasing out to $0 by $150k); unused losses carry forward. On sale, claimed depreciation is recaptured at up to 25%, and gains may owe capital-gains tax (a 1031 exchange can defer both). Figures are a year-1 estimate at your 24.0% rate — not tax advice; consult a CPA.
Schools (NCES district)
- District
- Orting School District
- NCES district ID
- 5306450
- Math proficiency
- 40% ▬ 0.00%
- Reading proficiency
- 56% ▬ 0.00%
- Median HH income
- $72,768
- Composite
- 45.37/100
- National rank
- #5719
- State rank
- #142 of 291 in WA
Livability — Graham
- Score
- 64/100
- State rank
- #373
- US rank
- #14219
Category grades
Schools grade is shown separately in the Schools card above.
Census & demographics
- Census place
- Graham, WA
- County
- Pierce County · 788,257 people
- City population
- 32,687
- Metro
- Seattle-Tacoma-Bellevue, WA
- Population (ZIP)
- 32,687
- Household income
- $114,819
- Rent vs Own
- Severe rent burden
- 236.0
Population outlook (Pierce County) Hauer SSP2
- Today (2025)
- 956,648 people
- By 2030
- 1,010,862 · +5.7%
- By 2040
- 1,113,170 · +16.4%
- By 2050
- 1,206,524 · +26.1%
- By 2075
- 1,436,425 · +50.2%
- By 2100
- 1,563,654 · +63.5%
Race, ethnicity, and origin ACS 2023
- Neighborhood character
- Predominantly White (71%)
- Race & ethnicity
- White 71% Two or more races 15% Hispanic / Latino 12% Asian 3% Black 3% Pacific Islander 2% Native American 1%
- Hispanic origin (detail)
- Mexican 7%
- Common ancestry
- Italian 4% Portuguese 4% Iranian 3%
- Foreign-born
- 7% · Canada, South Korea, China
- Languages at home
- 88% English-only · Spanish 5% Russian/Polish/Slavic 2% Other Asian/Pacific 1%
Political lean MEDSL · Pierce
- 2024 margin
- D (+10.8) · D 53.9% · R 43.1% · Other 3.0%
- 2008→2024 swing
- -1.4pp toward R · 2008: 12.2pp · 2024: 10.8pp
- All cycles
- 2024: D+10.8 2020: D+11.2 2016: D+7.5 2012: D+11.0 2008: D+12.2
Not yet ingested
- Civics
- —
Market trends
- HPI YoY
- ▼ -501.28%
- Current HPI
- 304.4241
- Rent YoY
- ▲ 3.32%
- Metro
- Seattle-Tacoma-Bellevue, WA
- State GDP YoY
- ▲ 4.65%
- F500 in state
- 22
Industry mix (Fortune 500 HQ in WA)
| Industry | F500 HQs | Revenue |
|---|---|---|
| Retail | 2 | $269B |
|
||
| Technology / Retail | 1 | $638B |
|
||
| Technology | 1 | $245B |
|
||
| Telecommunications | 1 | $38B |
|
||
| Food / Beverage | 1 | $36B |
|
||
| Automotive / Trucks | 1 | $34B |
|
||
Price history
2 events — show timeline
- 2026-06-03 Pending — NWMLS as Distributed by MLS Grid
- 2026-05-15 Listed $165,000 NWMLS as Distributed by MLS Grid
Property tax history
+6.2%/yrLatest (2026): $961 · +4850.5% YoY. Source: county tax records.
Cash-flow waterfall
monthlySold comps — $/sqft
last 12 mo · ≤1 miLoading sold comps…