 🏗️ New Construction
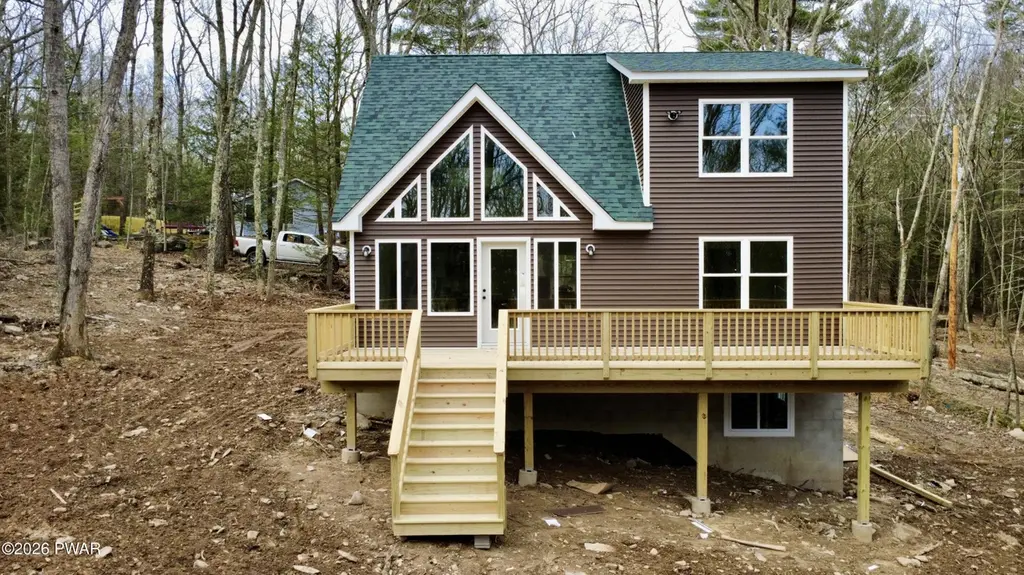
136 Cree Rd · Barryville, NY
Flood risk No data
- FEMA flood zone
- —
- Chance of flooding over 30 yrs
- —
- Est. flood insurance / yr
- —
Fire risk No data
- Est. fire insurance / yr
- —
Heat risk No data
- Hot days now (above threshold)
- —
- Hot days in 30 yrs
- —
Wind risk No data
- Chance of severe wind over 30 yrs
- —
Air-quality risk No data
- Unhealthy air days now
- —
- Unhealthy air days in 30 yrs
- —
Risk factors via First Street. Map © Google.
Why this score? — see what drove the D- grade
The composite is a weighted blend of 9 inputs, each scored 0–100. Each bar is that input's sub-score; the figure is the points it added to the 100-point composite (weight × sub-score).
- Appreciation +10.0/10.0
- ARV discount +7.5/15.0
- Cash flow +6.5/30.0
- Schools +4.7/10.0
- Rent growth +2.5/5.0
- Livability +2.5/5.0
- Condition / age +2.5/5.0
- 1% rule +1.9/10.0
- DSCR +0.8/10.0
$365,000
🖨 Deal sheet 📄 Offer letter ✓ Due diligence
Listing remarks
New construction with vaulted ceilings, tons of glass, a huge deck across the back of the house. Full unfinished basement. 3 bedrooms with primary on the first floor. Big open loft with two bedrooms on the second floor Primary bedroom has his and her closets. Kitchen is light and bright with quartz and an island. Property is at end of the road with association owning part of the property adjoining. Plenty of privacy. Walk to pristine Walker Lake. Owner is co-listing agent and a PA licensed broker and contractor.
Key facts
- Big open loft
- His and her closets
- New construction
Tags
Neighborhood map
What this means for you Summary
Snapshot
- This is a 3-bed/2.5-bath single-family listed at $365k.
Deal economics
- At list price, monthly cash flow is $-607 ($-7k/yr) — negative.
- To cash-flow at today's rent, offer at most $274k (24.8% below list).
- To meet the 1% rule (rent ≥ 1% of price), the offer needs to be $250k (31.6% below list).
- Recommended offer: $250k (31.6% below list) — sets the bar for 1% rule.
- Cap rate 4.3% vs local median 2.3% in Barryville — top-decile yield for the area; either an underpriced asset or a hidden risk that comps aren't pricing in. Stress-test before assuming the spread holds.
Location & tenants
- Location reads: area grade D — affects rentability + tenant quality, not the cash-flow math above.
- Delaware Valley SD (rural): math 41% / reading 66% proficiency, ranked #121 of 539 in PA (top 22%) — acceptable for families but not a draw, mixed tenant base, ~2y average lease.
- Market conditions: 1 comparable units currently listed for rent nearby; 213 units permitted in Pike County in 2024 (0 in 5+ unit buildings).
Forward outlook
- In year one you build about $39k of equity ($3k loan paydown + $36k appreciation (10.0% local appreciation)).
- Pike County population projected at -25% by 2050 — secular population decline; favor cash flow + early exit over multi-decade hold.
- By year 2, paydown + projected appreciation supports a ~$62k cash-out refi (75% LTV) — recoverable capital for the next deal without selling this one.
Negotiation context
- Only 5 days on market — expect competitive offers; lowballing is unlikely to land.
Questions for the listing agent
- What do current leases actually rent for vs. the listed asking? Can we see a recent rent roll and the last 12 months of T-12 income?
- What does the HOA fee cover, when was the last increase, and are there any pending special assessments or reserve-fund shortfalls?
- Is there a deadline driving the sale (1031 exchange, divorce, estate, relocation)? That informs how much negotiation room exists.
- The area grade is low — what's the realistic commute time and amenity access for the typical tenant pool here? Any planned neighborhood developments (good or bad) we should know about?
- What's the average days-on-market for RENTAL listings here right now (not sales)? A rising rental-DOM trend means longer vacancies and softer asking-rent achievability than the comps imply.
- What's the recent tenant-quality profile in this submarket — average credit score on applications, eviction rate, late-payment / NSF rate, and stable-employment percentage? A property-management company in the area should have these aggregated.
- How much new for-sale + rental construction is in the pipeline within 1–3 miles? Heavy new supply typically softens prices + rents 12–24 months out; constrained supply supports both.
Investment metrics
- 1% rule
- 0.69% ✗
- Cap rate
- 4.28%
- Cash-on-cash
- -7.18%
- DSCR
- 0.68
- GRM
- 12.1
CMA / ARV
- ARV (on-the-fly)
- $362,208
- Comps found
- 10
Show comp detail 10 sales within ~0.75 mi
| Address | Dist | Beds/Ba | Sqft | Sold | Price | $/sf | Match |
|---|---|---|---|---|---|---|---|
| 136 Cree Rd | 0.00mi | 3/2.5 | 1,568 (0%) | 0mo | $364,000 | $232 | 100 |
| 163 Erie Rd | 0.20mi | 3/2.0 | 1,550 (-1%) | 7mo | $425,000 | $274 | 81 |
| 144 Onandaga Rd | 0.09mi | 3/2.0 | 1,526 (-3%) | 11mo | $342,500 | $224 | 80 |
| 167 Oneida Rd | 0.16mi | 3/2.0 | 1,628 (+4%) | 13mo | $282,499 | $174 | 73 |
| 119 Cahoonzie Rd | 0.40mi | 3/2.0 | 1,615 (+3%) | 8mo | $355,000 | $220 | 68 |
| 150 Cree Rd | 0.12mi | 3/2.0 | 1,344 (-14%) | 2mo | $355,000 | $264 | 67 |
| 141 Cahoonzie Rd | 0.46mi | 3/2.0 | 1,491 (-5%) | 6mo | $339,000 | $227 | 64 |
| 142 Onandaga Rd | 0.17mi | 3/2.0 | 1,344 (-14%) | 16mo | $309,900 | $231 | 53 |
| 136 Iroquois Rd | 0.43mi | 3/2.0 | 1,344 (-14%) | 5mo | $315,000 | $234 | 50 |
| 146 Mohawk Rd | 0.53mi | 3/2.0 | 1,400 (-11%) | 13mo | $315,000 | $225 | 45 |
Match score weights: distance 35% · size 25% · config 20% · recency 20%. Top-matched comps best support the ARV.
Projected returns pro-forma
10.0% appreciation · 3.0% rent growth · sell at horizon
- IRR
- 19.2%
- Equity multiple
- 2.56×
- Total profit
- $158,686
- Equity at exit
- $326,306
- IRR
- 17.7%
- Equity multiple
- 5.91×
- Total profit
- $497,877
- Equity at exit
- $703,690
Cash invested: $101,418 (down + closing). Projections, not guarantees.
Landlord ↔ Tenant lean methodology
- Overall (STATE)
- 15 Strongly Tenant-Friendly
- State New York
- 15 Strongly Tenant-Friendly · D+10
- County
- — inherits STATE
- City
- — inherits STATE
ZIP-level market 18458
- Home prices YoY
- 13.2%
- Price-to-rent
- 12.2×
Monthly cashflow live
- Estimated rent
- $2,495 medium interval (Pro) →
- Mortgage (P&I)
- −$1,899
- Tax est. 1.5%
- −$453 /mo · $5,433/yr
- Insurance
- −$151
- HOA
- −$75
- Vacancy / Maint / Mgmt
- −$524
- Net cashflow
- $-607
Break-even live
Sensitivity live
| Price | -10% $-357 | -5% $-482 | +0% $-607 | +5% $-732 | +10% $-857 |
|---|---|---|---|---|---|
| Rent | -10% $-804 | -5% $-706 | +0% $-607 | +5% $-509 | +10% $-410 |
| Rate | -1.0pp $-425 | -0.5pp $-515 | base $-607 | +0.5pp $-701 | +1.0pp $-796 |
UW: 25.0% down · 7.5% · 30yr · 1.5% tax · 5.0% vac · 8.0% maint · 8.0% mgmt
Financing live
Cash to close
- Down payment
- $90,552
- Closing costs
- $10,866
- Reserves months
- —
- Total cash needed
- —
Loan-product check · same deal, 3 products live
Conventional
25% down · 7.5% · 30yr
- Down + closing
- —
- Monthly P&I
- —
- Monthly cashflow
- —
- DSCR
- —
- Eligible?
- —
Personal DTI + credit; lowest rate.
DSCR
20% down · 8.5% · 30yr
- Down + closing
- —
- Monthly P&I
- —
- Monthly cashflow
- —
- DSCR
- —
- Eligible?
- —
No personal income docs; deal must DSCR.
Hard money
10% down · 12.0% · 12mo
- Down + closing
- —
- Monthly P&I
- —
- Monthly cashflow
- —
- DSCR
- —
- Eligible?
- —
Short-term bridge; refi at stabilization.
Rent comps 1 comps
| Address | Beds | Baths | Sqft | Rent | $/sqft | DOM | Units | Dist |
|---|---|---|---|---|---|---|---|---|
| 150 Cree Rd Shohola, PA | 3.0 | 2.0 | 1344 | $2,495 | $1.86 | 1d | 1 | 0.13mi |
HOA detail
- Monthly dues
- $75 · $900/yr
Listing history 3 events
-
2026-04-22price $365,000
-
2026-04-22status Pending
-
2026-04-16$349,000 Active
ⓘ Source: listings_history table (triggers on properties + properties_extension) + one-shot
backfill from property_details.listing_events for pre-trigger history.
Nearby sold comps map
Loading sold comps map…
Walkable amenities ~0.75 mi
Loading nearby amenities…
Taxation est. · year 1
- Rental income
- $29,940
- − Mortgage interest
- −$20,289
- − Property taxes
- −$5,433
- − Insurance
- −$1,811
- − Repairs & maintenance
- −$2,395
- − Management
- −$2,395
- − HOA
- −$900
- − Depreciation
- −$10,537
- Taxable loss
- −$13,821
- Est. tax savings @ 24.0%
- +$3,317
- After-tax cash flow
- $-3,968/yr
For passive investors: Depreciation is non-cash, so a rental often shows a tax loss while cash-flowing — sheltering income. Rental losses are passive: they offset passive income freely, and up to $25,000/yr can offset ordinary (W-2) income if you actively participate and your MAGI is under $100k (phasing out to $0 by $150k); unused losses carry forward. On sale, claimed depreciation is recaptured at up to 25%, and gains may owe capital-gains tax (a 1031 exchange can defer both). Figures are a year-1 estimate at your 24.0% rate — not tax advice; consult a CPA.
Schools (NCES district)
- District
- Delaware Valley SD
- NCES district ID
- 4207530
- Math proficiency
- 41% ▼ -12.00%
- Reading proficiency
- 66% ▼ -9.00%
- Median HH income
- $64,202
- Composite
- 46.95/100
- National rank
- #2359
- State rank
- #121 of 539 in PA
Livability — Barryville
No livability data for this city. (Only ~50 U.S. cities are tracked.)
Census & demographics
- Population (ZIP)
- 3,576
Population outlook (Pike County) Hauer SSP2
- Today (2025)
- 53,548 people
- By 2030
- 51,622 · -3.6%
- By 2040
- 46,490 · -13.2%
- By 2050
- 40,372 · -24.6%
- By 2075
- 31,951 · -40.3%
- By 2100
- 26,821 · -49.9%
Race, ethnicity, and origin ACS 2023
- Neighborhood character
- Predominantly White (93%)
- Race & ethnicity
- White 93% Two or more races 4% Hispanic / Latino 3% Asian 1%
- Common ancestry
- Romanian 7% Lithuanian 2% Serbian 1%
- Foreign-born
- 3% · Canada
- Languages at home
- 95% English-only · German/W. Germanic 2% Spanish 2% Other Indo-European 1%
Political lean MEDSL · Pike
- 2024 margin
- Strong R (+24.1) · D 37.6% · R 61.6%
- 2008→2024 swing
- -19.8pp toward R · 2008: -4.2pp · 2024: -24.1pp
- All cycles
- 2024: R+24.1 2020: R+19.0 2016: R+26.0 2012: R+11.0 2008: R+4.2
Not yet ingested
- Civics
- —
Market trends
- HPI YoY
- ▲ 31.80%
- Current HPI
- 272.6294
- Rent YoY
- —
- Metro
- —
- State GDP YoY
- ▲ 2.60%
- F500 in state
- 92
Industry mix (Fortune 500 HQ in NY)
| Industry | F500 HQs | Revenue |
|---|---|---|
| Financial Services | 10 | $950B |
|
||
| Consumer Goods | 9 | $162B |
|
||
| Insurance | 4 | $225B |
|
||
| Telecommunications | 2 | $144B |
|
||
| Pharmaceuticals | 2 | $112B |
|
||
| Media / Entertainment | 2 | $69B |
|
||
Price history
+4.6% since first listed3 events — show timeline
- 2026-04-22 Price Changed $365,000 PWMLS
- 2026-04-22 Pending — PWMLS
- 2026-04-16 Listed $349,000 PWMLS
Cash-flow waterfall
monthlySold comps — $/sqft
last 12 mo · ≤1 miLoading sold comps…