12 Beach Lane Ct · Ogden Dunes, IN
Flood risk 1/10 · Minimal
- FEMA flood zone
- X (unshaded)
- Chance of flooding over 30 yrs
- 0.0%
- Est. flood insurance / yr
- $507 – $1,088
Fire risk 3/10 · Minor
- Est. fire insurance / yr
- $717 – $1,331
Heat risk 2/10 · Minimal
- Hot days now (above 100°F)
- 6 days/yr
- Hot days in 30 yrs
- 12 days/yr
Wind risk 2/10 · Minimal
- Chance of severe wind over 30 yrs
- 1.0%
Air-quality risk 4/10 · Minor
- Unhealthy air days now
- 5 days/yr
- Unhealthy air days in 30 yrs
- 6 days/yr
Risk factors via First Street. Map © Google.
Why this score? — see what drove the B- grade
The composite is a weighted blend of 9 inputs, each scored 0–100. Each bar is that input's sub-score; the figure is the points it added to the 100-point composite (weight × sub-score).
- Cash flow +27.3/30.0
- 1% rule +9.6/10.0
- DSCR +9.5/10.0
- ARV discount +7.5/15.0
- Livability +3.7/5.0
- Rent growth +3.6/5.0
- Schools +2.7/10.0
- Condition / age +2.5/5.0
- Appreciation +0.0/10.0
$100,000
🖨 Deal sheet 📄 Offer letter ✓ Due diligence
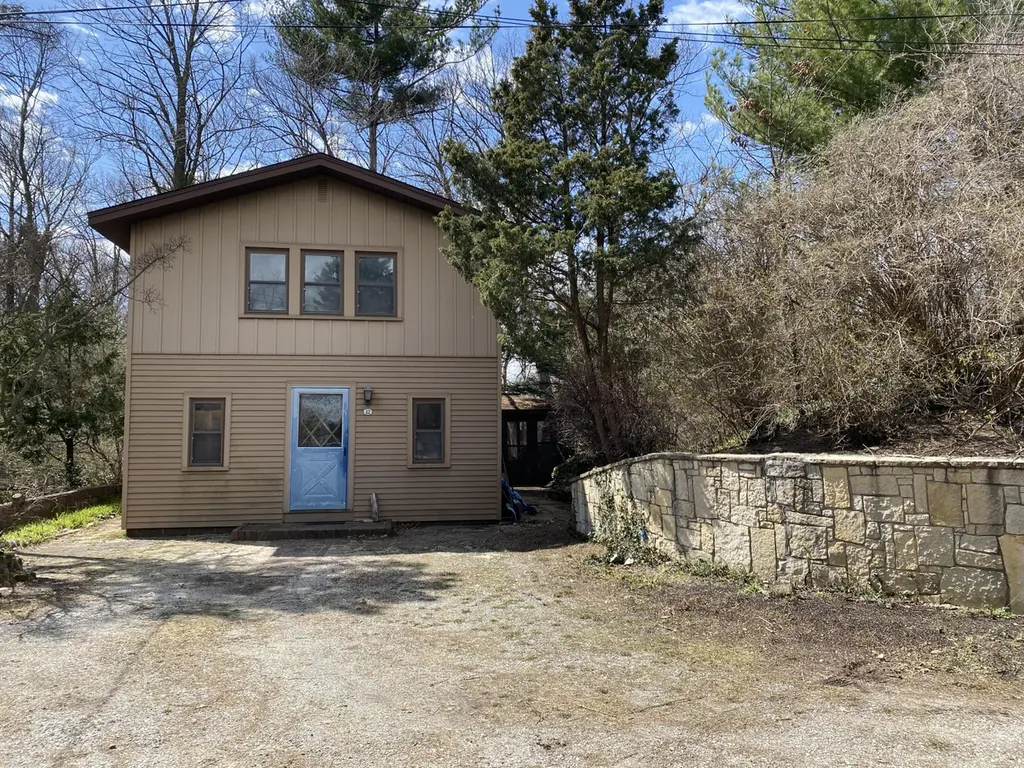
Listing remarks
GREAT LOCATION - SHORT WALK TO LAKE MICHIGAN - PROPERTY IS ONLY BEING SOLD TOGETHER WITH ADJACENT PROPERTY, 14 BEACH LANE CT, separate MLS #835973 with property tax id 640226451028000017. This charming 1934 summer cottage is typical of small homes built in the early days of Ogden Dunes. The house sets discreetly in a dune-top landscape. House awaits your creative ideas and remodelling updates. The property is for sale in "AS-IS" condition.
Key facts
- Dune-top landscape
- 6,969 sq ft lot
- Built 1934
Tags
Property features AI
Exterior
- Parking: Driveway with gravel surface
- Utilities: Public water; Septic tank sewer
- Home design: Two-story house; Built in 1934
- Construction: Asphalt roof; Year built 1934
- Exterior features: Trees/woods view; Asphalt roof
Interior
- Kitchen: Gas range; Refrigerator
- Bedrooms: Primary bedroom; Second bedroom
- Bathrooms: 1 full bathroom
- Heating & cooling: Forced air heating (natural gas); Other cooling
- Interior features: Entrance foyer; Vaulted ceilings; Open floor plan
Neighborhood map
What this means for you Summary
Snapshot
- This is a 2-bed/1.0-bath single-family listed at $100k.
Deal economics
- At list price, monthly cash flow is $291 ($3k/yr) — positive.
- The deal already cash-flows at list — no discount required.
- Meets the 1% rule at list price ($1k rent vs $100k).
- Recommended offer: $97k (3.0% below list) — sets the bar for market timing.
Location & tenants
- Location reads 73/100 on livability (#102 in IN) — a middle-class / working-renter tenant base. Strengths: crime A+, employment A+, housing A+; Watch: cost of living C-, amenities F, commute F.
- Portage Township Schools (suburban): math 26% / reading 36% proficiency, ranked #221 of 301 in IN (top 73%) — families likely to look elsewhere, expect single-tenant / working-renter base with shorter leases.
- Market conditions: Rents rising fast (+4.3%/yr); 311 active listings in the ZIP; solid renter incomes; 542 units permitted in Porter County in 2024 (0 in 5+ unit buildings).
Forward outlook
- Local home prices are declining (-3.0%/yr); year-one equity from $691 of loan paydown is wiped out by about $3k of value loss. Plan a longer hold.
- Porter County population projected at +6% by 2050 — modest demand growth; plan on rents tracking national, not racing it.
- At projected returns (-3.0% appreciation + 4.3% rent growth), your $28k cash investment doubles in ~8 years — after that, you're playing with house money.
Negotiation context
- It's been on market 33 days — a 3% lower offer ($97k) is reasonable based on typical stale-listing flexibility.
Risks & watch-outs
- Watch-outs: property tax is 3.6% of price; built in 1934 — expect roof / HVAC / electrical / plumbing capex.
Questions for the listing agent
- It's been on market 33 days. Have you received any prior offers? Is the seller open to a 3% concession, seller financing, or rate buy-down credit?
- Built in 1934 — when were the roof, HVAC, electrical panel, plumbing, and water heater last replaced?
- Property tax is high relative to price — has the assessment been appealed recently, and will the sale trigger a re-assessment?
- Is there a deadline driving the sale (1031 exchange, divorce, estate, relocation)? That informs how much negotiation room exists.
- What's the average days-on-market for RENTAL listings here right now (not sales)? A rising rental-DOM trend means longer vacancies and softer asking-rent achievability than the comps imply.
- What's the recent tenant-quality profile in this submarket — average credit score on applications, eviction rate, late-payment / NSF rate, and stable-employment percentage? A property-management company in the area should have these aggregated.
- How much new for-sale + rental construction is in the pipeline within 1–3 miles? Heavy new supply typically softens prices + rents 12–24 months out; constrained supply supports both.
Investment metrics
- 1% rule
- 1.46% ✓
- Cap rate
- 9.78%
- Cash-on-cash
- 12.45%
- DSCR
- 1.55
- GRM
- 5.7
CMA / ARV
- ARV (on-the-fly)
- $288,960
- Comps found
- 3
Show comp detail 3 sales within ~0.75 mi
| Address | Dist | Beds/Ba | Sqft | Sold | Price | $/sf | Match |
|---|---|---|---|---|---|---|---|
| 12 Beach Lane Ct | 0.00mi | 2/1.0 | 1,120 (0%) | 0mo | $56,000 | $50 | 100 |
| 18 Diana Rd | 0.31mi | 1/2.0 (-1) | 1,256 (+12%) | 2mo | $375,000 | $299 | 55 |
| 3 The Thumb | 0.43mi | 2/1.5 | 1,280 (+14%) | 2mo | $330,000 | $258 | 53 |
Match score weights: distance 35% · size 25% · config 20% · recency 20%. Top-matched comps best support the ARV.
Projected returns pro-forma
-3.0% appreciation · 4.29% rent growth · sell at horizon
- IRR
- 4.0%
- Equity multiple
- 1.16×
- Total profit
- $4,350
- Equity at exit
- $14,910
- IRR
- 14.9%
- Equity multiple
- 2.29×
- Total profit
- $36,229
- Equity at exit
- $8,646
Cash invested: $28,000 (down + closing). Projections, not guarantees.
Landlord ↔ Tenant lean methodology
- Overall (STATE)
- 90 Strongly Landlord-Friendly
- State Indiana
- 90 Strongly Landlord-Friendly · R+11
- County
- — inherits STATE
- City
- — inherits STATE
ZIP-level market 46368
- Rents YoY
- 4.3%
- Active inventory
- 311
- Price-to-rent
- 5.7×
Monthly cashflow live
- Estimated rent
- $1,461 medium interval (Pro) →
- Mortgage (P&I)
- −$524
- Tax from tax record
- −$298 /mo · $3,570/yr
- Insurance
- −$42
- HOA
- −$0
- Vacancy / Maint / Mgmt
- −$307
- Net cashflow
- $291
Break-even live
UW: 25.0% down · 7.5% · 30yr · 1.5% tax · 5.0% vac · 8.0% maint · 8.0% mgmt
Financing live
Cash to close
- Down payment
- $25,000
- Closing costs
- $3,000
- Reserves months
- —
- Total cash needed
- —
Loan-product check · same deal, 3 products live
Conventional
25% down · 7.5% · 30yr
- Down + closing
- —
- Monthly P&I
- —
- Monthly cashflow
- —
- DSCR
- —
- Eligible?
- —
Personal DTI + credit; lowest rate.
DSCR
20% down · 8.5% · 30yr
- Down + closing
- —
- Monthly P&I
- —
- Monthly cashflow
- —
- DSCR
- —
- Eligible?
- —
No personal income docs; deal must DSCR.
Hard money
10% down · 12.0% · 12mo
- Down + closing
- —
- Monthly P&I
- —
- Monthly cashflow
- —
- DSCR
- —
- Eligible?
- —
Short-term bridge; refi at stabilization.
Listing history 3 events
-
2026-05-06status Pending
-
2026-04-28historical Active Under Contract
-
2026-04-03$100,000 Active
ⓘ Source: listings_history table (triggers on properties + properties_extension) + one-shot
backfill from property_details.listing_events for pre-trigger history.
Tax reassessment forecast IN · Partial reset (capped growth)
- Current annual tax
- $3,570 · $298/mo
- Projected year-2 tax
- $3,570 · $298/mo
- Expected delta
- $0/yr ($0/mo · 0.0%)
ⓘ Screening estimate from a state-policy table — verify with the county assessor before closing.
Climate risk First Street
- Flood 1/10 Low FEMA zone X (unshaded) · 0% chance over 30 yrs
- Wildfire 3/10 Moderate
- Heat 2/10 Low 6 d/yr ≥100°F today · 12 d/yr by 30 yrs out
- Wind 2/10 Low 100% chance of damaging wind over 30 yrs
- Air quality 4/10 Moderate 5 unhealthy d/yr today · 6 by 30 yrs out
Nearby sold comps map
Loading sold comps map…
Walkable amenities ~0.75 mi
Loading nearby amenities…
Taxation est. · year 1
- Rental income
- $17,531
- − Mortgage interest
- −$5,602
- − Property taxes
- −$3,570
- − Insurance
- −$500
- − Repairs & maintenance
- −$1,403
- − Management
- −$1,403
- − Depreciation
- −$2,909
- Taxable income
- $2,146
- Est. tax owed @ 24.0%
- −$515
- After-tax cash flow
- $2,972/yr
For passive investors: Depreciation is non-cash, so a rental often shows a tax loss while cash-flowing — sheltering income. Rental losses are passive: they offset passive income freely, and up to $25,000/yr can offset ordinary (W-2) income if you actively participate and your MAGI is under $100k (phasing out to $0 by $150k); unused losses carry forward. On sale, claimed depreciation is recaptured at up to 25%, and gains may owe capital-gains tax (a 1031 exchange can defer both). Figures are a year-1 estimate at your 24.0% rate — not tax advice; consult a CPA.
Schools (NCES district)
- District
- Portage Township Schools
- NCES district ID
- 1809150
- Math proficiency
- 26% ▼ -15.00%
- Reading proficiency
- 36% ▼ -10.00%
- Median HH income
- $53,880
- Composite
- 27.37/100
- National rank
- #6978
- State rank
- #221 of 301 in IN
Livability — Ogden Dunes
- Score
- 73/100
- State rank
- #102
- US rank
- #5511
Category grades
Schools grade is shown separately in the Schools card above.
Census & demographics
- Census place
- Ogden Dunes, IN
- County
- Porter County · 151,647 people
- Metro
- Chicago-Naperville-Elgin, IL-IN-WI
- Population (ZIP)
- 40,301
- Household income
- $76,368
- Rent vs Own
- Severe rent burden
- 856.0
Population outlook (Porter County) Hauer SSP2
- Today (2025)
- 177,804 people
- By 2030
- 181,552 · +2.1%
- By 2040
- 185,830 · +4.5%
- By 2050
- 187,498 · +5.5%
- By 2075
- 189,585 · +6.6%
- By 2100
- 183,722 · +3.3%
Race, ethnicity, and origin ACS 2023
- Neighborhood character
- Predominantly White (67%)
- Race & ethnicity
- White 67% Hispanic / Latino 18% Two or more races 10% Black 10% Asian 1%
- Hispanic origin (detail)
- Mexican 13% Puerto Rican 4%
- Common ancestry
- Romanian 6% Slovak 2% Iranian 1%
- Foreign-born
- 3% · Canada
- Languages at home
- 92% English-only · Spanish 6%
Political lean MEDSL · Porter
- 2024 margin
- R (+10.5) · D 43.8% · R 54.3% · Other 1.8%
- 2008→2024 swing
- -17.7pp toward R · 2008: 7.2pp · 2024: -10.5pp
- All cycles
- 2024: R+10.5 2020: R+6.1 2016: R+6.8 2012: D+3.8 2008: D+7.2
Not yet ingested
- Civics
- —
Market trends
- HPI YoY
- ▼ -195.94%
- Current HPI
- 181.3254
- Rent YoY
- ▲ 4.29%
- Metro
- Chicago-Naperville-Elgin, IL-IN-WI
- State GDP YoY
- ▲ 2.90%
- F500 in state
- 18
Industry mix (Fortune 500 HQ in IN)
| Industry | F500 HQs | Revenue |
|---|---|---|
| Industrial Machinery | 2 | $37B |
|
||
| Healthcare | 1 | $177B |
|
||
| Pharmaceuticals | 1 | $45B |
|
||
| Metals / Steel | 1 | $18B |
|
||
| Agriculture | 1 | $17B |
|
||
| Packaging | 1 | $12B |
|
||
Price history
3 events — show timeline
- 2026-05-06 Pending — NIRA MLS as Distributed by MLS Grid
- 2026-04-28 Contingent — NIRA MLS as Distributed by MLS Grid
- 2026-04-03 Listed $100,000 NIRA MLS as Distributed by MLS Grid
Property tax history
+16.3%/yrLatest (2024): $3,570 · +219.6% YoY. Source: county tax records.
Cash-flow waterfall
monthlySold comps — $/sqft
last 12 mo · ≤1 miLoading sold comps…