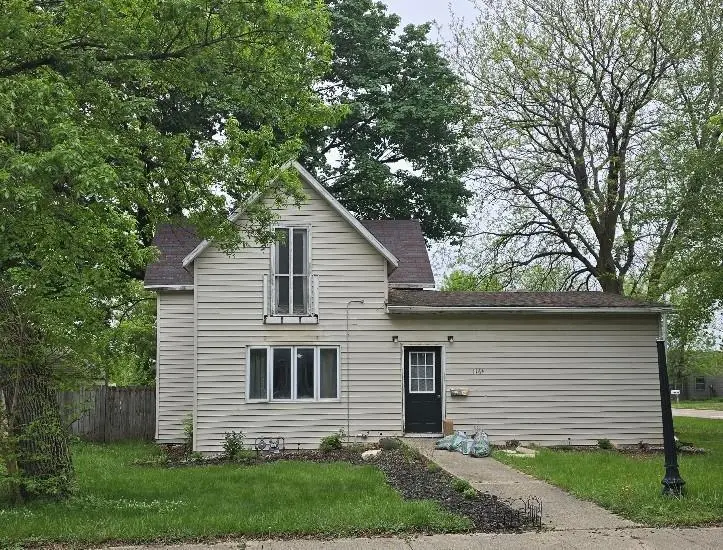
1164 Miller Ave · Windom, MN
Flood risk 1/10 · Minimal
- FEMA flood zone
- X (unshaded)
- Chance of flooding over 30 yrs
- 0.0%
- Est. flood insurance / yr
- $507 – $1,088
Fire risk 5/10 · Moderate
- Est. fire insurance / yr
- $888 – $1,650
Heat risk 2/10 · Minimal
- Hot days now (above 99°F)
- 7 days/yr
- Hot days in 30 yrs
- 15 days/yr
Wind risk 2/10 · Minimal
- Chance of severe wind over 30 yrs
- —
Air-quality risk 1/10 · Minimal
- Unhealthy air days now
- 0 days/yr
- Unhealthy air days in 30 yrs
- 0 days/yr
Risk factors via First Street. Map © Google.
Why this score? — see what drove the D grade
The composite is a weighted blend of 9 inputs, each scored 0–100. Each bar is that input's sub-score; the figure is the points it added to the 100-point composite (weight × sub-score).
- Cash flow +15.5/30.0
- ARV discount +7.5/15.0
- DSCR +4.8/10.0
- Schools +3.8/10.0
- Livability +3.8/5.0
- 1% rule +3.7/10.0
- Rent growth +2.5/5.0
- Condition / age +2.5/5.0
- Appreciation +0.0/10.0
$125,000
🖨 Deal sheet (PDF) 📄 Offer letter ✓ Due diligence
Listing remarks
This charming three-bedroom, two-bathroom home is nestled on a spacious corner lot defined by the beauty of its mature trees. Inside, the heart of the house features an expansive living and dining area anchored by a cozy natural gas fireplace, perfect for gathering. Convenience meets comfort with the primary bedroom and a full bathroom situated on the main floor. Perfectly positioned for those who love the local lifestyle, this home is just a short walk from the shopping and dining of the downtown area.
Key facts
- 0.23 acre lot
- Garage
- Built 1890
Property features AI
Finance
- Other: Lot size approximately 0.23 acres (approx. 70 x 145); Above-grade finished area listed as 1,400; total building area 1,932; below-grade area 532
Exterior
- Parking: Detached or attached garage not specified; 1-car garage with 20 x 17 dimensions
- Utilities: City water; City sewer; Natural gas fuel; Circuit breaker electrical service; Power provided by City of Windom
- Home design: Residential property; One and one-half levels; Facing direction not specified; Above-grade finished living area 1,400
- Construction: Frame construction; Asphalt roof; Block foundation (basement); Basement present
- Exterior features: City street frontage; Publicly maintained road
Interior
- Kitchen: Range; Refrigerator; Dishwasher; Microwave
- Bedrooms: 3 bedrooms (one on main level; two on upper level)
- Bathrooms: 2 full bathrooms (one on main level; one on upper level)
- Heating & cooling: Baseboard heating; Forced air heating; Window cooling units
- Interior features: Gas fireplace; Living/Dining room configuration
- Laundry & utility: Dryer
Neighborhood map
What this means for you Summary
Snapshot
- This is a 3-bed/2.0-bath single-family listed at $125k.
Deal economics
- At list price, monthly cash flow is $51 ($613/yr) — positive.
- The deal already cash-flows at list — no discount required.
- To meet the 1% rule (rent ≥ 1% of price), the offer needs to be $109k (13.0% below list).
- Recommended offer: $109k (13.0% below list) — sets the bar for 1% rule.
- Cap rate 6.8% vs local median 2.9% in Windom — top-decile yield for the area; either an underpriced asset or a hidden risk that comps aren't pricing in. Stress-test before assuming the spread holds.
Location & tenants
- Location reads 75/100 on livability (#191 in MN, #4,110 nationally) — a middle-class / working-renter tenant base. Strengths: cost of living A+, housing A+, health & safety A+; Watch: employment D, amenities F, commute F.
- Windom Public School District (town): math 42% / reading 47% proficiency, ranked #190 of 301 in MN (top 63%) — families likely to look elsewhere, expect single-tenant / working-renter base with shorter leases.
- Zoned schools: Windom Middle (math 36% / reading 46%, grade F, #143 of 258 statewide, top 55%, 267 students, 53% FRL); Windom Senior High (math 32% / reading 52%, grade F, #222 of 471 statewide, top 50%, 339 students, 41% FRL).
- Market conditions: 58 active listings in the ZIP; 29 units permitted in Cottonwood County in 2024 (15 in 5+ unit buildings).
Forward outlook
- Local home prices are declining (-3.0%/yr); year-one equity from $864 of loan paydown is wiped out by about $4k of value loss. Plan a longer hold.
- Cottonwood County population projected to shrink 9% by 2050 — rents likely to lag national; underwrite the cash flow, not the appreciation.
Negotiation context
- It's been on market 34 days — a 3% lower offer ($121k) is reasonable based on typical stale-listing flexibility.
- 2 sale attempts with the ask held roughly flat each time — persistent listings suggest the price (not the market) is what's stuck; bring a comps-based counter.
- Current owner paid $62k; list at $125k implies a 102% gain — meaningful room to come down on a strong offer.
Risks & watch-outs
- Watch-outs: built in 1890 — expect roof / HVAC / electrical / plumbing capex.
- Climate carrying-cost: moderate wildfire risk — expect insurance premiums to compound above CPI over the hold.
Questions for the listing agent
- It's been on market 34 days. Have you received any prior offers? Is the seller open to a 13% concession, seller financing, or rate buy-down credit?
- Built in 1890 — when were the roof, HVAC, electrical panel, plumbing, and water heater last replaced?
- Is there a deadline driving the sale (1031 exchange, divorce, estate, relocation)? That informs how much negotiation room exists.
- Schools are B-rated — typically a magnet for longer-tenancy family renters. What's the average tenant stay here, and is there a school-zone premium baked into asking?
- The area grade is low — what's the realistic commute time and amenity access for the typical tenant pool here? Any planned neighborhood developments (good or bad) we should know about?
- What's the average days-on-market for RENTAL listings here right now (not sales)? A rising rental-DOM trend means longer vacancies and softer asking-rent achievability than the comps imply.
- What's the recent tenant-quality profile in this submarket — average credit score on applications, eviction rate, late-payment / NSF rate, and stable-employment percentage? A property-management company in the area should have these aggregated.
- How much new for-sale + rental construction is in the pipeline within 1–3 miles? Heavy new supply typically softens prices + rents 12–24 months out; constrained supply supports both.
Investment metrics
- 1% rule
- 0.87% ✗
- Cap rate
- 6.78%
- Cash-on-cash
- 1.75%
- DSCR
- 1.08
- GRM
- 9.6
CMA / ARV
No comps found within radius.
Projected returns pro-forma
-3.0% appreciation · 3.0% rent growth · sell at horizon
- IRR
- -13.5%
- Equity multiple
- 0.51×
- Total profit
- $-17,020
- Equity at exit
- $18,638
- IRR
- -4.7%
- Equity multiple
- 0.69×
- Total profit
- $-10,705
- Equity at exit
- $10,808
Cash invested: $35,000 (down + closing). Projections, not guarantees.
Landlord ↔ Tenant lean methodology
- Overall (STATE)
- 46 Balanced
- State Minnesota
- 46 Balanced · D+2
- County
- — inherits STATE
- City
- — inherits STATE
ZIP-level market 56101
- Home prices YoY
- -4.0%
- Active inventory
- 58
- Price-to-rent
- 9.6×
Monthly cashflow live
- Estimated rent
- $1,087 medium interval (Pro) →
- Mortgage (P&I)
- −$656
- Tax from tax record
- −$100 /mo · $1,204/yr
- Insurance
- −$52
- HOA
- −$0
- Vacancy / Maint / Mgmt
- −$228
- Net cashflow
- $51
Break-even live
Sensitivity live
| Price | -10% $122 | -5% $86 | +0% $51 | +5% $16 | +10% $-20 |
|---|---|---|---|---|---|
| Rent | -10% $-35 | -5% $8 | +0% $51 | +5% $94 | +10% $137 |
| Rate | -1.0pp $114 | -0.5pp $83 | base $51 | +0.5pp $19 | +1.0pp $-14 |
UW: 25.0% down · 7.5% · 30yr · 1.5% tax · 5.0% vac · 8.0% maint · 8.0% mgmt
Financing live
Cash to close
- Down payment
- $31,250
- Closing costs
- $3,750
- Reserves months
- —
- Total cash needed
- —
Loan-product check · same deal, 3 products live
Conventional
25% down · 7.5% · 30yr
- Down + closing
- —
- Monthly P&I
- —
- Monthly cashflow
- —
- DSCR
- —
- Eligible?
- —
Personal DTI + credit; lowest rate.
DSCR
20% down · 8.5% · 30yr
- Down + closing
- —
- Monthly P&I
- —
- Monthly cashflow
- —
- DSCR
- —
- Eligible?
- —
No personal income docs; deal must DSCR.
Hard money
10% down · 12.0% · 12mo
- Down + closing
- —
- Monthly P&I
- —
- Monthly cashflow
- —
- DSCR
- —
- Eligible?
- —
Short-term bridge; refi at stabilization.
Listing history 21 events
-
2026-06-21days on market $125,000 Active 34 DOM
-
2026-06-21days on market $125,000 Active 33 DOM
-
2026-06-18days on market $125,000 Active 31 DOM
-
2026-06-17days on market $125,000 Active 30 DOM
-
2026-06-16days on market $125,000 Active 29 DOM
-
2026-06-15days on market $125,000 Active 28 DOM
-
2026-06-13days on market $125,000 Active 26 DOM
-
2026-06-12days on market $125,000 Active 25 DOM
-
2026-06-09days on market $125,000 Active 22 DOM
-
2026-06-08days on market $125,000 Active 21 DOM
-
2026-06-07days on market $125,000 Active 20 DOM
-
2026-06-05days on market $125,000 Active 18 DOM
-
2026-06-04days on market $125,000 Active 16 DOM
-
2026-06-02days on market $125,000 Active 15 DOM
-
2026-06-01days on market $125,000 Active 14 DOM
-
2026-05-31days on market $125,000 Active 13 DOM
-
2026-05-31days on market $125,000 Active 12 DOM
-
2026-05-18status Active
-
2026-05-06$125,000
-
2026-05-06historical
-
2009-02-26soldstatus $62,000
ⓘ Source: listings_history table (triggers on properties + properties_extension) + one-shot
backfill from property_details.listing_events for pre-trigger history.
Tax reassessment forecast MN · Partial reset (capped growth)
- Current annual tax
- $1,204 · $100/mo
- Projected year-2 tax
- $1,302 · $108/mo
- Expected delta
- +$98/yr (+$8/mo · 8.1%)
ⓘ Screening estimate from a state-policy table — verify with the county assessor before closing.
Climate risk First Street
- Flood 1/10 Low FEMA zone X (unshaded) · 0% chance over 30 yrs
- Wildfire 5/10 Major
- Heat 2/10 Low 7 d/yr ≥99°F today · 15 d/yr by 30 yrs out
- Wind 2/10 Low
- Air quality 1/10 Low 0 unhealthy d/yr today · 0 by 30 yrs out
Nearby sold comps map
Loading sold comps map…
Walkable amenities ~0.75 mi
Loading nearby amenities…
Taxation est. · year 1
- Rental income
- $13,048
- − Mortgage interest
- −$7,002
- − Property taxes
- −$1,204
- − Insurance
- −$625
- − Repairs & maintenance
- −$1,044
- − Management
- −$1,044
- − Depreciation
- −$3,636
- Taxable loss
- −$1,507
- Est. tax savings @ 24.0%
- +$362
- After-tax cash flow
- $975/yr
For passive investors: Depreciation is non-cash, so a rental often shows a tax loss while cash-flowing — sheltering income. Rental losses are passive: they offset passive income freely, and up to $25,000/yr can offset ordinary (W-2) income if you actively participate and your MAGI is under $100k (phasing out to $0 by $150k); unused losses carry forward. On sale, claimed depreciation is recaptured at up to 25%, and gains may owe capital-gains tax (a 1031 exchange can defer both). Figures are a year-1 estimate at your 24.0% rate — not tax advice; consult a CPA.
Schools (NCES district)
- District
- Windom Public School District
- NCES district ID
- 2742780
- Math proficiency
- 42% ▼ -12.00%
- Reading proficiency
- 47% ▼ -11.00%
- Median HH income
- $43,245
- Composite
- 37.56/100
- National rank
- #4389
- State rank
- #190 of 301 in MN
Livability — Windom
- Score
- 75/100
- State rank
- #191
- US rank
- #4110
Category grades
Schools grade is shown separately in the Schools card above.
Census & demographics
- Census place
- Windom, MN
- City population
- 6,081
- Population (ZIP)
- 6,081
Population outlook (Cottonwood County) Hauer SSP2
- Today (2025)
- 11,130 people
- By 2030
- 10,916 · -1.9%
- By 2040
- 10,467 · -6.0%
- By 2050
- 10,136 · -8.9%
- By 2075
- 10,080 · -9.4%
- By 2100
- 10,091 · -9.3%
Race, ethnicity, and origin ACS 2023
- Neighborhood character
- Predominantly White (81%)
- Race & ethnicity
- White 81% Hispanic / Latino 12% Two or more races 5% Black 3% Pacific Islander 2% Asian 1%
- Hispanic origin (detail)
- Mexican 8% Puerto Rican 1%
- Common ancestry
- Portuguese 14% Iranian 1% Slovak 1%
- Foreign-born
- 6% · Canada, Vietnam
- Languages at home
- 90% English-only · Spanish 7% Other Asian/Pacific 1% Vietnamese 1%
Political lean MEDSL · Cottonwood
- 2024 margin
- Solid R (+41.1) · D 28.6% · R 69.7% · Other 1.7%
- 2008→2024 swing
- -34.5pp toward R · 2008: -6.6pp · 2024: -41.1pp
- All cycles
- 2024: R+41.1 2020: R+38.2 2016: R+35.1 2012: R+15.1 2008: R+6.6
Not yet ingested
- Civics
- —
Market trends
- HPI YoY
- ▼ -12.88%
- Current HPI
- 312.6086
- Rent YoY
- —
- Metro
- —
- State GDP YoY
- ▲ 2.41%
- F500 in state
- 34
Industry mix (Fortune 500 HQ in MN)
| Industry | F500 HQs | Revenue |
|---|---|---|
| Healthcare | 2 | $407B |
|
||
| Retail | 2 | $150B |
|
||
| Consumer Goods | 2 | $32B |
|
||
| Industrial Machinery | 2 | $6B |
|
||
| Agriculture | 1 | $40B |
|
||
| Healthcare / Medical Devices | 1 | $32B |
|
||
Price history
+101.6% since first listed4 events — show timeline
- 2026-05-18 Relisted — NORTHSTARMLS as Distributed by MLS Grid
- 2026-05-06 Listing Removed — NORTHSTARMLS as Distributed by MLS Grid
- 2026-05-06 Listed $125,000 NORTHSTARMLS as Distributed by MLS Grid
- 2009-02-26 Sold (Public Records) $62,000 Public Records
Property tax history
+6.7%/yrLatest (2025): $1,204 · +7.3% YoY. Source: county tax records.
Cash-flow waterfall
monthlySold comps — $/sqft
last 12 mo · ≤1 miLoading sold comps…