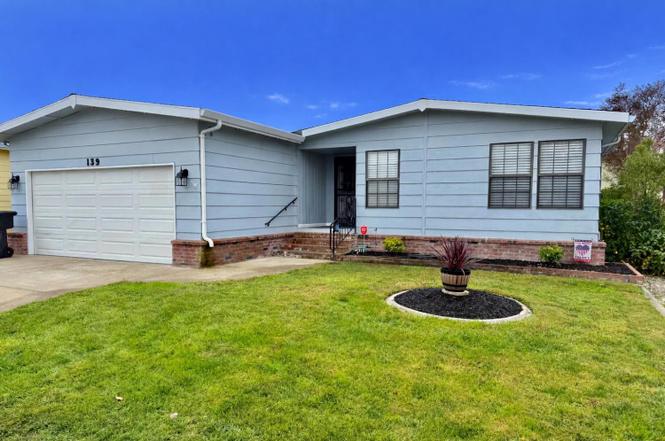
139 Kaseberg · Roseville, CA
Flood risk 1/10 · Minimal
- FEMA flood zone
- X (unshaded)
- Chance of flooding over 30 yrs
- 0.0%
- Est. flood insurance / yr
- $507 – $1,088
Fire risk 5/10 · Moderate
- Est. fire insurance / yr
- $659 – $1,223
Heat risk 7/10 · Major
- Hot days now (above 104°F)
- 7 days/yr
- Hot days in 30 yrs
- 16 days/yr
Wind risk 1/10 · Minimal
- Chance of severe wind over 30 yrs
- —
Air-quality risk 10/10 · Severe
- Unhealthy air days now
- 33 days/yr
- Unhealthy air days in 30 yrs
- 37 days/yr
Risk factors via First Street. Map © Google.
Why this score? — see what drove the B+ grade
The composite is a weighted blend of 9 inputs, each scored 0–100. Each bar is that input's sub-score; the figure is the points it added to the 100-point composite (weight × sub-score).
- Cash flow +30.0/30.0
- ARV discount +13.6/15.0
- DSCR +10.0/10.0
- 1% rule +9.7/10.0
- Schools +5.1/10.0
- Livability +3.9/5.0
- Rent growth +2.9/5.0
- Condition / age +2.5/5.0
- Appreciation +0.0/10.0
$179,000
🖨 Deal sheet 📄 Offer letter ✓ Due diligence
Listing remarks
Welcome Home to Easy Living in One of Roseville's Most Desirable 55+ Communities. Step into a beautifully updated 2008 square foot home where comfort meets style. From the moment you enter, you'll be greeted by an open modern feel, thanks to a thoughtful remodel featuring brand-new granite countertops, new stainless steel appliances including a rare built-in microwave oven, stylish new trim, and crisp interior and exterior paint. The open floor plan offers spacious, light-filled living areas that are perfect for both relaxing and entertaining. Enjoy the ease of a low-maintenance yard, so you can spend more time living and less time on upkeep. Inside, both bathrooms have been updated adding
Key facts
- Updated large home
- Low-maintenance yard
- Updated bathrooms
Tags
Property features AI
Finance
- Other: Land lease: No (listed land lease amount present)
- HOA & community: No homeowners association; Senior community
Exterior
- Parking: Attached parking
- Utilities: Public water; Public sewer; 220 volts available in laundry
- Home design: Manufactured in park (triple wide); Robert Homes make; Built in 1982
- Construction: Composition roof; Wood skirting
- Exterior features: Landscaped front and back
Interior
- Kitchen: Slab and stone counters; Free standing gas range; Free standing refrigerator; Hood over range; Ice maker; Dishwasher; Disposal; Microwave
- Bedrooms: 2 bedrooms
- Flooring: Simulated wood; Laminate; Wood
- Bathrooms: 2 full bathrooms; Shower stall(s)
- Heating & cooling: Central heating; Fireplace heating; Central air conditioning; Ceiling fan(s)
- Interior features: Cathedral/vaulted living room with skylight(s); Covered, enclosed and railed patio; Fireplace in living room with raised hearth and gas piped; Pets allowed
- Laundry & utility: Laundry room inside; 220V outlet in laundry
Neighborhood map
What this means for you Summary
Snapshot
- This is a 2-bed/2.0-bath manufactured listed at $179k.
Deal economics
- At list price, monthly cash flow is $838 ($10k/yr) — positive.
- The deal already cash-flows at list — no discount required.
- Meets the 1% rule at list price ($3k rent vs $179k).
- Recommended offer: $158k (12.0% below list) — sets the bar for market timing.
- Cap rate 11.9% vs local median 2.8% in Roseville — top-decile yield for the area; either an underpriced asset or a hidden risk that comps aren't pricing in. Stress-test before assuming the spread holds.
Location & tenants
- Location reads 77/100 on livability (#90 in CA, #3,239 nationally) — a middle-class / working-renter tenant base. Strengths: commute A+, employment A+, housing A+; Watch: cost of living F.
- Roseville Joint Union High (urban): math 42% / reading 71% proficiency, ranked #86 of 517 in CA (top 17%) — acceptable for families but not a draw, mixed tenant base, ~2y average lease.
- Market conditions: Rents rising (+1.8%/yr); 167 active listings in the ZIP; 7 comparable units currently listed for rent nearby; rentals leasing fast (median 2d on market — plan ~1-2 weeks tenant-placement turnaround); solid renter incomes; 3,535 units permitted in Placer County in 2024 (689 in 5+ unit buildings).
- This rent runs 31% of the median local income ($101k/yr) — at the standard rent-burdened threshold; future hikes will face affordability resistance.
Forward outlook
- Local home prices are declining (-3.0%/yr); year-one equity from $1k of loan paydown is wiped out by about $5k of value loss. Plan a longer hold.
- Placer County population projected at +20% by 2050 — long-run rental-demand tailwind backs the buy-and-hold thesis.
- At projected returns (-3.0% appreciation + 1.8% rent growth), your $50k cash investment doubles in ~7 years — after that, you're playing with house money.
Negotiation context
- It's been on market 190 days — a 12% lower offer ($158k) is reasonable based on typical stale-listing flexibility.
Risks & watch-outs
- Climate carrying-cost: moderate wildfire risk; extreme-heat days projected 7→16/yr by 2055 (HVAC capex compounding) — expect insurance premiums to compound above CPI over the hold.
Questions for the listing agent
- It's been on market 190 days. Have you received any prior offers? Is the seller open to a 12% concession, seller financing, or rate buy-down credit?
- Why hasn't it sold? Are there any deal-killer items the seller is aware of (foundation, flood, title, zoning, code violations)?
- Is there a deadline driving the sale (1031 exchange, divorce, estate, relocation)? That informs how much negotiation room exists.
- Schools are B-rated — typically a magnet for longer-tenancy family renters. What's the average tenant stay here, and is there a school-zone premium baked into asking?
- What's the average days-on-market for RENTAL listings here right now (not sales)? A rising rental-DOM trend means longer vacancies and softer asking-rent achievability than the comps imply.
- What's the recent tenant-quality profile in this submarket — average credit score on applications, eviction rate, late-payment / NSF rate, and stable-employment percentage? A property-management company in the area should have these aggregated.
- How much new for-sale + rental construction is in the pipeline within 1–3 miles? Heavy new supply typically softens prices + rents 12–24 months out; constrained supply supports both.
Investment metrics
- 1% rule
- 1.47% ✓
- Cap rate
- 11.91%
- Cash-on-cash
- 20.06%
- DSCR
- 1.89
- GRM
- 5.7
CMA / ARV
- ARV (on-the-fly)
- $206,824
- Comps found
- 7
Show comp detail 7 sales within ~0.75 mi
| Address | Dist | Beds/Ba | Sqft | Sold | Price | $/sf | Match |
|---|---|---|---|---|---|---|---|
| 116 Kaseberg Dr | 0.07mi | 2/2.0 | 2,160 (+8%) | 1mo | $175,000 | $81 | 83 |
| 27 Hancock Dr | 0.12mi | 2/2.0 | 1,790 (-11%) | 0mo | $189,000 | $106 | 76 |
| 140 Kaseberg Dr | 0.01mi | 2/2.0 | 2,108 (+5%) | 21mo | $235,000 | $111 | 74 |
| 144 Kaseberg Dr | 0.06mi | 2/2.0 | 1,788 (-11%) | 8mo | $153,000 | $86 | 72 |
| 255 Kirkwood Dr | 0.12mi | 3/2.5 (+1) | 1,760 (-12%) | 2mo | $134,500 | $76 | 65 |
| 128 Kaseberg Dr | 0.07mi | 3/2.5 (+1) | 1,840 (-8%) | 17mo | $215,500 | $117 | 62 |
| 290 Lafayette | 0.23mi | 2/2.0 | 1,708 (-15%) | 5mo | $175,900 | $103 | 60 |
Match score weights: distance 35% · size 25% · config 20% · recency 20%. Top-matched comps best support the ARV.
Projected returns pro-forma
-3.0% appreciation · 1.75% rent growth · sell at horizon
- IRR
- 10.8%
- Equity multiple
- 1.42×
- Total profit
- $21,126
- Equity at exit
- $26,689
- IRR
- 18.8%
- Equity multiple
- 2.48×
- Total profit
- $74,206
- Equity at exit
- $15,477
Cash invested: $50,120 (down + closing). Projections, not guarantees.
Landlord ↔ Tenant lean methodology
- Overall (STATE)
- 18 Strongly Tenant-Friendly
- State California
- 18 Strongly Tenant-Friendly · D+13
- County
- — inherits STATE
- City
- — inherits STATE
ZIP-level market 95678
- Rents YoY
- 1.8%
- Active inventory
- 167
- Price-to-rent
- 5.7×
Monthly cashflow live
- Estimated rent
- $2,626 high interval (Pro) →
- Mortgage (P&I)
- −$939
- Tax est. 1.5%
- −$224 /mo · $2,685/yr
- Insurance
- −$75
- HOA
- −$0
- Vacancy / Maint / Mgmt
- −$552
- Net cashflow
- $838
Break-even live
UW: 25.0% down · 7.5% · 30yr · 1.5% tax · 5.0% vac · 8.0% maint · 8.0% mgmt
Financing live
Cash to close
- Down payment
- $44,750
- Closing costs
- $5,370
- Reserves months
- —
- Total cash needed
- —
Loan-product check · same deal, 3 products live
Conventional
25% down · 7.5% · 30yr
- Down + closing
- —
- Monthly P&I
- —
- Monthly cashflow
- —
- DSCR
- —
- Eligible?
- —
Personal DTI + credit; lowest rate.
DSCR
20% down · 8.5% · 30yr
- Down + closing
- —
- Monthly P&I
- —
- Monthly cashflow
- —
- DSCR
- —
- Eligible?
- —
No personal income docs; deal must DSCR.
Hard money
10% down · 12.0% · 12mo
- Down + closing
- —
- Monthly P&I
- —
- Monthly cashflow
- —
- DSCR
- —
- Eligible?
- —
Short-term bridge; refi at stabilization.
Rent comps 7 comps
| Address | Beds | Baths | Sqft | Rent | $/sqft | DOM | Units | Dist |
|---|---|---|---|---|---|---|---|---|
| 1243 S Bluff Dr Roseville, CA | 3.0 | 2.0 | 1433 | $2,795 | $1.95 | 21d | 1 | 0.43mi |
| 1317 Rice Ln Roseville, CA | 3.0 | 2.0 | 1442 | $2,395 | $1.66 | 1d | 1 | 0.49mi |
| 317 Aspen Ct Roseville, CA | 3.0 | 2.0 | 1744 | $3,200 | $1.83 | 1d | 1 | 0.59mi |
| 304 Diamond Oaks Rd Roseville, CA | 3.0 | 2.0 | 2116 | $3,200 | $1.51 | 10d | 1 | 0.72mi |
| 409 Washington Blvd Roseville, CA | 3.0 | 2.0 | 2000 | $1,995 | $1.00 | 1d | 1 | 1.13mi |
| 1057 Shenencock Way Roseville, CA | 3.0 | 2.0 | 1406 | $2,795 | $1.99 | 1d | 1 | 1.37mi |
| 120 Ivy St Roseville, CA | 3.0 | 2.5 | 1525 | $2,595 | $1.70 | 1d | 1 | 1.39mi |
Listing history 15 events
-
2026-06-18days on market $179,000 Active 190 DOM
-
2026-06-17days on market $179,000 Active 189 DOM
-
2026-06-16days on market $179,000 Active 188 DOM
-
2026-06-15days on market $179,000 Active 187 DOM
-
2026-06-13days on market $179,000 Active 185 DOM
-
2026-06-13days on market $179,000 Active 184 DOM
-
2026-06-09days on market $179,000 Active 181 DOM
-
2026-06-08days on market $179,000 Active 180 DOM
-
2026-06-07days on market $179,000 Active 179 DOM
-
2026-06-05days on market $179,000 Active 176 DOM
-
2026-06-03days on market $179,000 Active 175 DOM
-
2026-06-02days on market $179,000 Active 174 DOM
-
2026-06-02price $179,000 Active 173 DOM
-
2026-06-01days on market $189,000 Active 173 DOM
-
2026-05-31days on market $189,000 Active 172 DOM
ⓘ Source: listings_history table (triggers on properties + properties_extension) + one-shot
backfill from property_details.listing_events for pre-trigger history.
Climate risk First Street
- Flood 1/10 Low FEMA zone X (unshaded) · 0% chance over 30 yrs
- Wildfire 5/10 Major
- Heat 7/10 Severe 7 d/yr ≥104°F today · 16 d/yr by 30 yrs out
- Wind 1/10 Low
- Air quality 10/10 Extreme 33 unhealthy d/yr today · 37 by 30 yrs out
Nearby sold comps map
Loading sold comps map…
Walkable amenities ~0.75 mi
Loading nearby amenities…
Taxation est. · year 1
- Rental income
- $31,515
- − Mortgage interest
- −$10,027
- − Property taxes
- −$2,685
- − Insurance
- −$895
- − Repairs & maintenance
- −$2,521
- − Management
- −$2,521
- − Depreciation
- −$5,207
- Taxable income
- $7,659
- Est. tax owed @ 24.0%
- −$1,838
- After-tax cash flow
- $8,215/yr
For passive investors: Depreciation is non-cash, so a rental often shows a tax loss while cash-flowing — sheltering income. Rental losses are passive: they offset passive income freely, and up to $25,000/yr can offset ordinary (W-2) income if you actively participate and your MAGI is under $100k (phasing out to $0 by $150k); unused losses carry forward. On sale, claimed depreciation is recaptured at up to 25%, and gains may owe capital-gains tax (a 1031 exchange can defer both). Figures are a year-1 estimate at your 24.0% rate — not tax advice; consult a CPA.
Schools (NCES district)
- District
- Roseville Joint Union High
- NCES district ID
- 0633630
- Math proficiency
- 42% ▼ -6.00%
- Reading proficiency
- 71% ▼ -3.00%
- Median HH income
- $81,930
- Composite
- 51.11/100
- National rank
- #1763
- State rank
- #86 of 517 in CA
Livability — Roseville
- Score
- 77/100
- State rank
- #90
- US rank
- #3239
Category grades
Schools grade is shown separately in the Schools card above.
Census & demographics
- Census place
- Roseville, CA
- County
- Placer County · 390,510 people
- City population
- 161,837
- Metro
- Sacramento-Roseville-Folsom, CA
- Population (ZIP)
- 45,346
- Household income
- $100,554
- Rent vs Own
- Severe rent burden
- 2544.0
Population outlook (Placer County) Hauer SSP2
- Today (2025)
- 422,709 people
- By 2030
- 444,249 · +5.1%
- By 2040
- 480,192 · +13.6%
- By 2050
- 506,390 · +19.8%
- By 2075
- 550,219 · +30.2%
- By 2100
- 547,760 · +29.6%
Race, ethnicity, and origin ACS 2023
- Neighborhood character
- Diverse neighborhood (Simpson 0.58)
- Race & ethnicity
- White 60% Hispanic / Latino 23% Two or more races 17% Asian 8% Black 2%
- Hispanic origin (detail)
- Mexican 16% Puerto Rican 1%
- Common ancestry
- Russian 3% Slovak 2% Italian 2%
- Foreign-born
- 14% · Canada, China, South Korea
- Languages at home
- 79% English-only · Spanish 10% Other Indo-European 4% Russian/Polish/Slavic 2%
Political lean MEDSL · Placer
- 2024 margin
- Lean R (+8.5) · D 44.3% · R 52.8% · Other 2.9%
- 2008→2024 swing
- +2.8pp toward D · 2008: -11.3pp · 2024: -8.5pp
- All cycles
- 2024: R+8.5 2020: R+6.7 2016: R+11.3 2012: R+20.1 2008: R+11.3
Not yet ingested
- Civics
- —
Market trends
- HPI YoY
- ▼ -418.46%
- Current HPI
- 272.0182
- Rent YoY
- ▲ 1.75%
- Metro
- Sacramento-Roseville-Folsom, CA
- State GDP YoY
- ▲ 3.21%
- F500 in state
- 116
Industry mix (Fortune 500 HQ in CA)
| Industry | F500 HQs | Revenue |
|---|---|---|
| Technology | 27 | $1,492B |
|
||
| Financial Services | 3 | $174B |
|
||
| Retail | 3 | $44B |
|
||
| Insurance | 3 | $26B |
|
||
| Media / Entertainment | 2 | $115B |
|
||
| Pharmaceuticals / Biotech | 2 | $62B |
|
||
Cash-flow waterfall
monthlySold comps — $/sqft
last 12 mo · ≤1 miLoading sold comps…