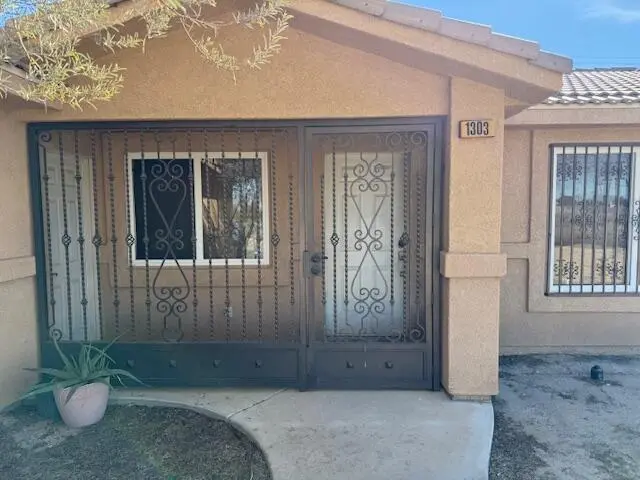
1303 Bering Blvd · Salton City, CA
Flood risk 1/10 · Minimal
- FEMA flood zone
- X (unshaded)
- Chance of flooding over 30 yrs
- 0.0%
- Est. flood insurance / yr
- $507 – $1,088
Fire risk 1/10 · Minimal
- Est. fire insurance / yr
- $659 – $1,223
Heat risk 10/10 · Severe
- Hot days now (above 114°F)
- 6 days/yr
- Hot days in 30 yrs
- 16 days/yr
Wind risk 1/10 · Minimal
- Chance of severe wind over 30 yrs
- —
Air-quality risk 2/10 · Minimal
- Unhealthy air days now
- 2 days/yr
- Unhealthy air days in 30 yrs
- 2 days/yr
Risk factors via First Street. Map © Google.
Why this score? — see what drove the D grade
The composite is a weighted blend of 9 inputs, each scored 0–100. Each bar is that input's sub-score; the figure is the points it added to the 100-point composite (weight × sub-score).
- Cash flow +11.2/30.0
- Appreciation +10.0/10.0
- ARV discount +4.9/15.0
- DSCR +3.3/10.0
- Rent growth +2.5/5.0
- Condition / age +2.5/5.0
- Livability +2.3/5.0
- 1% rule +2.0/10.0
- Schools +1.5/10.0
$300,000
🖨 Deal sheet (PDF) 📄 Offer letter ✓ Due diligence
Listing remarks MLS
Very nicely kept 3 bedroom, 2 bath home on a large 10600 square foot lot that back yard is fenced. Kitchen is updated. All entrances have wrought iron security bars. Wrought iron on bedrooms windows have easily accessible emergency quick-release mechanism to serve as a safe emergency exit. This property has a large back yard with access to the alley. Laundry area inside of home, central air conditioning, ceiling fans, and tile roof. No HOA. Red Earth Casino and Travel Center is minutes away.
Key facts
- Laundry area inside
- Access to the alley
- Large back yard
Tags
Neighborhood map
What this means for you Summary
Snapshot
- This is a 3-bed/2.0-bath single-family listed at $300k.
Deal economics
- At list price, monthly cash flow is $-117 ($-1k/yr) — negative.
- To cash-flow at today's rent, offer at most $279k (6.9% below list).
- To meet the 1% rule (rent ≥ 1% of price), the offer needs to be $211k (29.7% below list).
- Recommended offer: $211k (29.7% below list) — sets the bar for 1% rule.
- Cap rate 5.8% vs local median 4.4% in Salton City — top-decile yield for the area; either an underpriced asset or a hidden risk that comps aren't pricing in. Stress-test before assuming the spread holds.
Location & tenants
- Location reads 46/100 on livability (#1,265 in CA) — a working-class tenant base; expect higher turnover. Strengths: housing A-; Watch: crime F, amenities F, commute F.
- Coachella Valley Unified (rural): math 12% / reading 23% proficiency, ranked #481 of 517 in CA (top 93%) — low school quality limits family demand, transient renter base, plan for 1-2y turnover; 79% free/reduced lunch — lower-income household profile, screen leases tightly.
- Zoned schools: Sea View Elementary (math 7% / reading 12%, grade F, #1,539 of 1,571 statewide, top 98%, 652 students, 93% FRL); West Shores High (math 8% / reading 22%, grade F, #1,036 of 1,170 statewide, top 90%, 520 students, 91% FRL).
- Market conditions: 496 active listings in the ZIP; 271 units permitted in Imperial County in 2024 (112 in 5+ unit buildings).
Forward outlook
- In year one you build about $32k of equity ($2k loan paydown + $30k appreciation (10.0% local appreciation)).
- Imperial County population projected at +7% by 2050 — modest demand growth; plan on rents tracking national, not racing it.
- By year 2, paydown + projected appreciation supports a ~$52k cash-out refi (75% LTV) — recoverable capital for the next deal without selling this one.
Negotiation context
- It's been on market 150 days — a 12% lower offer ($264k) is reasonable based on typical stale-listing flexibility.
- 2 sale attempts since 13y ago with the ask held roughly flat each time — persistent listings suggest the price (not the market) is what's stuck; bring a comps-based counter.
- Current owner paid $60k; list at $300k implies a 400% gain — meaningful room to come down on a strong offer.
Risks & watch-outs
- Climate carrying-cost: extreme-heat days projected 6→16/yr by 2055 (HVAC capex compounding) — expect insurance premiums to compound above CPI over the hold.
Questions for the listing agent
- What do current leases actually rent for vs. the listed asking? Can we see a recent rent roll and the last 12 months of T-12 income?
- It's been on market 150 days. Have you received any prior offers? Is the seller open to a 30% concession, seller financing, or rate buy-down credit?
- Why hasn't it sold? Are there any deal-killer items the seller is aware of (foundation, flood, title, zoning, code violations)?
- Is there a deadline driving the sale (1031 exchange, divorce, estate, relocation)? That informs how much negotiation room exists.
- Schools are F-rated, which usually means shorter tenancies and higher turnover. Who's the typical renter profile here, and what's been the actual vacancy rate?
- Crime grade is F in this area — have there been break-ins, vandalism, or insurance claims at this property in the last 3 years? What carrier currently insures it and at what premium?
- The area grade is low — what's the realistic commute time and amenity access for the typical tenant pool here? Any planned neighborhood developments (good or bad) we should know about?
- What's the average days-on-market for RENTAL listings here right now (not sales)? A rising rental-DOM trend means longer vacancies and softer asking-rent achievability than the comps imply.
- What's the recent tenant-quality profile in this submarket — average credit score on applications, eviction rate, late-payment / NSF rate, and stable-employment percentage? A property-management company in the area should have these aggregated.
- How much new for-sale + rental construction is in the pipeline within 1–3 miles? Heavy new supply typically softens prices + rents 12–24 months out; constrained supply supports both.
Investment metrics
- 1% rule
- 0.70% ✗
- Cap rate
- 5.82%
- Cash-on-cash
- -1.68%
- DSCR
- 0.93
- GRM
- 11.9
CMA / ARV
- ARV (median comp)
- $283,850
- List price
- $300,000
- Delta
- 5.69%
- Verdict
- FAIR
- Comps
- 20 within 1.0 mi
Show comp detail 12 sales within ~0.75 mi
| Address | Dist | Beds/Ba | Sqft | Sold | Price | $/sf | Match |
|---|---|---|---|---|---|---|---|
| 2867 Stardust Ave | 0.15mi | 4/2.0 (+1) | 1,259 (-1%) | 1mo | $320,000 | $254 | 86 |
| 2869 Stardust Ave | 0.13mi | 4/2.0 (+1) | 1,331 (+5%) | 3mo | $299,999 | $225 | 78 |
| 2881 Argus Ave | 0.12mi | 2/2.0 (-1) | 1,200 (-5%) | 6mo | $227,000 | $189 | 75 |
| 2839 Bach Ave | 0.53mi | 3/2.0 | 1,269 (0%) | 2mo | $300,000 | $236 | 74 |
| 1293 China Sea Ave | 0.09mi | 3/2.0 | 1,144 (-10%) | 8mo | $290,000 | $253 | 73 |
| 1267 Black Sea Ave | 0.30mi | 4/2.0 (+1) | 1,250 (-2%) | 10mo | $290,000 | $232 | 71 |
| 1240 Indian Ocean Ave | 0.33mi | 3/2.0 | 1,437 (+13%) | 2mo | $175,500 | $122 | 61 |
| 1239 Corvina Ave | 0.37mi | 3/2.0 | 1,144 (-10%) | 12mo | $279,000 | $244 | 56 |
| 1348 Persimmon | 0.59mi | 3/2.0 | 1,150 (-9%) | 7mo | $275,000 | $239 | 51 |
| 3004 Camino Dr | 0.72mi | 2/2.0 (-1) | 1,176 (-7%) | 6mo | $350,000 | $298 | 44 |
| 1229 Roselle Ave | 0.69mi | 3/2.0 | 1,430 (+13%) | 12mo | $308,000 | $215 | 37 |
| 1231 Roselle Ave | 0.68mi | 4/2.0 (+1) | 1,436 (+13%) | 12mo | $335,000 | $233 | 31 |
Match score weights: distance 35% · size 25% · config 20% · recency 20%. Top-matched comps best support the ARV.
Projected returns pro-forma
10.0% appreciation · 3.0% rent growth · sell at horizon
- IRR
- 23.1%
- Equity multiple
- 2.85×
- Total profit
- $155,764
- Equity at exit
- $270,264
- IRR
- 20.6%
- Equity multiple
- 6.53×
- Total profit
- $464,287
- Equity at exit
- $582,834
Cash invested: $84,000 (down + closing). Projections, not guarantees.
Landlord ↔ Tenant lean methodology
- Overall (STATE)
- 18 Strongly Tenant-Friendly
- State California
- 18 Strongly Tenant-Friendly · D+13
- County
- — inherits STATE
- City
- — inherits STATE
ZIP-level market 92274
- Home prices YoY
- 31.9%
- Active inventory
- 496
- Price-to-rent
- 11.9×
Monthly cashflow live
- Estimated rent
- $2,108 medium interval (Pro) →
- Mortgage (P&I)
- −$1,573
- Tax from tax record
- −$84 /mo · $1,012/yr
- Insurance
- −$125
- HOA
- −$0
- Vacancy / Maint / Mgmt
- −$443
- Net cashflow
- $-117
Break-even live
Sensitivity live
| Price | -10% $52 | -5% $-32 | +0% $-117 | +5% $-202 | +10% $-287 |
|---|---|---|---|---|---|
| Rent | -10% $-284 | -5% $-201 | +0% $-117 | +5% $-34 | +10% $49 |
| Rate | -1.0pp $34 | -0.5pp $-41 | base $-117 | +0.5pp $-195 | +1.0pp $-274 |
UW: 25.0% down · 7.5% · 30yr · 1.5% tax · 5.0% vac · 8.0% maint · 8.0% mgmt
Financing live
Cash to close
- Down payment
- $75,000
- Closing costs
- $9,000
- Reserves months
- —
- Total cash needed
- —
Loan-product check · same deal, 3 products live
Conventional
25% down · 7.5% · 30yr
- Down + closing
- —
- Monthly P&I
- —
- Monthly cashflow
- —
- DSCR
- —
- Eligible?
- —
Personal DTI + credit; lowest rate.
DSCR
20% down · 8.5% · 30yr
- Down + closing
- —
- Monthly P&I
- —
- Monthly cashflow
- —
- DSCR
- —
- Eligible?
- —
No personal income docs; deal must DSCR.
Hard money
10% down · 12.0% · 12mo
- Down + closing
- —
- Monthly P&I
- —
- Monthly cashflow
- —
- DSCR
- —
- Eligible?
- —
Short-term bridge; refi at stabilization.
Listing history 19 events
-
2026-06-21days on market $300,000 Active 150 DOM
-
2026-06-18days on market $300,000 Active 147 DOM
-
2026-06-17days on market $300,000 Active 146 DOM
-
2026-06-16days on market $300,000 Active 145 DOM
-
2026-06-15days on market $300,000 Active 144 DOM
-
2026-06-13days on market $300,000 Active 142 DOM
-
2026-06-13pricedays on market $300,000 Active 141 DOM
-
2026-06-09days on market $315,000 Active 138 DOM
-
2026-06-08days on market $315,000 Active 137 DOM
-
2026-06-07days on market $315,000 Active 136 DOM
-
2026-06-04days on market $315,000 Active 133 DOM
-
2026-06-03days on market $315,000 Active 132 DOM
-
2026-06-02days on market $315,000 Active 131 DOM
-
2026-06-01days on market $315,000 Active 130 DOM
-
2026-05-31days on market $315,000 Active 129 DOM
-
2026-01-20$315,000 Active 496-char remark
Show marketing remark (496 chars)
Very nicely kept 3 bedroom, 2 bath home on a large 10600 square foot lot that back yard is fenced. Kitchen is updated. All entrances have wrought iron security bars. Wrought iron on bedrooms windows have easily accessible emergency quick-release mechanism to serve as a safe emergency exit. This property has a large back yard with access to the alley. Laundry area inside of home, central air conditioning, ceiling fans, and tile roof. No HOA. Red Earth Casino and Travel Center is minutes away.
-
2013-08-13soldstatus $60,000 60-char remark
Show marketing remark (60 chars)
3 bedroom 2 bath home lots of tile flooring freshly painted.
-
2013-04-22$59,900 60-char remark
Show marketing remark (60 chars)
3 bedroom 2 bath home lots of tile flooring freshly painted.
-
2005-07-06soldstatus $112,500
ⓘ Source: listings_history table (triggers on properties + properties_extension) + one-shot
backfill from property_details.listing_events for pre-trigger history.
Tax reassessment forecast CA · Resets to sale price
- Current annual tax
- $1,012 · $84/mo
- Projected year-2 tax
- $2,280 · $190/mo
- Expected delta
- +$1,268/yr (+$106/mo · 125.3%)
ⓘ Screening estimate from a state-policy table — verify with the county assessor before closing.
Climate risk First Street
- Flood 1/10 Low FEMA zone X (unshaded) · 0% chance over 30 yrs
- Wildfire 1/10 Low
- Heat 10/10 Extreme 6 d/yr ≥114°F today · 16 d/yr by 30 yrs out
- Wind 1/10 Low
- Air quality 2/10 Low 2 unhealthy d/yr today · 2 by 30 yrs out
Nearby sold comps map
Loading sold comps map…
Walkable amenities ~0.75 mi
Loading nearby amenities…
Taxation est. · year 1
- Rental income
- $25,294
- − Mortgage interest
- −$16,805
- − Property taxes
- −$1,012
- − Insurance
- −$1,500
- − Repairs & maintenance
- −$2,023
- − Management
- −$2,023
- − Depreciation
- −$8,727
- Taxable loss
- −$6,797
- Est. tax savings @ 24.0%
- +$1,631
- After-tax cash flow
- $223/yr
For passive investors: Depreciation is non-cash, so a rental often shows a tax loss while cash-flowing — sheltering income. Rental losses are passive: they offset passive income freely, and up to $25,000/yr can offset ordinary (W-2) income if you actively participate and your MAGI is under $100k (phasing out to $0 by $150k); unused losses carry forward. On sale, claimed depreciation is recaptured at up to 25%, and gains may owe capital-gains tax (a 1031 exchange can defer both). Figures are a year-1 estimate at your 24.0% rate — not tax advice; consult a CPA.
Schools (NCES district)
- District
- Coachella Valley Unified
- NCES district ID
- 0609070
- Math proficiency
- 12% ▼ -8.00%
- Reading proficiency
- 23% ▼ -6.00%
- Median HH income
- $37,683
- Composite
- 14.62/100
- National rank
- #9408
- State rank
- #481 of 517 in CA
Livability — Salton City
- Score
- 46/100
- State rank
- #1265
- US rank
- #26406
Category grades
Schools grade is shown separately in the Schools card above.
Census & demographics
- Census place
- Salton City, CA
- Population (ZIP)
- 17,909
Population outlook (Imperial County) Hauer SSP2
- Today (2025)
- 186,713 people
- By 2030
- 190,022 · +1.8%
- By 2040
- 195,993 · +5.0%
- By 2050
- 199,534 · +6.9%
- By 2075
- 216,878 · +16.2%
- By 2100
- 352,705 · +88.9%
Race, ethnicity, and origin ACS 2023
- Neighborhood character
- Predominantly Hispanic (88%)
- Race & ethnicity
- Hispanic / Latino 88% Two or more races 49% White 10%
- Hispanic origin (detail)
- Mexican 87%
- Common ancestry
- Italian 1% Portuguese 1%
- Foreign-born
- 42% · Canada
- Languages at home
- 24% English-only · Spanish 76%
Political lean MEDSL · Imperial
- 2024 margin
- Toss-up / Even · D 48.3% · R 49.1% · Other 2.6%
- 2008→2024 swing
- -27.0pp toward R · 2008: 26.2pp · 2024: -0.9pp
- All cycles
- 2024: R+0.9 2020: D+24.4 2016: D+41.1 2012: D+28.8 2008: D+26.2
Not yet ingested
- Civics
- —
Market trends
- HPI YoY
- ▲ 179.97%
- Current HPI
- 744.8454
- Rent YoY
- —
- Metro
- —
- State GDP YoY
- ▲ 3.21%
- F500 in state
- 116
Industry mix (Fortune 500 HQ in CA)
| Industry | F500 HQs | Revenue |
|---|---|---|
| Technology | 27 | $1,492B |
|
||
| Financial Services | 3 | $174B |
|
||
| Retail | 3 | $44B |
|
||
| Insurance | 3 | $26B |
|
||
| Media / Entertainment | 2 | $115B |
|
||
| Pharmaceuticals / Biotech | 2 | $62B |
|
||
Price history
+180.0% since first listed4 events — show timeline
- 2026-01-20 Listed $315,000 GPSMLS
- 2013-08-13 Sold (MLS) $60,000 GPSMLS
- 2013-04-22 Listed $59,900 GPSMLS
- 2005-07-06 Sold (Public Records) $112,500 Public Records
Property tax history
+1.4%/yrLatest (2025): $1,012 · -24.2% YoY. Source: county tax records.
Cash-flow waterfall
monthlySold comps — $/sqft
last 12 mo · ≤1 miLoading sold comps…