140 South Van Ness Ave #707 · San Francisco, CA
Flood risk 1/10 · Minimal
- FEMA flood zone
- X (unshaded)
- Chance of flooding over 30 yrs
- 0.0%
- Est. flood insurance / yr
- $507 – $1,088
Fire risk 1/10 · Minimal
- Est. fire insurance / yr
- $659 – $1,223
Heat risk 2/10 · Minimal
- Hot days now (above 78°F)
- 8 days/yr
- Hot days in 30 yrs
- 17 days/yr
Wind risk 1/10 · Minimal
- Chance of severe wind over 30 yrs
- —
Air-quality risk 8/10 · Major
- Unhealthy air days now
- 15 days/yr
- Unhealthy air days in 30 yrs
- 15 days/yr
Risk factors via First Street. Map © Google.
Why this score? — see what drove the D grade
The composite is a weighted blend of 9 inputs, each scored 0–100. Each bar is that input's sub-score; the figure is the points it added to the 100-point composite (weight × sub-score).
- ARV discount +7.5/15.0
- Appreciation +7.5/10.0
- Cash flow +5.9/30.0
- Rent growth +5.0/5.0
- Schools +5.0/10.0
- Livability +3.8/5.0
- 1% rule +2.7/10.0
- Condition / age +2.5/5.0
- DSCR +0.3/10.0
$610,000
🖨 Deal sheet 📄 Offer letter ✓ Due diligence
Listing remarks
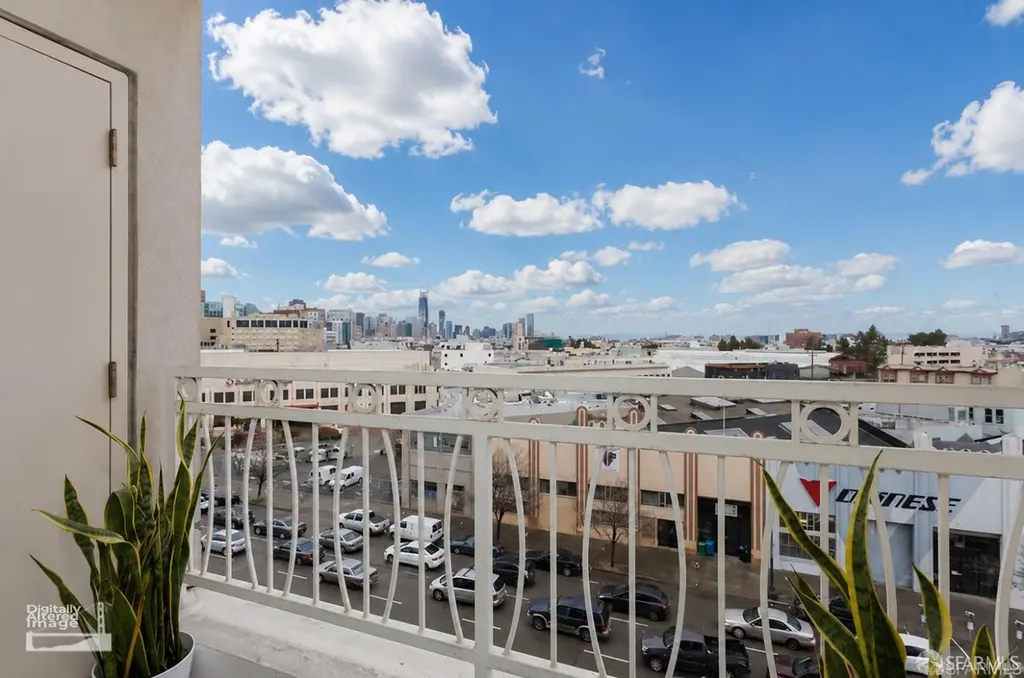
Experience urban living at its finest in this unique two-level condominium at 140 South Van Ness. Situated on an upper floor of a well-maintained high-rise, this thoughtfully designed residence offers the perfect blend of modern comfort, functional living space, and sweeping city views. The main level features an open-concept living and dining area with hardwood flooring, expansive windows, and panoramic outlooks toward the San Francisco skyline. The kitchen is designed for everyday convenience and entertaining, while a stylish powder room completes the upper level. Downstairs, the spacious bedroom serves as a private retreat with direct access to a balcony, abundant natural light, and a la
Key facts
- Versatile bonus area
- Panoramic outlooks
- Private retreat
Tags
Property features AI
Finance
- HOA & community: HOA dues of $763 per month; Association present
Exterior
- Home design: Condominium (residential)
- Exterior features: Balcony; Lot approximately 0.99 acres
Interior
- Kitchen: Microwave
- Bedrooms: 1 bedroom
- Flooring: Carpet
- Bathrooms: 2 bathrooms (1 full, 1 partial)
- Interior features: Microwave; 3 total rooms
- Laundry & utility: Stacked washer and dryer included; Washer included; Dryer included; Laundry closet inside unit
Neighborhood map
What this means for you Summary
Snapshot
- This is a 1-bed/1.0-bath condo listed at $610k.
Deal economics
- At list price, monthly cash flow is $-1k ($-14k/yr) — negative.
- To cash-flow at today's rent, offer at most $402k (34.2% below list).
- To meet the 1% rule (rent ≥ 1% of price), the offer needs to be $472k (22.7% below list).
- Recommended offer: $402k (34.2% below list) — sets the bar for cash-flow.
- Cap rate 4.0% vs local median 2.1% in San Francisco — top-decile yield for the area; either an underpriced asset or a hidden risk that comps aren't pricing in. Stress-test before assuming the spread holds.
Location & tenants
- Location reads 76/100 on livability (#90 in CA, #3,143 nationally) — a middle-class / working-renter tenant base. Strengths: amenities A+, commute A+, employment A+; Watch: crime F, cost of living F.
- San Francisco Unified (urban): math 50% / reading 56% proficiency, ranked #322 of 1,400 in CA (top 23%) — acceptable for families but not a draw, mixed tenant base, ~2y average lease.
- Market conditions: Rents rising fast (+15.5%/yr); 108 active listings in the ZIP; 40 comparable units currently listed for rent nearby; rentals leasing fast (median 8d on market — plan ~1-2 weeks tenant-placement turnaround); high-income renter base; 750 units permitted in San Francisco County in 2024 (688 in 5+ unit buildings).
- At $4,717/mo this rent would consume 49% of the median local household income ($116k/yr) (locally 2666% of renters already pay >50% of income on rent) — very limited rent-growth headroom before tenants either downsize or default.
Forward outlook
- In year one you build about $34k of equity ($4k loan paydown + $30k appreciation (5.0% local appreciation)).
- San Francisco County population projected at +39% by 2050 — long-run rental-demand tailwind backs the buy-and-hold thesis.
- By year 2, paydown + projected appreciation supports a ~$55k cash-out refi (75% LTV) — recoverable capital for the next deal without selling this one.
Negotiation context
- It's been on market 15 days — a 2% lower offer ($601k) is reasonable based on typical stale-listing flexibility.
Questions for the listing agent
- What do current leases actually rent for vs. the listed asking? Can we see a recent rent roll and the last 12 months of T-12 income?
- What does the HOA fee cover, when was the last increase, and are there any pending special assessments or reserve-fund shortfalls?
- Any open or pending special assessments — roof, HVAC, plumbing, elevator, façade? What's the per-unit balance and payoff schedule, and is the seller paying it off at close or rolling it to the buyer?
- Is there a deadline driving the sale (1031 exchange, divorce, estate, relocation)? That informs how much negotiation room exists.
- Schools are B-rated — typically a magnet for longer-tenancy family renters. What's the average tenant stay here, and is there a school-zone premium baked into asking?
- Crime grade is F in this area — have there been break-ins, vandalism, or insurance claims at this property in the last 3 years? What carrier currently insures it and at what premium?
- The area grade is low — what's the realistic commute time and amenity access for the typical tenant pool here? Any planned neighborhood developments (good or bad) we should know about?
- What's the average days-on-market for RENTAL listings here right now (not sales)? A rising rental-DOM trend means longer vacancies and softer asking-rent achievability than the comps imply.
- What's the recent tenant-quality profile in this submarket — average credit score on applications, eviction rate, late-payment / NSF rate, and stable-employment percentage? A property-management company in the area should have these aggregated.
- How much new apartment / multifamily construction is in the pipeline within 1–3 miles? Heavy new supply (>2% of stock underway) typically softens rents 12–24 months out; light construction supports rent growth.
Investment metrics
- 1% rule
- 0.77% ✗
- Cap rate
- 3.97%
- Cash-on-cash
- -8.29%
- DSCR
- 0.63
- GRM
- 10.8
CMA / ARV
No comps found within radius.
Projected returns pro-forma
4.96% appreciation · 8.0% rent growth · sell at horizon
- IRR
- 8.0%
- Equity multiple
- 1.52×
- Total profit
- $89,573
- Equity at exit
- $344,290
- IRR
- 11.9%
- Equity multiple
- 3.33×
- Total profit
- $397,233
- Equity at exit
- $593,052
Cash invested: $170,800 (down + closing). Projections, not guarantees.
Landlord ↔ Tenant lean methodology
- Overall (CITY)
- 0 Strongly Tenant-Friendly
- State California
- 18 Strongly Tenant-Friendly · D+13
- County
- — inherits STATE
- City San Francisco
- 0 Strongly Tenant-Friendly · D+57
ZIP-level market 94103
- Home prices YoY
- 2.9%
- Rents YoY
- 15.5%
- Active inventory
- 108
- Price-to-rent
- 10.8×
Monthly cashflow live
- Estimated rent
- $4,717 high interval (Pro) →
- Mortgage (P&I)
- −$3,199
- Tax from tax record
- −$690 /mo · $8,278/yr
- Insurance
- −$254
- HOA
- −$763
- Vacancy / Maint / Mgmt
- −$990
- Net cashflow
- $-1,180
Break-even live
UW: 25.0% down · 7.5% · 30yr · 1.5% tax · 5.0% vac · 8.0% maint · 8.0% mgmt
Financing live
Cash to close
- Down payment
- $152,500
- Closing costs
- $18,300
- Reserves months
- —
- Total cash needed
- —
Loan-product check · same deal, 3 products live
Conventional
25% down · 7.5% · 30yr
- Down + closing
- —
- Monthly P&I
- —
- Monthly cashflow
- —
- DSCR
- —
- Eligible?
- —
Personal DTI + credit; lowest rate.
DSCR
20% down · 8.5% · 30yr
- Down + closing
- —
- Monthly P&I
- —
- Monthly cashflow
- —
- DSCR
- —
- Eligible?
- —
No personal income docs; deal must DSCR.
Hard money
10% down · 12.0% · 12mo
- Down + closing
- —
- Monthly P&I
- —
- Monthly cashflow
- —
- DSCR
- —
- Eligible?
- —
Short-term bridge; refi at stabilization.
Rent comps 40 comps
| Address | Beds | Baths | Sqft | Rent | $/sqft | DOM | Units | Dist |
|---|---|---|---|---|---|---|---|---|
| 30 Otis St San Francisco, CA | 2.0 | 1.0–2.0 | 874 | $6,956 | $7.95 | 2d | 13 | 0.09mi |
| 1 Brady St San Francisco, CA | 2.0 | 1.0–2.0 | 889 | $5,557 | $6.25 | 1d | 29 | 0.13mi |
| 68 McCoppin St San Francisco, CA | 1.0 | 1.0 | 734 | $3,825 | $5.21 | 16d | 2 | 0.16mi |
| 1699 Market St San Francisco, CA | 1.0 | 1.0 | 561 | $4,817 | $8.59 | 1d | 5 | 0.17mi |
| 55 Page St San Francisco, CA | 1.0 | 1.0 | 868 | $2,450 | $2.82 | 43d | 1 | 0.20mi |
| 8 10th St San Francisco, CA | 2.0 | 1.0–2.0 | 919 | $6,104 | $6.64 | 2d | 28 | 0.30mi |
| 225 Fell St San Francisco, CA | 1.0 | 1.0 | 512 | $4,495 | $8.77 | 7d | 3 | 0.31mi |
| 100 Van Ness Ave #1477 San Francisco, CA | 1.0–2.0 | 1.0–2.0 | 893 | $5,940 | $6.65 | 1d | 2 | 0.31mi |
| 1875 Mission St #210 San Francisco, CA | 1.0 | 1.0 | 825 | $4,000 | $4.85 | 43d | 1 | 0.34mi |
| 1 Polk St San Francisco, CA | 1.0 | 1.0 | 773 | $4,644 | $6.00 | 2d | 4 | 0.34mi |
| 1532 Harrison St San Francisco, CA | 2.0 | 1.0–2.0 | 617 | $3,984 | $6.46 | 1d | 11 | 0.34mi |
| 150 Van Ness Ave #1475 San Francisco, CA | 1.0 | 1.0 | 615 | $5,510 | $8.96 | 20d | 1 | 0.35mi |
| 1600 15th St San Francisco, CA | 1.0–2.0 | 1.0–2.0 | 792 | $4,164 | $5.25 | 3d | 5 | 0.36mi |
| 1390 Market St San Francisco, CA | 1.0 | 1.0 | 561 | $4,067 | $7.25 | 1d | 14 | 0.36mi |
| 325 Octavia St San Francisco, CA | 2.0 | 1.0–2.0 | 811 | $6,909 | $8.52 | 2d | 1 | 0.37mi |
| 380 10th St San Francisco, CA | 2.0 | 2.0 | 1122 | $5,495 | $4.90 | 44d | 1 | 0.39mi |
| 55 9th St San Francisco, CA | 2.0 | 1.0–2.0 | 861 | $4,430 | $5.14 | 2d | 1 | 0.39mi |
| 101 Polk St San Francisco, CA | 1.0 | 1.0 | 573 | $4,614 | $8.04 | 2d | 7 | 0.40mi |
| 1288 Howard St #1908 San Francisco, CA | 1.0–2.0 | 1.0–2.0 | 782 | $4,190 | $5.35 | 1d | 2 | 0.40mi |
| 8 Buchanan St #609 San Francisco, CA | 2.0 | 2.0 | 990 | $6,950 | $7.02 | 7d | 1 | 0.43mi |
| 33 8th St San Francisco, CA | 1.0–2.0 | 1.0 | 646 | $3,744 | $5.79 | 2d | 10 | 0.52mi |
| 1190 Mission St San Francisco, CA | 1.0 | 1.0 | 508 | $3,136 | $6.17 | 1d | 5 | 0.52mi |
| 616 Hayes St San Francisco, CA | 2.0 | 1.0 | 983 | $5,895 | $6.00 | 21d | 1 | 0.53mi |
| 530 Grove St San Francisco, CA | 1.0 | 1.0 | 600 | $3,895 | $6.49 | 7d | 1 | 0.53mi |
| 1222 Harrison St San Francisco, CA | 2.0 | 1.0–2.5 | 853 | $4,798 | $5.62 | 1d | 34 | 0.54mi |
| 1247 Harrison St #21 San Francisco, CA | 1.0 | 1.5 | 1089 | $4,950 | $4.55 | 18d | 1 | 0.56mi |
| 345 8th St San Francisco, CA | 1.0 | 1.0 | 946 | $4,095 | $4.33 | 43d | 2 | 0.56mi |
| 73 Sumner St San Francisco, CA | 2.0 | 2.0 | 1100 | $4,750 | $4.32 | 43d | 1 | 0.56mi |
| 60 Rausch St San Francisco, CA | 1.0 | 1.0 | 767 | $4,300 | $5.61 | 5d | 1 | 0.58mi |
| 400 Duboce Ave San Francisco, CA | 2.0 | 1.0 | 923 | $7,475 | $8.10 | 23d | 1 | 0.60mi |
| 99 Rausch St San Francisco, CA | 1.0 | 1.0 | 655 | $4,250 | $6.49 | 24d | 1 | 0.62mi |
| 677 Oak St Unit 8 San Francisco, CA | 2.0 | 1.0 | 850 | $4,395 | $5.17 | 18d | 1 | 0.63mi |
| 601 Van Ness Ave San Francisco, CA | 1.0 | 1.0 | 653 | $3,795 | $5.81 | 10d | 2 | 0.64mi |
| 257 Church St San Francisco, CA | 2.0 | 1.0 | 1100 | $5,995 | $5.45 | 43d | 1 | 0.64mi |
| 603 Natoma St Apt 406 San Francisco, CA | 1.0 | 1.0 | 556 | $2,950 | $5.31 | 43d | 1 | 0.64mi |
| 750 Golden Gate Ave San Francisco, CA | 3.0 | 1.0–2.5 | 681 | $1,562 | $2.29 | 43d | 1 | 0.66mi |
| 975 Bryant St San Francisco, CA | 2.0 | 1.0–2.0 | 697 | $4,814 | $6.91 | 1d | 10 | 0.72mi |
| 1075 Market St #461 San Francisco, CA | 1.0 | 1.0 | 648 | $3,460 | $5.34 | 20d | 1 | 0.72mi |
| 1075 Market St San Francisco, CA | 1.0 | 1.0 | 546 | $3,500 | $6.40 | 24d | 2 | 0.72mi |
| 801 Fillmore St Apt 1 San Francisco, CA | 2.0 | 1.0 | 970 | $6,195 | $6.39 | 43d | 1 | 0.77mi |
HOA detail condo
- Monthly dues
- $763 · $9,156/yr
- Assessments
- None detected in remarks — confirm with the listing agent.
Listing history 11 events
-
2026-06-18days on market $610,000 Active 15 DOM
-
2026-06-17days on market $610,000 Active 14 DOM
-
2026-06-16days on market $610,000 Active 13 DOM
-
2026-06-15days on market $610,000 Active 12 DOM
-
2026-06-13days on market $610,000 Active 10 DOM
-
2026-06-13days on market $610,000 Active 9 DOM
-
2026-06-09days on market $610,000 Active 6 DOM
-
2026-06-08days on market $610,000 Active 5 DOM
-
2026-06-07days on market $610,000 Active 4 DOM
-
2026-06-04remarks 699-char remark
-
2026-06-04$610,000 Active 1 DOM
ⓘ Source: listings_history table (triggers on properties + properties_extension) + one-shot
backfill from property_details.listing_events for pre-trigger history.
Tax reassessment forecast CA · Resets to sale price
- Current annual tax
- $8,278 · $690/mo
- Projected year-2 tax
- $8,278 · $690/mo
- Expected delta
- $0/yr ($0/mo · 0.0%)
ⓘ Screening estimate from a state-policy table — verify with the county assessor before closing.
Climate risk First Street
- Flood 1/10 Low FEMA zone X (unshaded) · 0% chance over 30 yrs
- Wildfire 1/10 Low
- Heat 2/10 Low 8 d/yr ≥78°F today · 17 d/yr by 30 yrs out
- Wind 1/10 Low
- Air quality 8/10 Severe 15 unhealthy d/yr today · 15 by 30 yrs out
Nearby sold comps map
Loading sold comps map…
Walkable amenities ~0.75 mi
Loading nearby amenities…
Taxation est. · year 1
- Rental income
- $56,599
- − Mortgage interest
- −$34,169
- − Property taxes
- −$8,278
- − Insurance
- −$3,050
- − Repairs & maintenance
- −$4,528
- − Management
- −$4,528
- − HOA
- −$9,156
- − Depreciation
- −$17,745
- Taxable loss
- −$24,855
- Est. tax savings @ 24.0%
- +$5,965
- After-tax cash flow
- $-8,192/yr
For passive investors: Depreciation is non-cash, so a rental often shows a tax loss while cash-flowing — sheltering income. Rental losses are passive: they offset passive income freely, and up to $25,000/yr can offset ordinary (W-2) income if you actively participate and your MAGI is under $100k (phasing out to $0 by $150k); unused losses carry forward. On sale, claimed depreciation is recaptured at up to 25%, and gains may owe capital-gains tax (a 1031 exchange can defer both). Figures are a year-1 estimate at your 24.0% rate — not tax advice; consult a CPA.
Schools (NCES district)
- District
- San Francisco Unified
- NCES district ID
- 0634410
- Math proficiency
- 50% ▬ 0.00%
- Reading proficiency
- 56% ▲ 1.00%
- Median HH income
- $81,249
- Composite
- 50.14/100
- National rank
- #4088
- State rank
- #322 of 1400 in CA
Livability — San Francisco
- Score
- 76/100
- State rank
- #90
- US rank
- #3143
Category grades
Schools grade is shown separately in the Schools card above.
Census & demographics
- Census place
- San Francisco, CA
- County
- San Francisco County · 827,552 people
- City population
- 827,552
- Metro
- San Francisco-Oakland-Berkeley, CA
- Population (ZIP)
- 34,964
- Household income
- $116,438
- Rent vs Own
- Severe rent burden
- 2666.0
Population outlook (San Francisco County) Hauer SSP2
- Today (2025)
- 1,030,936 people
- By 2030
- 1,110,409 · +7.7%
- By 2040
- 1,270,010 · +23.2%
- By 2050
- 1,435,001 · +39.2%
- By 2075
- 1,779,074 · +72.6%
- By 2100
- 1,966,767 · +90.8%
Race, ethnicity, and origin ACS 2023
- Neighborhood character
- Highly diverse neighborhood (Simpson 0.75)
- Race & ethnicity
- White 32% Asian 31% Hispanic / Latino 20% Two or more races 11% Black 10% Native American 2%
- Hispanic origin (detail)
- Mexican 11%
- Common ancestry
- Lithuanian 2% Slovak 2% Romanian 2%
- Foreign-born
- 36% · Canada, China, Vietnam
- Languages at home
- 56% English-only · Spanish 16% Chinese 9% Tagalog/Filipino 6%
Political lean MEDSL · San Francisco
- 2024 margin
- Solid D (+64.8) · D 80.3% · R 15.5% · Other 4.1%
- 2008→2024 swing
- -5.7pp toward R · 2008: 70.5pp · 2024: 64.8pp
- All cycles
- 2024: D+64.8 2020: D+72.5 2016: D+76.1 2012: D+70.2 2008: D+70.5
Not yet ingested
- Civics
- —
Market trends
- HPI YoY
- ▲ 4.96%
- Current HPI
- 175.4945
- Rent YoY
- ▲ 15.50%
- Metro
- San Francisco-Oakland-Berkeley, CA
- State GDP YoY
- ▲ 3.21%
- F500 in state
- 116
Industry mix (Fortune 500 HQ in CA)
| Industry | F500 HQs | Revenue |
|---|---|---|
| Technology | 27 | $1,492B |
|
||
| Financial Services | 3 | $174B |
|
||
| Retail | 3 | $44B |
|
||
| Insurance | 3 | $26B |
|
||
| Media / Entertainment | 2 | $115B |
|
||
| Pharmaceuticals / Biotech | 2 | $62B |
|
||
Price history
+74.3% since first listed3 events — show timeline
- 2026-06-03 Listed $610,000 BAREIS
- 2017-05-10 Sold (Public Records) $761,000 Public Records
- 2003-03-14 Sold (Public Records) $350,000 Public Records
Property tax history
+3.5%/yrLatest (2025): $8,278 · -0.7% YoY. Source: county tax records.
Cash-flow waterfall
monthlySold comps — $/sqft
last 12 mo · ≤1 miLoading sold comps…