 🏷️ Likely Rental
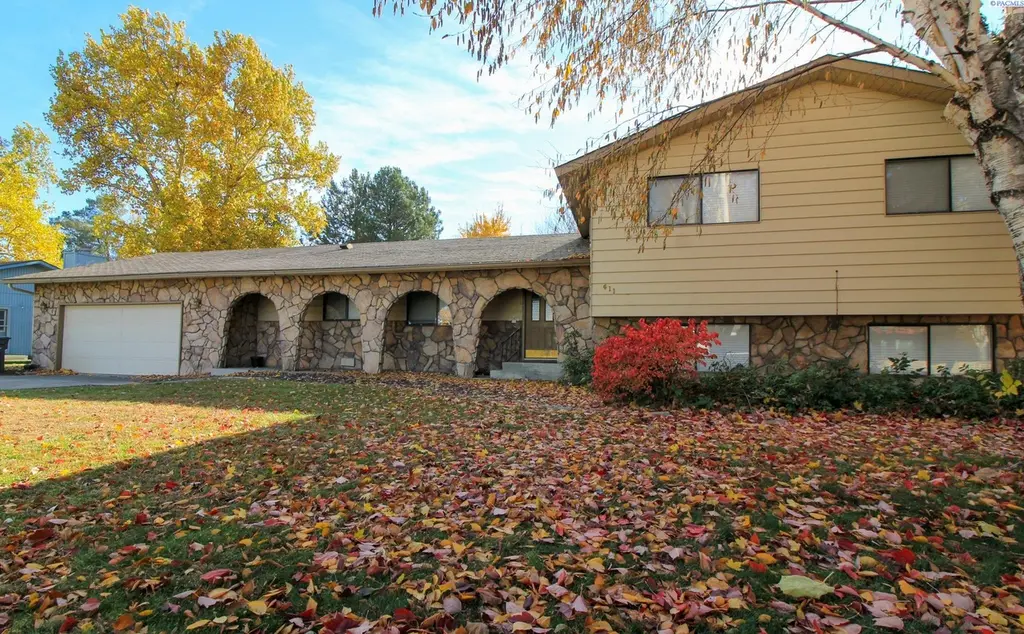
411 Snyder St · Richland, WA
Flood risk 1/10 · Minimal
- FEMA flood zone
- X
- Chance of flooding over 30 yrs
- 0.0%
- Est. flood insurance / yr
- $473 – $860
Fire risk 5/10 · Moderate
- Est. fire insurance / yr
- $604 – $1,122
Heat risk 5/10 · Moderate
- Hot days now (above 99°F)
- 7 days/yr
- Hot days in 30 yrs
- 15 days/yr
Wind risk 1/10 · Minimal
- Chance of severe wind over 30 yrs
- —
Air-quality risk 7/10 · Major
- Unhealthy air days now
- 11 days/yr
- Unhealthy air days in 30 yrs
- 12 days/yr
Risk factors via First Street. Map © Google.
Why this score? — see what drove the D+ grade
The composite is a weighted blend of 9 inputs, each scored 0–100. Each bar is that input's sub-score; the figure is the points it added to the 100-point composite (weight × sub-score).
- Cash flow +15.0/30.0
- ARV discount +7.5/15.0
- Schools +5.3/10.0
- 1% rule +5.0/10.0
- DSCR +5.0/10.0
- Livability +4.0/5.0
- Rent growth +2.7/5.0
- Condition / age +2.5/5.0
- Appreciation +0.0/10.0
$2,250
🖨 Deal sheet 📄 Offer letter ✓ Due diligence
Listing remarks MLS
4 Bed/3 Bath House in North Richland Applications and Viewing Requests accepted from OUR WEBSITE ONLY: * * Additional Photos Coming Soon * * 4 bed, 3.5 bath, 2619 sqft house in North Richland Interior: * Large kitchen with lots of cabinet/counterspace & built-in desk, dining nook * Formal dining room and living room with bay windows & wood-burning fireplace * Lower level also has a large living space * Primary bedroom has attached bathroom with a dual vanity * Half bath off the laundry room Exterior: * Attached 2 car garage * Fully fenced back yard with mature landscaping * Covered concrete back patio Additional Lease Information: * 6 month lease, with annual renewals * No pets Deposit & Fees Include: $1,576 Refundable Deposit $329 Non-Refundable Inspection Fee $290 Non-Refundable Carpet Care Fee
Key facts
- Formal dining room
- Large kitchen
- Built-in desk
Tags
Property features AI
Exterior
- Parking: 2 total parking spaces; 2 covered parking spaces; 2-car garage
- Home design: Single-family residence; Site-built on owned lot; Two levels / 2 stories; New construction
- Construction: Built as new construction
- Exterior features: Lot approximately 0.39 acres (about 16,988 sq ft); Zoned single-family residential; Subdivision: MERRILLS 5TH AD
Interior
- Bathrooms: Three full bathrooms; One half bathroom
- Interior features: No basement
Neighborhood map
What this means for you Summary
Snapshot
- This is a 3-bed/3.5-bath single-family listed at $2k.
Deal economics
- At list price, monthly cash flow is $2k ($20k/yr) — positive.
- The deal already cash-flows at list — no discount required.
- Meets the 1% rule at list price ($2k rent vs $2k).
- Recommended offer: $2k (1.5% below list) — sets the bar for market timing.
- Cap rate 879.5% vs local median 2.8% in Richland — top-decile yield for the area; either an underpriced asset or a hidden risk that comps aren't pricing in. Stress-test before assuming the spread holds.
Location & tenants
- Location reads 79/100 on livability (#112 in WA, #2,258 nationally) — a middle-class / working-renter tenant base. Strengths: commute A+, housing A+, health & safety A+; Watch: cost of living C-, amenities F.
- Richland School District (urban): math 52% / reading 64% proficiency, ranked #61 of 291 in WA (top 21%) — acceptable for families but not a draw, mixed tenant base, ~2y average lease.
- Market conditions: Rents flat; 129 active listings in the ZIP; solid renter incomes; 1,532 units permitted in Benton County in 2024 (389 in 5+ unit buildings).
Forward outlook
- Local home prices are declining (-3.0%/yr); year-one equity from $16 of loan paydown is wiped out by about $68 of value loss. Plan a longer hold.
- Benton County population projected at +32% by 2050 — long-run rental-demand tailwind backs the buy-and-hold thesis.
- At projected returns (-3.0% appreciation + 0.6% rent growth), your $630 cash investment doubles in ~1 year — after that, you're playing with house money.
Negotiation context
- It's been on market 17 days — a 2% lower offer ($2k) is reasonable based on typical stale-listing flexibility.
- 3 sale attempts since 18y ago with the ask held roughly flat each time — persistent listings suggest the price (not the market) is what's stuck; bring a comps-based counter.
Risks & watch-outs
- Climate carrying-cost: moderate wildfire risk; extreme-heat days projected 7→15/yr by 2055 (HVAC capex compounding) — expect insurance premiums to compound above CPI over the hold.
Questions for the listing agent
- Built in 1978 — when were the roof, HVAC, electrical panel, plumbing, and water heater last replaced?
- Is there a deadline driving the sale (1031 exchange, divorce, estate, relocation)? That informs how much negotiation room exists.
- Schools are A-rated — typically a magnet for longer-tenancy family renters. What's the average tenant stay here, and is there a school-zone premium baked into asking?
- The area grade is low — what's the realistic commute time and amenity access for the typical tenant pool here? Any planned neighborhood developments (good or bad) we should know about?
- What's the average days-on-market for RENTAL listings here right now (not sales)? A rising rental-DOM trend means longer vacancies and softer asking-rent achievability than the comps imply.
- What's the recent tenant-quality profile in this submarket — average credit score on applications, eviction rate, late-payment / NSF rate, and stable-employment percentage? A property-management company in the area should have these aggregated.
- How much new for-sale + rental construction is in the pipeline within 1–3 miles? Heavy new supply typically softens prices + rents 12–24 months out; constrained supply supports both.
Investment metrics
- 1% rule
- 92.98% ✓
- Cap rate
- 879.46%
- Cash-on-cash
- 3118.46%
- DSCR
- 139.75
- GRM
- 0.1
CMA / ARV
- ARV (on-the-fly)
- $554,180
- Comps found
- 12
Show comp detail 12 sales within ~0.75 mi
| Address | Dist | Beds/Ba | Sqft | Sold | Price | $/sf | Match |
|---|---|---|---|---|---|---|---|
| 505 Wagon Ct | 0.14mi | 4/3.0 (+1) | 2,400 (-1%) | 1mo | $529,900 | $221 | 85 |
| 1206 17th St | 0.30mi | 3/2.5 | 2,463 (+2%) | 6mo | $564,809 | $229 | 74 |
| 2150 Cascade Ave | 0.52mi | 4/2.5 (+1) | 2,400 (-1%) | 0mo | $419,900 | $175 | 65 |
| 2460 Westmoreland Dr | 0.50mi | 4/2.5 (+1) | 2,392 (-1%) | 5mo | $450,000 | $188 | 62 |
| 406 Shoreline Ct | 0.28mi | 4/3.0 (+1) | 2,232 (-8%) | 8mo | $425,000 | $190 | 60 |
| 513 Holly St | 0.33mi | 3/2.0 | 2,124 (-12%) | 0mo | $416,500 | $196 | 58 |
| 533 Doubletree Ct | 0.17mi | 4/2.0 (+1) | 2,058 (-15%) | 1mo | $485,000 | $236 | 55 |
| 303 Spring St | 0.53mi | 4/3.0 (+1) | 2,688 (+11%) | 0mo | $619,000 | $230 | 49 |
| 2453 Catalina Ct | 0.37mi | 4/3.0 (+1) | 2,112 (-13%) | 8mo | $425,000 | $201 | 47 |
| 2441 Harris Ave | 0.60mi | 4/3.0 (+1) | 2,700 (+12%) | 0mo | $635,000 | $235 | 46 |
| 2509 Albemarle Ct | 0.63mi | 4/3.0 (+1) | 2,240 (-7%) | 9mo | $599,000 | $267 | 44 |
| 2110 Davison Ave | 0.46mi | 4/2.5 (+1) | 2,078 (-14%) | 7mo | $542,500 | $261 | 40 |
Match score weights: distance 35% · size 25% · config 20% · recency 20%. Top-matched comps best support the ARV.
Projected returns pro-forma
-3.0% appreciation · 0.62% rent growth · sell at horizon
- IRR
- —
- Equity multiple
- 158.22×
- Total profit
- $99,047
- Equity at exit
- $335
- IRR
- —
- Equity multiple
- 320.84×
- Total profit
- $201,500
- Equity at exit
- $195
Cash invested: $630 (down + closing). Projections, not guarantees.
Landlord ↔ Tenant lean methodology
- Overall (STATE)
- 28 Tenant-Leaning
- State Washington
- 28 Tenant-Leaning · D+8
- County
- — inherits STATE
- City
- — inherits STATE
ZIP-level market 99354
- Rents YoY
- 0.6%
- Active inventory
- 129
- Price-to-rent
- 0.1×
Monthly cashflow live
- Estimated rent
- $2,092 medium interval (Pro) →
- Mortgage (P&I)
- −$12
- Tax est. 1.5%
- −$3 /mo · $34/yr
- Insurance
- −$1
- HOA
- −$0
- Vacancy / Maint / Mgmt
- −$439
- Net cashflow
- $1,637
Break-even live
UW: 25.0% down · 7.5% · 30yr · 1.5% tax · 5.0% vac · 8.0% maint · 8.0% mgmt
Financing live
Cash to close
- Down payment
- $562
- Closing costs
- $68
- Reserves months
- —
- Total cash needed
- —
Loan-product check · same deal, 3 products live
Conventional
25% down · 7.5% · 30yr
- Down + closing
- —
- Monthly P&I
- —
- Monthly cashflow
- —
- DSCR
- —
- Eligible?
- —
Personal DTI + credit; lowest rate.
DSCR
20% down · 8.5% · 30yr
- Down + closing
- —
- Monthly P&I
- —
- Monthly cashflow
- —
- DSCR
- —
- Eligible?
- —
No personal income docs; deal must DSCR.
Hard money
10% down · 12.0% · 12mo
- Down + closing
- —
- Monthly P&I
- —
- Monthly cashflow
- —
- DSCR
- —
- Eligible?
- —
Short-term bridge; refi at stabilization.
Listing history 14 events
-
2026-06-18days on market $2,250 Active 17 DOM
-
2026-06-17days on market $2,250 Active 16 DOM
-
2026-06-16days on market $2,250 Active 15 DOM
-
2026-06-15days on market $2,250 Active 14 DOM
-
2026-06-14days on market $2,250 Active 12 DOM
-
2026-06-13days on market $2,250 Active 11 DOM
-
2026-06-10days on market $2,250 Active 9 DOM
-
2026-06-09days on market $2,250 Active 8 DOM
-
2026-06-08days on market $2,250 Active 7 DOM
-
2026-06-07days on market $2,250 Active 6 DOM
-
2026-06-05days on market $2,250 Active 3 DOM
-
2026-06-03days on market $2,250 Active 2 DOM
-
2026-06-02remarks 687-char remark
-
2026-06-02$2,250 Active 1 DOM
ⓘ Source: listings_history table (triggers on properties + properties_extension) + one-shot
backfill from property_details.listing_events for pre-trigger history.
Climate risk First Street
- Flood 1/10 Low FEMA zone X · 0% chance over 30 yrs
- Wildfire 5/10 Major
- Heat 5/10 Major 7 d/yr ≥99°F today · 15 d/yr by 30 yrs out
- Wind 1/10 Low
- Air quality 7/10 Severe 11 unhealthy d/yr today · 12 by 30 yrs out
Nearby sold comps map
Loading sold comps map…
Walkable amenities ~0.75 mi
Loading nearby amenities…
Taxation est. · year 1
- Rental income
- $25,105
- − Mortgage interest
- −$126
- − Property taxes
- −$34
- − Insurance
- −$11
- − Repairs & maintenance
- −$2,008
- − Management
- −$2,008
- − Depreciation
- −$65
- Taxable income
- $20,852
- Est. tax owed @ 24.0%
- −$5,004
- After-tax cash flow
- $14,642/yr
For passive investors: Depreciation is non-cash, so a rental often shows a tax loss while cash-flowing — sheltering income. Rental losses are passive: they offset passive income freely, and up to $25,000/yr can offset ordinary (W-2) income if you actively participate and your MAGI is under $100k (phasing out to $0 by $150k); unused losses carry forward. On sale, claimed depreciation is recaptured at up to 25%, and gains may owe capital-gains tax (a 1031 exchange can defer both). Figures are a year-1 estimate at your 24.0% rate — not tax advice; consult a CPA.
Schools (NCES district)
- District
- Richland School District
- NCES district ID
- 5307320
- Math proficiency
- 52% ▬ 0.00%
- Reading proficiency
- 64% ▼ -1.00%
- Median HH income
- $70,475
- Composite
- 53.04/100
- National rank
- #3244
- State rank
- #61 of 291 in WA
Livability — Richland
- Score
- 79/100
- State rank
- #112
- US rank
- #2258
Category grades
Schools grade is shown separately in the Schools card above.
Census & demographics
- Census place
- Richland, WA
- County
- Benton County · 186,895 people
- City population
- 62,989
- Metro
- Kennewick-Richland, WA
- Population (ZIP)
- 25,559
- Household income
- $91,933
- Rent vs Own
- Severe rent burden
- 545.0
Population outlook (Benton County) Hauer SSP2
- Today (2025)
- 219,421 people
- By 2030
- 233,813 · +6.6%
- By 2040
- 262,134 · +19.5%
- By 2050
- 290,100 · +32.2%
- By 2075
- 363,525 · +65.7%
- By 2100
- 418,667 · +90.8%
Race, ethnicity, and origin ACS 2023
- Neighborhood character
- Predominantly White (75%)
- Race & ethnicity
- White 75% Hispanic / Latino 14% Two or more races 10% Asian 4% Native American 1%
- Hispanic origin (detail)
- Mexican 12%
- Common ancestry
- Portuguese 4% Italian 4% Slovak 3%
- Foreign-born
- 6% · Canada, China, Vietnam
- Languages at home
- 89% English-only · Spanish 5% Russian/Polish/Slavic 1% Chinese 1%
Political lean MEDSL · Benton
- 2024 margin
- Strong R (+21.9) · D 37.7% · R 59.6% · Other 2.7%
- 2008→2024 swing
- +4.2pp toward D · 2008: -26.1pp · 2024: -21.9pp
- All cycles
- 2024: R+21.9 2020: R+21.0 2016: R+26.6 2012: R+27.0 2008: R+26.1
Not yet ingested
- Civics
- —
Market trends
- HPI YoY
- ▼ -353.00%
- Current HPI
- 235.9082
- Rent YoY
- ▲ 0.62%
- Metro
- Kennewick-Richland, WA
- State GDP YoY
- ▲ 4.65%
- F500 in state
- 22
Industry mix (Fortune 500 HQ in WA)
| Industry | F500 HQs | Revenue |
|---|---|---|
| Retail | 2 | $269B |
|
||
| Technology / Retail | 1 | $638B |
|
||
| Technology | 1 | $245B |
|
||
| Telecommunications | 1 | $38B |
|
||
| Food / Beverage | 1 | $36B |
|
||
| Automotive / Trucks | 1 | $34B |
|
||
Price history
-99.1% since first listed7 events — show timeline
- 2026-06-01 Listed $2,250 PACMLS
- 2025-01-06 Sold (MLS) $2,195 PACMLS
- 2024-11-18 Listed $2,195 PACMLS
- 2022-03-23 Price Changed $2,100 RENT.
- 2008-05-23 Sold (Public Records) $244,000 Public Records
- 2008-05-23 Sold (MLS) $244,000 PACMLS
- 2008-03-12 Listed $249,900 PACMLS
Property tax history
+3.0%/yrLatest (2026): $3,932 · -0.9% YoY. Source: county tax records.
Cash-flow waterfall
monthlySold comps — $/sqft
last 12 mo · ≤1 miLoading sold comps…