3370 Highway 192 · Holladay, TN
Flood risk 1/10 · Minimal
- FEMA flood zone
- X (unshaded)
- Chance of flooding over 30 yrs
- 0.0%
- Est. flood insurance / yr
- $473 – $860
Fire risk 6/10 · Moderate
- Est. fire insurance / yr
- $949 – $1,763
Heat risk 5/10 · Moderate
- Hot days now (above 108°F)
- 7 days/yr
- Hot days in 30 yrs
- 20 days/yr
Wind risk 4/10 · Minor
- Chance of severe wind over 30 yrs
- 11.0%
Air-quality risk 1/10 · Minimal
- Unhealthy air days now
- 0 days/yr
- Unhealthy air days in 30 yrs
- 0 days/yr
Risk factors via First Street. Map © Google.
Why this score? — see what drove the C+ grade
The composite is a weighted blend of 9 inputs, each scored 0–100. Each bar is that input's sub-score; the figure is the points it added to the 100-point composite (weight × sub-score).
- Cash flow +21.6/30.0
- Appreciation +10.0/10.0
- ARV discount +7.5/15.0
- DSCR +6.9/10.0
- 1% rule +4.5/10.0
- Rent growth +2.5/5.0
- Livability +2.5/5.0
- Condition / age +2.5/5.0
- Schools +2.4/10.0
$99,900
🖨 Deal sheet 📄 Offer letter ✓ Due diligence
Listing remarks MLS
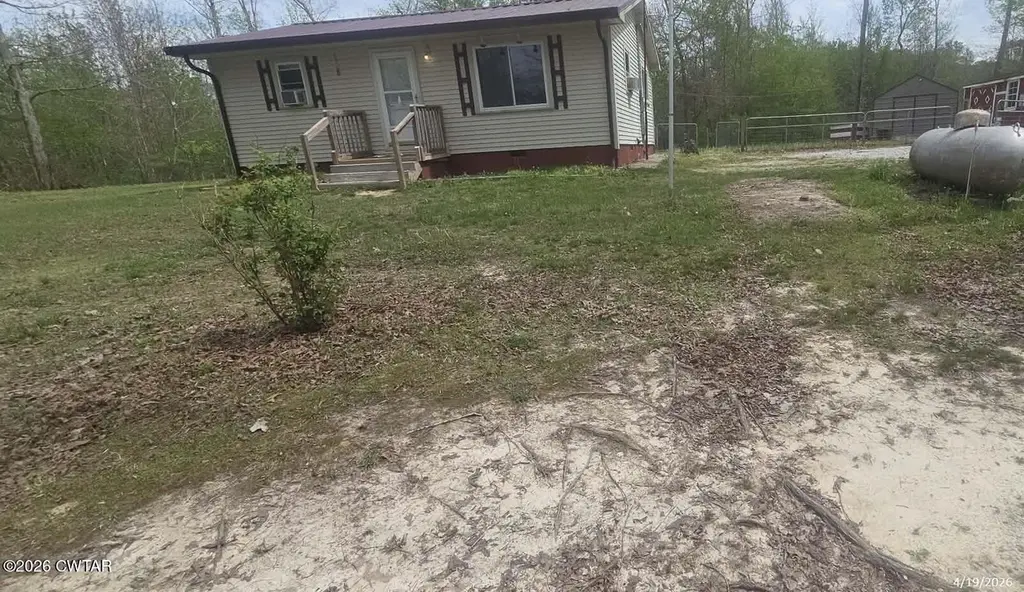
Very nice house with 2 outbuildings in the country with fenced in back yard. It has hardwood floors with a eat-in kitchen. Metal roof with gutters. House has tilt insulated windows. No central but has 2 air conditioners and gas fireplace and living room has base board heating. Great starter or retirement house.
Key facts
- Metal roof
- Boat dock
- Circle drive
Tags
Property features AI
Exterior
- Parking: Circular gravel driveway; 4 parking spaces
- Utilities: Electricity connected; Water connected; Propane
- Home design: Single family residence; One story
- Construction: Vinyl siding
- Exterior features: Metal roof; Shed(s)
Interior
- Bedrooms: 2 main-level bedrooms
- Flooring: Hardwood; Vinyl
- Bathrooms: 1 full bathroom (main level)
- Heating & cooling: Fireplace heating; Ceiling fan(s); Window unit(s)
- Interior features: Ceiling fan(s); Ventless fireplace
Neighborhood map
What this means for you Summary
Snapshot
- This is a 2-bed/1.0-bath single-family listed at $100k.
Deal economics
- At list price, monthly cash flow is $152 ($2k/yr) — positive.
- The deal already cash-flows at list — no discount required.
- To meet the 1% rule (rent ≥ 1% of price), the offer needs to be $95k (5.0% below list).
- Recommended offer: $95k (5.0% below list) — sets the bar for 1% rule.
Location & tenants
- Location reads: area grade C — affects rentability + tenant quality, not the cash-flow math above.
- Benton County (town): math 31% / reading 28% proficiency, ranked #66 of 139 in TN (top 48%) — low school quality limits family demand, transient renter base, plan for 1-2y turnover.
- Market conditions: 72 active listings in the ZIP; 6 units permitted in Benton County in 2024 (0 in 5+ unit buildings).
Forward outlook
- In year one you build about $11k of equity ($691 loan paydown + $10k appreciation (10.0% local appreciation)).
- Benton County population projected at -18% by 2050 — secular population decline; favor cash flow + early exit over multi-decade hold.
- At projected returns (10.0% appreciation + 3.0% rent growth), your $28k cash investment doubles in ~3 years — after that, you're playing with house money.
- By year 4, paydown + projected appreciation supports a ~$38k cash-out refi (75% LTV) — recoverable capital for the next deal without selling this one.
Negotiation context
- Only 12 days on market — expect competitive offers; lowballing is unlikely to land.
- 4 sale attempts since 8y ago with the ask held roughly flat each time — persistent listings suggest the price (not the market) is what's stuck; bring a comps-based counter.
Risks & watch-outs
- Climate carrying-cost: major wildfire risk; extreme-heat days projected 7→20/yr by 2055 (HVAC capex compounding) — expect insurance premiums to compound above CPI over the hold.
Questions for the listing agent
- Built in 1960 — when were the roof, HVAC, electrical panel, plumbing, and water heater last replaced?
- Is there a deadline driving the sale (1031 exchange, divorce, estate, relocation)? That informs how much negotiation room exists.
- What's the average days-on-market for RENTAL listings here right now (not sales)? A rising rental-DOM trend means longer vacancies and softer asking-rent achievability than the comps imply.
- What's the recent tenant-quality profile in this submarket — average credit score on applications, eviction rate, late-payment / NSF rate, and stable-employment percentage? A property-management company in the area should have these aggregated.
- How much new for-sale + rental construction is in the pipeline within 1–3 miles? Heavy new supply typically softens prices + rents 12–24 months out; constrained supply supports both.
Investment metrics
- 1% rule
- 0.95% ✗
- Cap rate
- 8.11%
- Cash-on-cash
- 6.51%
- DSCR
- 1.29
- GRM
- 8.8
CMA / ARV
No comps found within radius.
Projected returns pro-forma
10.0% appreciation · 3.0% rent growth · sell at horizon
- IRR
- 29.0%
- Equity multiple
- 3.29×
- Total profit
- $64,023
- Equity at exit
- $89,998
- IRR
- 25.2%
- Equity multiple
- 7.47×
- Total profit
- $180,859
- Equity at exit
- $194,084
Cash invested: $27,972 (down + closing). Projections, not guarantees.
Landlord ↔ Tenant lean methodology
- Overall (STATE)
- 87 Strongly Landlord-Friendly
- State Tennessee
- 87 Strongly Landlord-Friendly · R+13
- County
- — inherits STATE
- City
- — inherits STATE
ZIP-level market 38341
- Home prices YoY
- 4.8%
- Active inventory
- 72
- Price-to-rent
- 8.8×
Monthly cashflow live
- Estimated rent
- $949 medium interval (Pro) →
- Mortgage (P&I)
- −$524
- Tax from tax record
- −$32 /mo · $389/yr
- Insurance
- −$42
- HOA
- −$0
- Vacancy / Maint / Mgmt
- −$199
- Net cashflow
- $152
Break-even live
UW: 25.0% down · 7.5% · 30yr · 1.5% tax · 5.0% vac · 8.0% maint · 8.0% mgmt
Financing live
Cash to close
- Down payment
- $24,975
- Closing costs
- $2,997
- Reserves months
- —
- Total cash needed
- —
Loan-product check · same deal, 3 products live
Conventional
25% down · 7.5% · 30yr
- Down + closing
- —
- Monthly P&I
- —
- Monthly cashflow
- —
- DSCR
- —
- Eligible?
- —
Personal DTI + credit; lowest rate.
DSCR
20% down · 8.5% · 30yr
- Down + closing
- —
- Monthly P&I
- —
- Monthly cashflow
- —
- DSCR
- —
- Eligible?
- —
No personal income docs; deal must DSCR.
Hard money
10% down · 12.0% · 12mo
- Down + closing
- —
- Monthly P&I
- —
- Monthly cashflow
- —
- DSCR
- —
- Eligible?
- —
Short-term bridge; refi at stabilization.
Listing history 13 events
-
2026-04-29status Pending
-
2026-04-16$99,900 Active
-
2026-01-07historical
-
2026-01-06$125,000 Active
-
2026-01-02historical
-
2024-04-15soldstatus $100,000
-
2024-04-12soldstatus $100,000 Closed 312-char remark
Show marketing remark (312 chars)
Very nice house with 2 outbuildings in the country with fenced in back yard. It has hardwood floors with a eat-in kitchen. Metal roof with gutters. House has tilt insulated windows. No central but has 2 air conditioners and gas fireplace and living room has base board heating. Great starter or retirement house.
-
2024-03-14status Pending 312-char remark
Show marketing remark (312 chars)
Very nice house with 2 outbuildings in the country with fenced in back yard. It has hardwood floors with a eat-in kitchen. Metal roof with gutters. House has tilt insulated windows. No central but has 2 air conditioners and gas fireplace and living room has base board heating. Great starter or retirement house.
-
2024-02-26$109,900 Active 312-char remark
Show marketing remark (312 chars)
Very nice house with 2 outbuildings in the country with fenced in back yard. It has hardwood floors with a eat-in kitchen. Metal roof with gutters. House has tilt insulated windows. No central but has 2 air conditioners and gas fireplace and living room has base board heating. Great starter or retirement house.
-
2018-12-21soldstatus $61,000
-
2018-12-20soldstatus $61,000
-
2018-10-25$65,000
-
2013-02-27soldstatus $37,500
ⓘ Source: listings_history table (triggers on properties + properties_extension) + one-shot
backfill from property_details.listing_events for pre-trigger history.
Tax reassessment forecast TN · Resets to sale price
- Current annual tax
- $389 · $32/mo
- Projected year-2 tax
- $709 · $59/mo
- Expected delta
- +$320/yr (+$27/mo · 82.3%)
ⓘ Screening estimate from a state-policy table — verify with the county assessor before closing.
Climate risk First Street
- Flood 1/10 Low FEMA zone X (unshaded) · 0% chance over 30 yrs
- Wildfire 6/10 Major
- Heat 5/10 Major 7 d/yr ≥108°F today · 20 d/yr by 30 yrs out
- Wind 4/10 Moderate 11% chance of damaging wind over 30 yrs
- Air quality 1/10 Low 0 unhealthy d/yr today · 0 by 30 yrs out
Nearby sold comps map
Loading sold comps map…
Walkable amenities ~0.75 mi
Loading nearby amenities…
Taxation est. · year 1
- Rental income
- $11,386
- − Mortgage interest
- −$5,596
- − Property taxes
- −$389
- − Insurance
- −$500
- − Repairs & maintenance
- −$911
- − Management
- −$911
- − Depreciation
- −$2,906
- Taxable income
- $173
- Est. tax owed @ 24.0%
- −$42
- After-tax cash flow
- $1,778/yr
For passive investors: Depreciation is non-cash, so a rental often shows a tax loss while cash-flowing — sheltering income. Rental losses are passive: they offset passive income freely, and up to $25,000/yr can offset ordinary (W-2) income if you actively participate and your MAGI is under $100k (phasing out to $0 by $150k); unused losses carry forward. On sale, claimed depreciation is recaptured at up to 25%, and gains may owe capital-gains tax (a 1031 exchange can defer both). Figures are a year-1 estimate at your 24.0% rate — not tax advice; consult a CPA.
Schools (NCES district)
- District
- Benton County
- NCES district ID
- 4700240
- Math proficiency
- 31% ▼ -8.00%
- Reading proficiency
- 28% ▼ -7.00%
- Median HH income
- $33,587
- Composite
- 24.24/100
- National rank
- #7722
- State rank
- #66 of 139 in TN
Livability — Holladay
No livability data for this city. (Only ~50 U.S. cities are tracked.)
Census & demographics
- Population (ZIP)
- 2,544
Population outlook (Benton County) Hauer SSP2
- Today (2025)
- 15,046 people
- By 2030
- 14,425 · -4.1%
- By 2040
- 13,296 · -11.6%
- By 2050
- 12,298 · -18.3%
- By 2075
- 10,347 · -31.2%
- By 2100
- 8,594 · -42.9%
Race, ethnicity, and origin ACS 2023
- Neighborhood character
- Predominantly White (83%)
- Race & ethnicity
- White 83% Two or more races 9% Hispanic / Latino 8% Pacific Islander 3% Black 3%
- Hispanic origin (detail)
- Mexican 8%
- Common ancestry
- Slovak 5% Iranian 1% Romanian 1%
- Foreign-born
- 1% · Canada
- Languages at home
- 97% English-only · Spanish 2% German/W. Germanic 1%
Political lean MEDSL · Benton
- 2024 margin
- Solid R (+62.9) · D 18.1% · R 81.1%
- 2008→2024 swing
- -46.7pp toward R · 2008: -16.2pp · 2024: -62.9pp
- All cycles
- 2024: R+62.9 2020: R+57.0 2016: R+51.3 2012: R+25.6 2008: R+16.2
Not yet ingested
- Civics
- —
Market trends
- HPI YoY
- ▲ 14.29%
- Current HPI
- 309.867
- Rent YoY
- —
- Metro
- —
- State GDP YoY
- ▲ 2.78%
- F500 in state
- 22
Industry mix (Fortune 500 HQ in TN)
| Industry | F500 HQs | Revenue |
|---|---|---|
| Healthcare | 3 | $91B |
|
||
| Retail | 3 | $72B |
|
||
| Transportation / Logistics | 1 | $88B |
|
||
| Paper / Packaging | 1 | $19B |
|
||
| Insurance | 1 | $13B |
|
||
| Energy | 1 | $12B |
|
||
Price history
+166.4% since first listed13 events — show timeline
- 2026-04-29 Pending — CWTAR
- 2026-04-16 Listed $99,900 CWTAR
- 2026-01-07 Listing Removed — REALTRACS as Distributed by MLS Grid
- 2026-01-06 Listed $125,000 REALTRACS as Distributed by MLS Grid
- 2026-01-02 Coming Soon — REALTRACS as Distributed by MLS Grid
- 2024-04-15 Sold (Public Records) $100,000 Public Records
- 2024-04-12 Sold (MLS) $100,000 TVAR
- 2024-03-14 Pending — TVAR
- 2024-02-26 Listed $109,900 TVAR
- 2018-12-21 Sold (Public Records) $61,000 Public Records
- 2018-12-20 Sold (MLS) $61,000 TVAR
- 2018-10-25 Listed $65,000 TVAR
- 2013-02-27 Sold (Public Records) $37,500 Public Records
Property tax history
+5.7%/yrLatest (2025): $389 · +23.1% YoY. Source: county tax records.
Cash-flow waterfall
monthlySold comps — $/sqft
last 12 mo · ≤1 miLoading sold comps…