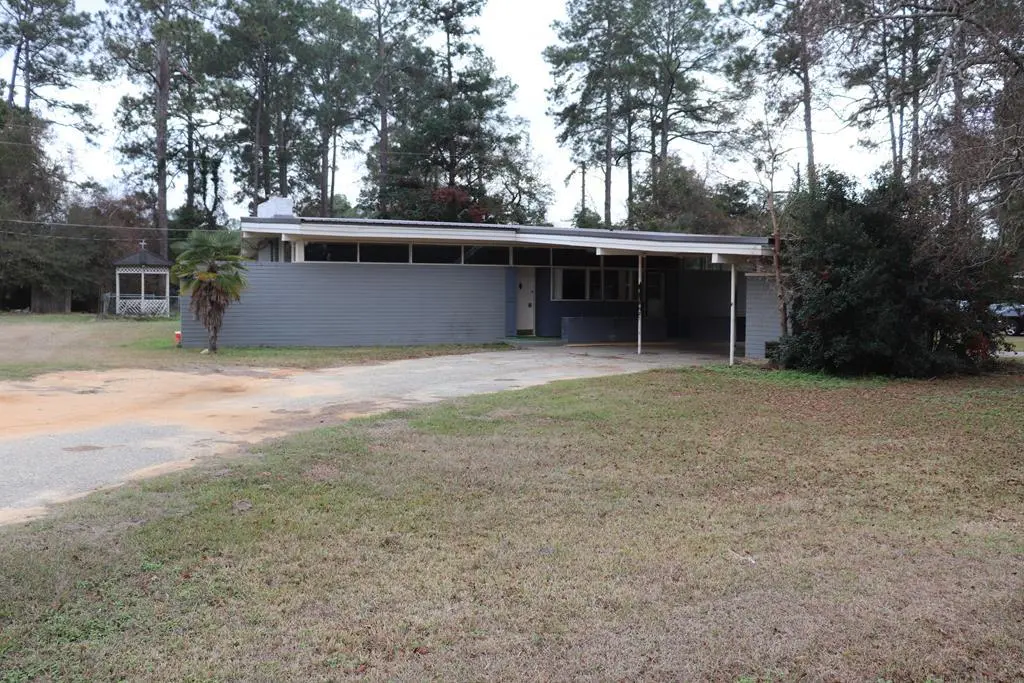
912 Rose Ln · Cordele, GA
Flood risk 1/10 · Minimal
- FEMA flood zone
- X (unshaded)
- Chance of flooding over 30 yrs
- 0.0%
- Est. flood insurance / yr
- $473 – $860
Fire risk 4/10 · Minor
- Est. fire insurance / yr
- $963 – $1,789
Heat risk 7/10 · Major
- Hot days now (above 110°F)
- 7 days/yr
- Hot days in 30 yrs
- 18 days/yr
Wind risk 8/10 · Major
- Chance of severe wind over 30 yrs
- 80.0%
Air-quality risk 3/10 · Minor
- Unhealthy air days now
- 2 days/yr
- Unhealthy air days in 30 yrs
- 3 days/yr
Risk factors via First Street. Map © Google.
Why this score? — see what drove the C- grade
The composite is a weighted blend of 9 inputs, each scored 0–100. Each bar is that input's sub-score; the figure is the points it added to the 100-point composite (weight × sub-score).
- Cash flow +16.6/30.0
- ARV discount +15.0/15.0
- DSCR +5.1/10.0
- 1% rule +4.2/10.0
- Livability +2.7/5.0
- Rent growth +2.5/5.0
- Condition / age +2.5/5.0
- Schools +1.7/10.0
- Appreciation +0.0/10.0
$152,600
🖨 Deal sheet 📄 Offer letter ✓ Due diligence
Listing remarks MLS
ATTENTION all INVESTORS & RETRO LOVERS!!!! This contemporary home has so much potential and needs some TLC. It features a nice big open floorplan with 3 bedrooms and 2 full baths. Call today to tour this really unique home!!!
Key facts
- 0.84 acre lot
- 2 parking spots
- Pool
Neighborhood map
What this means for you Summary
Snapshot
- This is a 3-bed/2.0-bath single-family listed at $153k.
Deal economics
- At list price, monthly cash flow is $91 ($1k/yr) — positive.
- The deal already cash-flows at list — no discount required.
- To meet the 1% rule (rent ≥ 1% of price), the offer needs to be $141k (7.8% below list).
- Recommended offer: $134k (12.0% below list) — sets the bar for market timing.
- Cap rate 7.0% vs local median 4.1% in Cordele — top-decile yield for the area; either an underpriced asset or a hidden risk that comps aren't pricing in. Stress-test before assuming the spread holds.
Location & tenants
- Location reads 53/100 on livability (#556 in GA) — a working-class tenant base; expect higher turnover. Strengths: cost of living A+; Watch: schools F, crime F, amenities F.
- Crisp County (rural): math 20% / reading 21% proficiency, ranked #143 of 174 in GA (top 82%) — low school quality limits family demand, transient renter base, plan for 1-2y turnover; 73% free/reduced lunch — lower-income household profile, screen leases tightly.
- Market conditions: 166 active listings in the ZIP; 21 units permitted in Crisp County in 2024 (0 in 5+ unit buildings).
Forward outlook
- Local home prices are declining (-3.0%/yr); year-one equity from $1k of loan paydown is wiped out by about $5k of value loss. Plan a longer hold.
- Crisp County population projected at -22% by 2050 — secular population decline; favor cash flow + early exit over multi-decade hold.
Negotiation context
- It's been on market 163 days — a 12% lower offer ($134k) is reasonable based on typical stale-listing flexibility.
- 2 sale attempts with the ask held roughly flat each time — persistent listings suggest the price (not the market) is what's stuck; bring a comps-based counter.
- Current owner paid $120k; 27% above their basis — modest negotiation headroom, anchor on the comps not their cost.
Risks & watch-outs
- Climate carrying-cost: severe wind risk, 80% chance of damaging wind over 30y; extreme-heat days projected 7→18/yr by 2055 (HVAC capex compounding) — expect insurance premiums to compound above CPI over the hold.
Questions for the listing agent
- It's been on market 163 days. Have you received any prior offers? Is the seller open to a 12% concession, seller financing, or rate buy-down credit?
- Built in 1960 — when were the roof, HVAC, electrical panel, plumbing, and water heater last replaced?
- Why hasn't it sold? Are there any deal-killer items the seller is aware of (foundation, flood, title, zoning, code violations)?
- Is there a deadline driving the sale (1031 exchange, divorce, estate, relocation)? That informs how much negotiation room exists.
- Schools are F-rated, which usually means shorter tenancies and higher turnover. Who's the typical renter profile here, and what's been the actual vacancy rate?
- Crime grade is F in this area — have there been break-ins, vandalism, or insurance claims at this property in the last 3 years? What carrier currently insures it and at what premium?
- What's the average days-on-market for RENTAL listings here right now (not sales)? A rising rental-DOM trend means longer vacancies and softer asking-rent achievability than the comps imply.
- What's the recent tenant-quality profile in this submarket — average credit score on applications, eviction rate, late-payment / NSF rate, and stable-employment percentage? A property-management company in the area should have these aggregated.
- How much new for-sale + rental construction is in the pipeline within 1–3 miles? Heavy new supply typically softens prices + rents 12–24 months out; constrained supply supports both.
Investment metrics
- 1% rule
- 0.92% ✗
- Cap rate
- 7.01%
- Cash-on-cash
- 2.56%
- DSCR
- 1.11
- GRM
- 9.0
CMA / ARV
- ARV (median comp)
- $233,047
- List price
- $152,600
- Delta
- -34.52%
- Verdict
- UNDERPRICED
- Comps
- 20 within 1.0 mi
Show comp detail 10 sales within ~0.75 mi
| Address | Dist | Beds/Ba | Sqft | Sold | Price | $/sf | Match |
|---|---|---|---|---|---|---|---|
| 402 E 17th Ave | 0.64mi | 3/2.0 | 2,640 (+0%) | 4mo | $85,000 | $32 | 66 |
| 715 E 25th Ave | 0.31mi | 4/3.0 (+1) | 2,635 (0%) | 12mo | $280,000 | $106 | 66 |
| 1019 E 22nd Ave | 0.14mi | 3/3.0 | 2,331 (-12%) | 18mo | $280,000 | $120 | 55 |
| 908 E 27th Ave | 0.42mi | 3/2.0 | 2,847 (+8%) | 15mo | $290,000 | $102 | 54 |
| 1307 E 24th Ave | 0.41mi | 3/2.0 | 2,337 (-11%) | 12mo | $230,000 | $98 | 52 |
| 718 E 19th Ave | 0.25mi | 3/3.0 | 2,889 (+10%) | 23mo | $249,000 | $86 | 49 |
| 511 E 25th Ave | 0.47mi | 4/3.0 (+1) | 2,278 (-14%) | 0mo | $270,000 | $119 | 46 |
| 1402 E 24th Ave | 0.51mi | 4/3.0 (+1) | 2,255 (-14%) | 7mo | $120,000 | $53 | 38 |
| 705 E 31st Ave | 0.71mi | 3/2.0 | 2,238 (-15%) | 9mo | $250,000 | $112 | 35 |
| 515 E 18th Ave | 0.49mi | 3/1.0 | 2,244 (-15%) | 17mo | $149,900 | $67 | 34 |
Match score weights: distance 35% · size 25% · config 20% · recency 20%. Top-matched comps best support the ARV.
Projected returns pro-forma
-3.0% appreciation · 3.0% rent growth · sell at horizon
- IRR
- -12.2%
- Equity multiple
- 0.56×
- Total profit
- $-18,918
- Equity at exit
- $22,753
- IRR
- -3.1%
- Equity multiple
- 0.79×
- Total profit
- $-8,993
- Equity at exit
- $13,194
Cash invested: $42,728 (down + closing). Projections, not guarantees.
Landlord ↔ Tenant lean methodology
- Overall (STATE)
- 90 Strongly Landlord-Friendly
- State Georgia
- 90 Strongly Landlord-Friendly · R+3
- County
- — inherits STATE
- City
- — inherits STATE
ZIP-level market 31015
- Home prices YoY
- -24.1%
- Active inventory
- 166
- Price-to-rent
- 9.0×
Monthly cashflow live
- Estimated rent
- $1,406 medium interval (Pro) →
- Mortgage (P&I)
- −$800
- Tax from tax record
- −$156 /mo · $1,872/yr
- Insurance
- −$64
- HOA
- −$0
- Vacancy / Maint / Mgmt
- −$295
- Net cashflow
- $91
Break-even live
UW: 25.0% down · 7.5% · 30yr · 1.5% tax · 5.0% vac · 8.0% maint · 8.0% mgmt
Financing live
Cash to close
- Down payment
- $38,150
- Closing costs
- $4,578
- Reserves months
- —
- Total cash needed
- —
Loan-product check · same deal, 3 products live
Conventional
25% down · 7.5% · 30yr
- Down + closing
- —
- Monthly P&I
- —
- Monthly cashflow
- —
- DSCR
- —
- Eligible?
- —
Personal DTI + credit; lowest rate.
DSCR
20% down · 8.5% · 30yr
- Down + closing
- —
- Monthly P&I
- —
- Monthly cashflow
- —
- DSCR
- —
- Eligible?
- —
No personal income docs; deal must DSCR.
Hard money
10% down · 12.0% · 12mo
- Down + closing
- —
- Monthly P&I
- —
- Monthly cashflow
- —
- DSCR
- —
- Eligible?
- —
Short-term bridge; refi at stabilization.
Listing history 22 events
-
2026-06-18days on market $152,600 Active 163 DOM
-
2026-06-17days on market $152,600 Active 162 DOM
-
2026-06-16days on market $152,600 Active 161 DOM
-
2026-06-15days on market $152,600 Active 160 DOM
-
2026-06-13days on market $152,600 Active 158 DOM
-
2026-06-12days on market $152,600 Active 157 DOM
-
2026-06-09days on market $152,600 Active 154 DOM
-
2026-06-08days on market $152,600 Active 153 DOM
-
2026-06-07days on market $152,600 Active 152 DOM
-
2026-06-07days on market $152,600 Active 151 DOM
-
2026-06-04days on market $152,600 Active 148 DOM
-
2026-06-02days on market $152,600 Active 147 DOM
-
2026-06-01days on market $152,600 Active 146 DOM
-
2026-05-31days on market $152,600 Active 145 DOM
-
2026-05-31days on market $152,600 Active 144 DOM
-
2026-02-24price $152,600 232-char remark
Show marketing remark (232 chars)
ATTENTION all INVESTORS & RETRO LOVERS!!!! This contemporary home has so much potential and needs some TLC. It features a nice big open floorplan with 3 bedrooms and 2 full baths. Call today to tour this really unique home!!!
-
2026-01-06$155,600 Active 232-char remark
Show marketing remark (232 chars)
ATTENTION all INVESTORS & RETRO LOVERS!!!! This contemporary home has so much potential and needs some TLC. It features a nice big open floorplan with 3 bedrooms and 2 full baths. Call today to tour this really unique home!!!
-
2025-12-09historical
-
2025-11-12price $189,900
-
2025-11-12price $189,900
-
2025-10-29$219,000 New
-
2007-09-01soldstatus $120,000
ⓘ Source: listings_history table (triggers on properties + properties_extension) + one-shot
backfill from property_details.listing_events for pre-trigger history.
Tax reassessment forecast GA · Resets to sale price
- Current annual tax
- $1,872 · $156/mo
- Projected year-2 tax
- $1,872 · $156/mo
- Expected delta
- $0/yr ($0/mo · 0.0%)
ⓘ Screening estimate from a state-policy table — verify with the county assessor before closing.
Climate risk First Street
- Flood 1/10 Low FEMA zone X (unshaded) · 0% chance over 30 yrs
- Wildfire 4/10 Moderate
- Heat 7/10 Severe 7 d/yr ≥110°F today · 18 d/yr by 30 yrs out
- Wind 8/10 Severe 80% chance of damaging wind over 30 yrs
- Air quality 3/10 Moderate 2 unhealthy d/yr today · 3 by 30 yrs out
Nearby sold comps map
Loading sold comps map…
Walkable amenities ~0.75 mi
Loading nearby amenities…
Taxation est. · year 1
- Rental income
- $16,877
- − Mortgage interest
- −$8,548
- − Property taxes
- −$1,872
- − Insurance
- −$763
- − Repairs & maintenance
- −$1,350
- − Management
- −$1,350
- − Depreciation
- −$4,439
- Taxable loss
- −$1,446
- Est. tax savings @ 24.0%
- +$347
- After-tax cash flow
- $1,442/yr
For passive investors: Depreciation is non-cash, so a rental often shows a tax loss while cash-flowing — sheltering income. Rental losses are passive: they offset passive income freely, and up to $25,000/yr can offset ordinary (W-2) income if you actively participate and your MAGI is under $100k (phasing out to $0 by $150k); unused losses carry forward. On sale, claimed depreciation is recaptured at up to 25%, and gains may owe capital-gains tax (a 1031 exchange can defer both). Figures are a year-1 estimate at your 24.0% rate — not tax advice; consult a CPA.
Schools (NCES district)
- District
- Crisp County
- NCES district ID
- 1301560
- Math proficiency
- 20% ▼ -10.00%
- Reading proficiency
- 21% ▼ -7.00%
- Median HH income
- $32,681
- Composite
- 16.68/100
- National rank
- #9168
- State rank
- #143 of 174 in GA
Livability — Cordele
- Score
- 53/100
- State rank
- #556
- US rank
- #24483
Category grades
Schools grade is shown separately in the Schools card above.
Census & demographics
- Census place
- Cordele, GA
- Population (ZIP)
- 18,615
Population outlook (Crisp County) Hauer SSP2
- Today (2025)
- 21,484 people
- By 2030
- 20,594 · -4.1%
- By 2040
- 18,691 · -13.0%
- By 2050
- 16,769 · -21.9%
- By 2075
- 12,329 · -42.6%
- By 2100
- 8,591 · -60.0%
Race, ethnicity, and origin ACS 2023
- Neighborhood character
- Diverse neighborhood (Simpson 0.55)
- Race & ethnicity
- Black 48% White 47% Hispanic / Latino 3% Two or more races 2%
- Common ancestry
- Slovak 2% Italian 1% Serbian 1%
- Foreign-born
- 1% · Canada, China
- Languages at home
- 97% English-only · Spanish 2%
Political lean MEDSL · Crisp
- 2024 margin
- Strong R (+25.9) · D 36.9% · R 62.8%
- 2008→2024 swing
- -8.2pp toward R · 2008: -17.7pp · 2024: -25.9pp
- All cycles
- 2024: R+25.9 2020: R+24.9 2016: R+22.7 2012: R+13.8 2008: R+17.7
Not yet ingested
- Civics
- —
Market trends
- HPI YoY
- ▼ -57.99%
- Current HPI
- 182.3676
- Rent YoY
- —
- Metro
- —
- State GDP YoY
- ▲ 2.66%
- F500 in state
- 28
Industry mix (Fortune 500 HQ in GA)
| Industry | F500 HQs | Revenue |
|---|---|---|
| Paper / Packaging | 2 | $29B |
|
||
| Retail | 1 | $160B |
|
||
| Transportation / Logistics | 1 | $91B |
|
||
| Airlines | 1 | $62B |
|
||
| Consumer Goods | 1 | $47B |
|
||
| Utilities | 1 | $25B |
|
||
Price history
+27.2% since first listed7 events — show timeline
- 2026-02-24 Price Changed $152,600 CABOR
- 2026-01-06 Listed $155,600 CABOR
- 2025-12-09 Listing Removed — GAMLS
- 2025-11-12 Price Changed $189,900 CGMLS
- 2025-11-12 Price Changed $189,900 GAMLS
- 2025-10-29 Listed $219,000 GAMLS
- 2007-09-01 Sold (Public Records) $120,000 Public Records
Property tax history
+3.4%/yrLatest (2025): $1,872 · +8.7% YoY. Source: county tax records.
Cash-flow waterfall
monthlySold comps — $/sqft
last 12 mo · ≤1 miLoading sold comps…