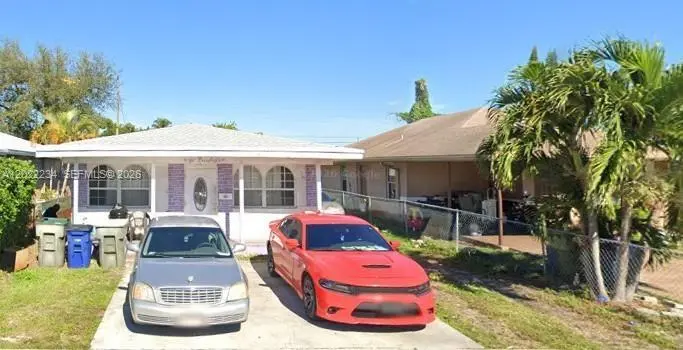
716 NW 4th St · Hallandale Beach, FL
Flood risk 3/10 · Minor
- FEMA flood zone
- X (unshaded)
- Chance of flooding over 30 yrs
- 0.09%
- Est. flood insurance / yr
- $507 – $1,088
Fire risk 1/10 · Minimal
- Est. fire insurance / yr
- $947 – $1,759
Heat risk 10/10 · Severe
- Hot days now (above 105°F)
- 7 days/yr
- Hot days in 30 yrs
- 26 days/yr
Wind risk 10/10 · Severe
- Chance of severe wind over 30 yrs
- 99.0%
Air-quality risk 2/10 · Minimal
- Unhealthy air days now
- 2 days/yr
- Unhealthy air days in 30 yrs
- 2 days/yr
Risk factors via First Street. Map © Google.
Why this score? — see what drove the C+ grade
The composite is a weighted blend of 9 inputs, each scored 0–100. Each bar is that input's sub-score; the figure is the points it added to the 100-point composite (weight × sub-score).
- Cash flow +21.3/30.0
- ARV discount +13.3/15.0
- DSCR +6.8/10.0
- 1% rule +5.6/10.0
- Schools +4.1/10.0
- Livability +4.0/5.0
- Rent growth +2.6/5.0
- Condition / age +2.5/5.0
- Appreciation +0.0/10.0
$380,000
🖨 Deal sheet (PDF) 📄 Offer letter ✓ Due diligence
Listing remarks
Owners Motivated - (no low ball offers), Vacant and being sold As-Is. Roof and Central A/C is 7 years new. Family has owned this cherished home for over 40 years! This single family home is an TOTAL 1,296 SQFT, Conveniently located very close to Schools, shopping, dinning, and I-95. Beach is less than 20 mins away. Ideal for buyers with a large family looking to create their dream home in a sought-after location or even First time homebuyers. Also, ideally situated, just minutes from Aventura Mall, this property offers exceptional value at this price point. HURRY, this home will not last, All qualified offers will be considered. Please present a pre-approval, DU/Eligible and proof of funds
Key facts
- Close to schools
- Close to dining
- Close to shopping
Tags
Property features AI
Finance
- HOA & community: Pets allowed with restrictions or conditions
Exterior
- Parking: Driveway; On-street parking
- Utilities: Public water; Public sewer
- Home design: Single-story; Faces south
- Construction: Block construction; Flat and tile roof; Effective year built
- Exterior features: No notable exterior features listed; Lot less than quarter acre
Interior
- Kitchen: Refrigerator
- Flooring: Ceramic tile
- Bathrooms: 2 full bathrooms
- Heating & cooling: Central heating (electric); Ceiling fans
- Interior features: Bedroom on main level; First-floor entry
- Laundry & utility: Community laundry facilities
Neighborhood map
What this means for you Summary
Snapshot
- This is a 4-bed/2.0-bath single-family listed at $380k.
Deal economics
- At list price, monthly cash flow is $555 ($7k/yr) — positive.
- The deal already cash-flows at list — no discount required.
- Meets the 1% rule at list price ($4k rent vs $380k).
- Cap rate 8.0% vs local median 5.2% in Hallandale Beach — top-decile yield for the area; either an underpriced asset or a hidden risk that comps aren't pricing in. Stress-test before assuming the spread holds.
Location & tenants
- Location reads 81/100 on livability (#86 in FL, #1,400 nationally) — a professional / high-income tenant draw. Strengths: commute A+, health & safety A+, crime B+; Watch: schools C-, employment D-.
- Broward (suburban): math 42% / reading 53% proficiency, ranked #46 of 73 in FL (top 63%) — families likely to look elsewhere, expect single-tenant / working-renter base with shorter leases.
- Market conditions: Rents flat; 1373 active listings in the ZIP; 39 comparable units currently listed for rent nearby; rentals at typical pace (median 21d on market — plan ~3-4 weeks tenant-placement turnaround); 2,111 units permitted in Broward County in 2024 (1,265 in 5+ unit buildings).
- At $4,027/mo this rent would consume 93% of the median local household income ($52k/yr) (locally 3293% of renters already pay >50% of income on rent) — very limited rent-growth headroom before tenants either downsize or default.
Forward outlook
- Local home prices are declining (-3.0%/yr); year-one equity from $3k of loan paydown is wiped out by about $11k of value loss. Plan a longer hold.
- Broward County population projected at +34% by 2050 — long-run rental-demand tailwind backs the buy-and-hold thesis.
Negotiation context
- Only 10 days on market — expect competitive offers; lowballing is unlikely to land.
- Current owner paid $34k; list at $380k implies a 1018% gain — meaningful room to come down on a strong offer.
Risks & watch-outs
- Watch-outs: built in 1955 — expect roof / HVAC / electrical / plumbing capex.
- Climate carrying-cost: severe wind risk, 99% chance of damaging wind over 30y; extreme-heat days projected 7→26/yr by 2055 (HVAC capex compounding) — expect insurance premiums to compound above CPI over the hold.
Questions for the listing agent
- Built in 1955 — when were the roof, HVAC, electrical panel, plumbing, and water heater last replaced?
- Is there a deadline driving the sale (1031 exchange, divorce, estate, relocation)? That informs how much negotiation room exists.
- What's the average days-on-market for RENTAL listings here right now (not sales)? A rising rental-DOM trend means longer vacancies and softer asking-rent achievability than the comps imply.
- What's the recent tenant-quality profile in this submarket — average credit score on applications, eviction rate, late-payment / NSF rate, and stable-employment percentage? A property-management company in the area should have these aggregated.
- How much new for-sale + rental construction is in the pipeline within 1–3 miles? Heavy new supply typically softens prices + rents 12–24 months out; constrained supply supports both.
Investment metrics
- 1% rule
- 1.06% ✓
- Cap rate
- 8.05%
- Cash-on-cash
- 6.26%
- DSCR
- 1.28
- GRM
- 7.9
CMA / ARV
- ARV (on-the-fly)
- $436,752
- Comps found
- 2
Show comp detail 2 sales within ~0.75 mi
| Address | Dist | Beds/Ba | Sqft | Sold | Price | $/sf | Match |
|---|---|---|---|---|---|---|---|
| 104 SW 7th Ave | 0.43mi | 3/2.0 (-1) | 1,328 (+2%) | 12mo | $440,000 | $331 | 61 |
| 617 SW 4th Ct | 0.73mi | 3/2.0 (-1) | 1,232 (-5%) | 19mo | $415,000 | $337 | 37 |
Match score weights: distance 35% · size 25% · config 20% · recency 20%. Top-matched comps best support the ARV.
Projected returns pro-forma
-3.0% appreciation · 0.43% rent growth · sell at horizon
- IRR
- -9.6%
- Equity multiple
- 0.66×
- Total profit
- $-36,327
- Equity at exit
- $56,659
- IRR
- -4.1%
- Equity multiple
- 0.76×
- Total profit
- $-25,447
- Equity at exit
- $32,855
Cash invested: $106,400 (down + closing). Projections, not guarantees.
Landlord ↔ Tenant lean methodology
- Overall (STATE)
- 87 Strongly Landlord-Friendly
- State Florida
- 87 Strongly Landlord-Friendly · R+3
- County
- — inherits STATE
- City
- — inherits STATE
ZIP-level market 33009
- Rents YoY
- 0.4%
- Active inventory
- 1373
- Price-to-rent
- 7.9×
Monthly cashflow live
- Estimated rent
- $4,027 high interval (Pro) →
- Mortgage (P&I)
- −$1,993
- Tax est. 1.5%
- −$475 /mo · $5,700/yr
- Insurance
- −$158
- HOA
- −$0
- Vacancy / Maint / Mgmt
- −$846
- Net cashflow
- $555
Break-even live
Sensitivity live
| Price | -10% $817 | -5% $686 | +0% $555 | +5% $424 | +10% $292 |
|---|---|---|---|---|---|
| Rent | -10% $237 | -5% $396 | +0% $555 | +5% $714 | +10% $873 |
| Rate | -1.0pp $746 | -0.5pp $652 | base $555 | +0.5pp $456 | +1.0pp $356 |
UW: 25.0% down · 7.5% · 30yr · 1.5% tax · 5.0% vac · 8.0% maint · 8.0% mgmt
Financing live
Cash to close
- Down payment
- $95,000
- Closing costs
- $11,400
- Reserves months
- —
- Total cash needed
- —
Loan-product check · same deal, 3 products live
Conventional
25% down · 7.5% · 30yr
- Down + closing
- —
- Monthly P&I
- —
- Monthly cashflow
- —
- DSCR
- —
- Eligible?
- —
Personal DTI + credit; lowest rate.
DSCR
20% down · 8.5% · 30yr
- Down + closing
- —
- Monthly P&I
- —
- Monthly cashflow
- —
- DSCR
- —
- Eligible?
- —
No personal income docs; deal must DSCR.
Hard money
10% down · 12.0% · 12mo
- Down + closing
- —
- Monthly P&I
- —
- Monthly cashflow
- —
- DSCR
- —
- Eligible?
- —
Short-term bridge; refi at stabilization.
Rent comps 39 comps
| Address | Beds | Baths | Sqft | Rent | $/sqft | DOM | Units | Dist |
|---|---|---|---|---|---|---|---|---|
| 852 NW 8th St #852 Hallandale Beach, FL | 3.0 | 2.0 | 1170 | $2,800 | $2.39 | 22d | 1 | 0.35mi |
| 841 NW 10th St Hallandale Beach, FL | 3.0 | 2.0 | 1485 | $3,100 | $2.09 | 8d | 1 | 0.44mi |
| 841 NW 10th St Unit 841C Hallandale Beach, FL | 3.0 | 2.0 | 1585 | $3,200 | $2.02 | 20d | 1 | 0.44mi |
| 421 W Pembroke Rd Hallandale Beach, FL | 4.0 | 2.0 | 1250 | $3,999 | $3.20 | 25d | 1 | 0.47mi |
| 208 NE 2nd Ave Hallandale Beach, FL | 4.0 | 2.0 | 1542 | $4,650 | $3.02 | 25d | 1 | 0.63mi |
| 220 SW 3rd Ave Hallandale Beach, FL | 4.0 | 2.0 | 1734 | $4,800 | $2.77 | 8d | 1 | 0.63mi |
| 220 SW 3rd Ave Hallandale Beach, FL | 4.0 | 2.0 | 1734 | $4,500 | $2.60 | 25d | 1 | 0.63mi |
| 1056 SW 2nd St Unit 1056 Hallandale Beach, FL | 3.0 | 2.0 | 1000 | $3,300 | $3.30 | 25d | 1 | 0.65mi |
| 113 SW 2nd St Hallandale Beach, FL | 5.0 | 2.0 | 1866 | $6,000 | $3.22 | 19d | 1 | 0.66mi |
| 212 SW 1st Ave Hallandale Beach, FL | 4.0 | 3.0 | 1800 | $10,000 | $5.56 | 25d | 1 | 0.69mi |
| 200 E Pembroke Rd Hallandale Beach, FL | 3.0 | 1.0–2.0 | 1006 | $4,120 | $4.10 | 2d | 62 | 0.76mi |
| 322 SW 11th Ave Hallandale Beach, FL | 3.0 | 1.0 | 1200 | $2,699 | $2.25 | 25d | 1 | 0.81mi |
| 1306 S 29th Ave Hollywood, FL | 3.0 | 2.0 | 1500 | $3,300 | $2.20 | 19d | 1 | 0.84mi |
| 401 N Federal Hwy Hallandale Beach, FL | 1.0–3.0 | 1.0–2.0 | 973 | $3,638 | $3.74 | 15d | 48 | 0.85mi |
| 644 SW 7th Ct Hallandale Beach, FL | 3.0 | 2.0 | 1492 | $3,800 | $2.55 | 3d | 1 | 0.85mi |
| 1120 S 28th Ave Hollywood, FL | 4.0 | 2.0 | 1576 | $4,275 | $2.71 | 2d | 1 | 0.86mi |
| 712 SW 7th Ter Hallandale Beach, FL | 4.0 | 3.0 | 1356 | $4,500 | $3.32 | 21d | 1 | 0.88mi |
| 211 SE 4th St #3 Hallandale Beach, FL | 3.0 | 2.5 | 1290 | $3,950 | $3.06 | 25d | 1 | 0.91mi |
| 2740 Dewey St Hollywood, FL | 3.0 | 1.0 | 1191 | $2,900 | $2.43 | 13d | 1 | 0.92mi |
| 707 SW 3rd Ave Hallandale Beach, FL | 3.0 | 2.0 | 1369 | $5,500 | $4.02 | 5d | 1 | 0.92mi |
| 215 SE 5th St Hallandale Beach, FL | 2.0–3.0 | 2.0 | 1133 | $3,675 | $3.24 | 25d | 5 | 0.97mi |
| 223 SW 10th St Hallandale Beach, FL | 3.0 | 3.0 | 1289 | $3,900 | $3.03 | 25d | 1 | 1.10mi |
| 906 NE 6th St Hallandale Beach, FL | 3.0 | 2.0 | 1080 | $4,250 | $3.94 | 5d | 1 | 1.11mi |
| 906 NE 6th St Hallandale Beach, FL | 3.0 | 2.0 | 1080 | $4,250 | $3.94 | 12d | 1 | 1.11mi |
| 906 NE 6th St Hallandale Beach, FL | 3.0 | 2.0 | 1080 | $4,250 | $3.94 | 25d | 1 | 1.11mi |
| 211 SE 9th St Hallandale Beach, FL | 4.0 | 3.0 | 1540 | $4,250 | $2.76 | 25d | 1 | 1.16mi |
| 1001 NE 10th St Unit 2 Hallandale Beach, FL | 3.0 | 2.0 | 1270 | $3,600 | $2.83 | 25d | 1 | 1.23mi |
| 1008 Moffett St Hallandale Beach, FL | 4.0 | 1.0 | 1500 | $5,000 | $3.33 | 25d | 1 | 1.25mi |
| 1124 NE 7th St Hallandale Beach, FL | 3.0 | 2.0 | 1320 | $3,900 | $2.95 | 22d | 1 | 1.28mi |
| 706 S 19th Ave Unit 706 Hollywood, FL | 3.0 | 2.0 | 1727 | $4,350 | $2.52 | 18d | 1 | 1.31mi |
| 706 S 19th Ave Hollywood, FL | 3.0 | 2.0 | 1727 | $3,950 | $2.29 | 8d | 1 | 1.31mi |
| 2911 Monroe St Hollywood, FL | 3.0 | 2.0 | 1645 | $5,200 | $3.16 | 25d | 1 | 1.32mi |
| 1527 Mayo St Hollywood, FL | 4.0 | 2.0 | 1462 | $4,995 | $3.42 | 15d | 1 | 1.35mi |
| 3720 SW 32nd Ave West Park, FL | 4.0 | 3.0 | 1100 | $3,850 | $3.50 | 25d | 1 | 1.42mi |
| 911 S Park Rd Hollywood, FL | 1.0–3.0 | 1.0–2.0 | 1123 | $2,919 | $2.60 | 2d | 24 | 1.43mi |
| 1422 Wiley St Hollywood, FL | 4.0 | 3.5 | 1746 | $3,990 | $2.29 | 25d | 1 | 1.47mi |
| 1422 Wiley St Hollywood, FL | 4.0 | 3.5 | 1746 | $3,990 | $2.29 | 5d | 1 | 1.47mi |
| 2165 Van Buren St Hollywood, FL | 3.0 | 1.0–3.0 | 1072 | $4,420 | $4.12 | 2d | 14 | 1.47mi |
| 1715 Jefferson St Hollywood, FL | 3.0 | 2.0 | 1479 | $4,200 | $2.84 | 22d | 1 | 1.48mi |
Listing history 11 events
-
2026-06-18days on market $380,000 Active 10 DOM
-
2026-06-17days on market $380,000 Active 9 DOM
-
2026-06-16days on market $380,000 Active 8 DOM
-
2026-06-15price $380,000 Active 7 DOM
-
2026-06-15remarks 699-char remark
-
2026-06-15days on market $400,000 Active 7 DOM
-
2026-06-13remarks 681-char remark
-
2026-06-13pricedays on market $400,000 Active 5 DOM
-
2026-06-10price $380,000 Active 1 DOM
-
2026-06-09remarks 640-char remark
-
2026-06-09$400,000 Active 1 DOM
ⓘ Source: listings_history table (triggers on properties + properties_extension) + one-shot
backfill from property_details.listing_events for pre-trigger history.
Climate risk First Street
- Flood 3/10 Moderate FEMA zone X (unshaded) · 9% chance over 30 yrs
- Wildfire 1/10 Low
- Heat 10/10 Extreme 7 d/yr ≥105°F today · 26 d/yr by 30 yrs out
- Wind 10/10 Extreme 99% chance of damaging wind over 30 yrs
- Air quality 2/10 Low 2 unhealthy d/yr today · 2 by 30 yrs out
Nearby sold comps map
Loading sold comps map…
Walkable amenities ~0.75 mi
Loading nearby amenities…
Taxation est. · year 1
- Rental income
- $48,318
- − Mortgage interest
- −$21,286
- − Property taxes
- −$5,700
- − Insurance
- −$1,900
- − Repairs & maintenance
- −$3,865
- − Management
- −$3,865
- − Depreciation
- −$11,055
- Taxable income
- $647
- Est. tax owed @ 24.0%
- −$155
- After-tax cash flow
- $6,503/yr
For passive investors: Depreciation is non-cash, so a rental often shows a tax loss while cash-flowing — sheltering income. Rental losses are passive: they offset passive income freely, and up to $25,000/yr can offset ordinary (W-2) income if you actively participate and your MAGI is under $100k (phasing out to $0 by $150k); unused losses carry forward. On sale, claimed depreciation is recaptured at up to 25%, and gains may owe capital-gains tax (a 1031 exchange can defer both). Figures are a year-1 estimate at your 24.0% rate — not tax advice; consult a CPA.
Schools (NCES district)
- District
- Broward
- NCES district ID
- 1200180
- Math proficiency
- 42% ▼ -18.00%
- Reading proficiency
- 53% ▼ -5.00%
- Median HH income
- $52,139
- Composite
- 40.88/100
- National rank
- #3621
- State rank
- #46 of 73 in FL
Livability — Hallandale Beach
- Score
- 81/100
- State rank
- #86
- US rank
- #1400
Category grades
Schools grade is shown separately in the Schools card above.
Census & demographics
- Census place
- Hallandale Beach, FL
- County
- Broward County · 1,963,430 people
- City population
- 44,021
- Metro
- Miami-Fort Lauderdale-Pompano Beach, FL
- Population (ZIP)
- 44,502
- Household income
- $52,079
- Rent vs Own
- Severe rent burden
- 3293.0
Population outlook (Broward County) Hauer SSP2
- Today (2025)
- 2,207,033 people
- By 2030
- 2,360,704 · +7.0%
- By 2040
- 2,661,208 · +20.6%
- By 2050
- 2,946,698 · +33.5%
- By 2075
- 3,602,273 · +63.2%
- By 2100
- 3,970,984 · +79.9%
Race, ethnicity, and origin ACS 2023
- Neighborhood character
- Diverse neighborhood (Simpson 0.67)
- Race & ethnicity
- Hispanic / Latino 39% White 39% Two or more races 24% Black 17% Asian 1%
- Hispanic origin (detail)
- Mexican 2% Puerto Rican 3% Cuban 9% Dominican 3% Salvadoran 2%
- Common ancestry
- Scotch-Irish 5% Hispanic 5% Subsaharan African 3%
- Foreign-born
- 51% · Canada, Jamaica, Dominican Republic
- Languages at home
- 38% English-only · Spanish 36% Russian/Polish/Slavic 12% French/Haitian/Cajun 7%
Political lean MEDSL · Broward
- 2024 margin
- D (+17.0) · D 58.0% · R 41.0%
- 2008→2024 swing
- -17.8pp toward R · 2008: 34.7pp · 2024: 17.0pp
- All cycles
- 2024: D+17.0 2020: D+29.8 2016: D+35.0 2012: D+34.9 2008: D+34.7
Not yet ingested
- Civics
- —
Market trends
- HPI YoY
- ▼ -299.13%
- Current HPI
- 329.9081
- Rent YoY
- ▲ 0.43%
- Metro
- Miami-Fort Lauderdale-Pompano Beach, FL
- State GDP YoY
- ▲ 3.28%
- F500 in state
- 36
Industry mix (Fortune 500 HQ in FL)
| Industry | F500 HQs | Revenue |
|---|---|---|
| Industrial Technology | 2 | $29B |
|
||
| Insurance | 2 | $17B |
|
||
| Retail | 1 | $60B |
|
||
| Technology Distribution | 1 | $58B |
|
||
| Homebuilding | 1 | $35B |
|
||
| Technology Manufacturing | 1 | $35B |
|
||
Price history
+1076.5% since first listed2 events — show timeline
- 2026-05-19 Listed $400,000 MARMLS
- 1980-09-01 Sold (Public Records) $34,000 Public Records
Property tax history
+0.6%/yrLatest (2025): $542 · +2.0% YoY. Source: county tax records.
Cash-flow waterfall
monthlySold comps — $/sqft
last 12 mo · ≤1 miLoading sold comps…