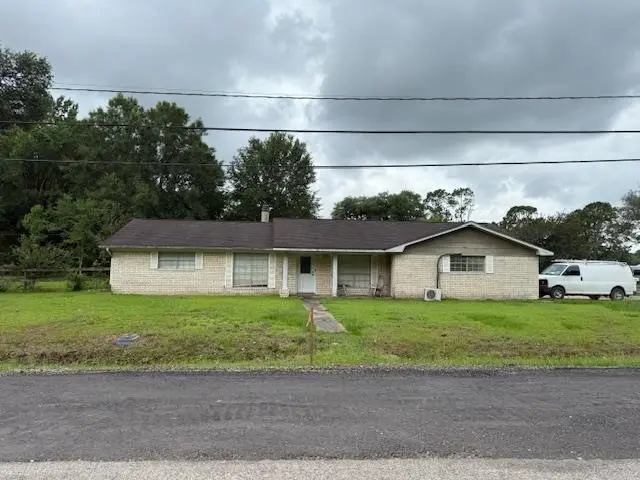
7590 San Diego St · Beaumont, TX
Flood risk 1/10 · Minimal
- FEMA flood zone
- X
- Chance of flooding over 30 yrs
- 0.0%
- Est. flood insurance / yr
- $507 – $1,088
Fire risk 2/10 · Minimal
- Est. fire insurance / yr
- $1,222 – $2,270
Heat risk 9/10 · Severe
- Hot days now (above 111°F)
- 7 days/yr
- Hot days in 30 yrs
- 23 days/yr
Wind risk 9/10 · Severe
- Chance of severe wind over 30 yrs
- 99.0%
Air-quality risk 2/10 · Minimal
- Unhealthy air days now
- 1 days/yr
- Unhealthy air days in 30 yrs
- 1 days/yr
Risk factors via First Street. Map © Google.
Why this score? — see what drove the C+ grade
The composite is a weighted blend of 9 inputs, each scored 0–100. Each bar is that input's sub-score; the figure is the points it added to the 100-point composite (weight × sub-score).
- Cash flow +23.2/30.0
- ARV discount +15.0/15.0
- DSCR +7.5/10.0
- 1% rule +6.2/10.0
- Livability +3.2/5.0
- Rent growth +2.5/5.0
- Condition / age +2.5/5.0
- Schools +1.5/10.0
- Appreciation +0.0/10.0
$225,500
🖨 Deal sheet 📄 Offer letter ✓ Due diligence
Listing remarks MLS
Well maintained and updated home near Griffing Park in Beaumont, TX. Large 3 or 4 Bedroom home with 2 full baths and a 2 car attached carport. 4th Bedroom can be an office or even a second living area with double doors. Fresh paint in and out as well as laminate wood & vinyl flooring throughout the home. Kitchen has been updated with new counter tops, updated cook top, dishwasher, and even a custom breakfast bar. Country charm throughout home with burnt pine trim as well as a large wood burning fireplace! All this plus large covered patio, storage building, and custom fence on a over sized corner lot. Country charm nestled in the city. Seller willing to assist with closing with a full price offer!!! Call today!
Key facts
- Additional back lot
- 2 parking spots
- Listed 12 days
Tags
Property features AI
Exterior
- Parking: Carport with 2 spaces
- Utilities: Public water; Public sewer
- Home design: Single-family residence; Residential property
- Construction: Slab foundation
- Exterior features: Covered patio/porch; Chain-link fencing; Storage structure
Interior
- Kitchen: Dishwasher; Oven
- Bathrooms: 2 full bathrooms
- Heating & cooling: Central heating (electric); Central air conditioning
- Interior features: Pantry; Wood-burning fireplace
Neighborhood map
What this means for you Summary
Snapshot
- This is a 3-bed/2.0-bath single-family listed at $226k.
Deal economics
- At list price, monthly cash flow is $410 ($5k/yr) — positive.
- The deal already cash-flows at list — no discount required.
- Meets the 1% rule at list price ($3k rent vs $226k).
- Cap rate 8.5% vs local median 5.3% in Beaumont — top-decile yield for the area; either an underpriced asset or a hidden risk that comps aren't pricing in. Stress-test before assuming the spread holds.
Location & tenants
- Location reads 64/100 on livability (#739 in TX) — a middle-class / working-renter tenant base. Strengths: cost of living A+, housing A+, health & safety A+; Watch: employment D, schools D-, crime F.
- Beaumont ISD (urban): math 14% / reading 22% proficiency, ranked #789 of 826 in TX (top 96%) — low school quality limits family demand, transient renter base, plan for 1-2y turnover; 69% free/reduced lunch — lower-income household profile, screen leases tightly.
- Market conditions: 70 active listings in the ZIP; 2 comparable units currently listed for rent nearby; 343 units permitted in Jefferson County in 2024 (0 in 5+ unit buildings).
Forward outlook
- Local home prices are declining (-3.0%/yr); year-one equity from $2k of loan paydown is wiped out by about $7k of value loss. Plan a longer hold.
Negotiation context
- Only 12 days on market — expect competitive offers; lowballing is unlikely to land.
- 2 sale attempts since 11y ago with the ask held roughly flat each time — persistent listings suggest the price (not the market) is what's stuck; bring a comps-based counter.
Risks & watch-outs
- Climate carrying-cost: severe wind risk, 99% chance of damaging wind over 30y; extreme-heat days projected 7→23/yr by 2055 (HVAC capex compounding) — expect insurance premiums to compound above CPI over the hold.
Questions for the listing agent
- Built in 1968 — when were the roof, HVAC, electrical panel, plumbing, and water heater last replaced?
- Is there a deadline driving the sale (1031 exchange, divorce, estate, relocation)? That informs how much negotiation room exists.
- Schools are D-rated, which usually means shorter tenancies and higher turnover. Who's the typical renter profile here, and what's been the actual vacancy rate?
- Crime grade is F in this area — have there been break-ins, vandalism, or insurance claims at this property in the last 3 years? What carrier currently insures it and at what premium?
- What's the average days-on-market for RENTAL listings here right now (not sales)? A rising rental-DOM trend means longer vacancies and softer asking-rent achievability than the comps imply.
- What's the recent tenant-quality profile in this submarket — average credit score on applications, eviction rate, late-payment / NSF rate, and stable-employment percentage? A property-management company in the area should have these aggregated.
- How much new for-sale + rental construction is in the pipeline within 1–3 miles? Heavy new supply typically softens prices + rents 12–24 months out; constrained supply supports both.
Investment metrics
- 1% rule
- 1.12% ✓
- Cap rate
- 8.48%
- Cash-on-cash
- 7.80%
- DSCR
- 1.35
- GRM
- 7.4
CMA / ARV
- ARV (on-the-fly)
- $350,448
- Comps found
- 9
Show comp detail 9 sales within ~0.75 mi
| Address | Dist | Beds/Ba | Sqft | Sold | Price | $/sf | Match |
|---|---|---|---|---|---|---|---|
| 7575 San Bruno St | 0.15mi | 4/3.0 (+1) | 2,600 (+9%) | 2mo | $419,000 | $161 | 68 |
| 6690 Highpoint Ave | 0.56mi | 4/3.0 (+1) | 2,281 (-4%) | 2mo | $325,000 | $142 | 56 |
| 6605 Alexis St | 0.58mi | 4/3.0 (+1) | 2,173 (-9%) | 10mo | $328,496 | $151 | 41 |
| 6804 Broadleaf Dr | 0.41mi | 4/2.0 (+1) | 2,150 (-10%) | 24mo | $370,000 | $172 | 40 |
| 6540 Durango Dr | 0.73mi | 3/2.5 | 2,529 (+6%) | 19mo | $314,000 | $124 | 38 |
| 6545 Alexis St | 0.65mi | 4/3.0 (+1) | 2,173 (-9%) | 10mo | $318,995 | $147 | 38 |
| 6615 Alexis St | 0.56mi | 4/2.0 (+1) | 2,031 (-15%) | 16mo | $313,325 | $154 | 31 |
| 6595 Alexis St | 0.59mi | 4/2.0 (+1) | 2,031 (-15%) | 16mo | $298,990 | $147 | 29 |
| 6555 Alexis St | 0.64mi | 4/2.0 (+1) | 2,031 (-15%) | 15mo | $297,990 | $147 | 28 |
Match score weights: distance 35% · size 25% · config 20% · recency 20%. Top-matched comps best support the ARV.
Projected returns pro-forma
-3.0% appreciation · 3.0% rent growth · sell at horizon
- IRR
- -4.4%
- Equity multiple
- 0.84×
- Total profit
- $-10,356
- Equity at exit
- $33,623
- IRR
- 5.3%
- Equity multiple
- 1.39×
- Total profit
- $24,857
- Equity at exit
- $19,497
Cash invested: $63,140 (down + closing). Projections, not guarantees.
Landlord ↔ Tenant lean methodology
- Overall (STATE)
- 87 Strongly Landlord-Friendly
- State Texas
- 87 Strongly Landlord-Friendly · R+5
- County
- — inherits STATE
- City
- — inherits STATE
ZIP-level market 77708
- Active inventory
- 70
- Price-to-rent
- 7.4×
Monthly cashflow live
- Estimated rent
- $2,531 medium interval (Pro) →
- Mortgage (P&I)
- −$1,183
- Tax from tax record
- −$313 /mo · $3,753/yr
- Insurance
- −$94
- HOA
- −$0
- Vacancy / Maint / Mgmt
- −$532
- Net cashflow
- $410
Break-even live
UW: 25.0% down · 7.5% · 30yr · 1.5% tax · 5.0% vac · 8.0% maint · 8.0% mgmt
Financing live
Cash to close
- Down payment
- $56,375
- Closing costs
- $6,765
- Reserves months
- —
- Total cash needed
- —
Loan-product check · same deal, 3 products live
Conventional
25% down · 7.5% · 30yr
- Down + closing
- —
- Monthly P&I
- —
- Monthly cashflow
- —
- DSCR
- —
- Eligible?
- —
Personal DTI + credit; lowest rate.
DSCR
20% down · 8.5% · 30yr
- Down + closing
- —
- Monthly P&I
- —
- Monthly cashflow
- —
- DSCR
- —
- Eligible?
- —
No personal income docs; deal must DSCR.
Hard money
10% down · 12.0% · 12mo
- Down + closing
- —
- Monthly P&I
- —
- Monthly cashflow
- —
- DSCR
- —
- Eligible?
- —
Short-term bridge; refi at stabilization.
Rent comps 2 comps
| Address | Beds | Baths | Sqft | Rent | $/sqft | DOM | Units | Dist |
|---|---|---|---|---|---|---|---|---|
| 6715 Riplee St Beaumont, TX | 4.0 | 2.0 | 1817 | $2,550 | $1.40 | 21d | 1 | 0.71mi |
| 6970 Ellen Ln Beaumont, TX | 3.0 | 2.5 | 1867 | $2,500 | $1.34 | 13d | 1 | 1.19mi |
Listing history 10 events
-
2026-06-18days on market $225,500 Active 12 DOM
-
2026-06-17days on market $225,500 Active 11 DOM
-
2026-06-16days on market $225,500 Active 10 DOM
-
2026-06-15days on market $225,500 Active 9 DOM
-
2026-06-14days on market $225,500 Active 7 DOM
-
2026-06-13days on market $225,500 Active 6 DOM
-
2026-06-10days on market $225,500 Active 4 DOM
-
2026-06-09days on market $225,500 Active 3 DOM
-
2026-06-09remarks 669-char remark
-
2026-06-09$225,500 Active 2 DOM
ⓘ Source: listings_history table (triggers on properties + properties_extension) + one-shot
backfill from property_details.listing_events for pre-trigger history.
Tax reassessment forecast TX · Resets to sale price
- Current annual tax
- $3,753 · $313/mo
- Projected year-2 tax
- $4,127 · $344/mo
- Expected delta
- +$373/yr (+$31/mo · 9.9%)
ⓘ Screening estimate from a state-policy table — verify with the county assessor before closing.
Climate risk First Street
- Flood 1/10 Low FEMA zone X · 0% chance over 30 yrs
- Wildfire 2/10 Low
- Heat 9/10 Extreme 7 d/yr ≥111°F today · 23 d/yr by 30 yrs out
- Wind 9/10 Extreme 99% chance of damaging wind over 30 yrs
- Air quality 2/10 Low 1 unhealthy d/yr today · 1 by 30 yrs out
Nearby sold comps map
Loading sold comps map…
Walkable amenities ~0.75 mi
Loading nearby amenities…
Taxation est. · year 1
- Rental income
- $30,372
- − Mortgage interest
- −$12,632
- − Property taxes
- −$3,753
- − Insurance
- −$1,128
- − Repairs & maintenance
- −$2,430
- − Management
- −$2,430
- − Depreciation
- −$6,560
- Taxable income
- $1,440
- Est. tax owed @ 24.0%
- −$346
- After-tax cash flow
- $4,577/yr
For passive investors: Depreciation is non-cash, so a rental often shows a tax loss while cash-flowing — sheltering income. Rental losses are passive: they offset passive income freely, and up to $25,000/yr can offset ordinary (W-2) income if you actively participate and your MAGI is under $100k (phasing out to $0 by $150k); unused losses carry forward. On sale, claimed depreciation is recaptured at up to 25%, and gains may owe capital-gains tax (a 1031 exchange can defer both). Figures are a year-1 estimate at your 24.0% rate — not tax advice; consult a CPA.
Schools (NCES district)
- District
- Beaumont ISD
- NCES district ID
- 4809670
- Math proficiency
- 14% ▼ -13.00%
- Reading proficiency
- 22% ▼ -7.00%
- Median HH income
- $41,683
- Composite
- 15.43/100
- National rank
- #9316
- State rank
- #789 of 826 in TX
Livability — Beaumont
- Score
- 64/100
- State rank
- #739
- US rank
- #13710
Category grades
Schools grade is shown separately in the Schools card above.
Census & demographics
- Census place
- Beaumont, TX
- City population
- 125,901
- Population (ZIP)
- 12,398
Population outlook (Jefferson County) Hauer SSP2
- Today (2025)
- 259,015 people
- By 2030
- 260,685 · +0.6%
- By 2040
- 263,309 · +1.7%
- By 2050
- 265,237 · +2.4%
- By 2075
- 270,193 · +4.3%
- By 2100
- 255,628 · -1.3%
Race, ethnicity, and origin ACS 2023
- Neighborhood character
- Majority Black (65%)
- Race & ethnicity
- Black 65% White 23% Hispanic / Latino 9% Two or more races 6% Asian 2%
- Hispanic origin (detail)
- Mexican 8%
- Common ancestry
- Lithuanian 1% Serbian 1% Slovak 1%
- Foreign-born
- 5% · Canada, Vietnam
- Languages at home
- 92% English-only · Spanish 6% Tagalog/Filipino 1% Vietnamese 1%
Political lean MEDSL · Jefferson
- 2024 margin
- Lean R (+8.9) · D 45.1% · R 54.0%
- 2008→2024 swing
- -11.1pp toward R · 2008: 2.2pp · 2024: -8.9pp
- All cycles
- 2024: R+8.9 2020: R+1.6 2016: R+0.5 2012: D+1.6 2008: D+2.2
Not yet ingested
- Civics
- —
Market trends
- HPI YoY
- ▼ -107.07%
- Current HPI
- 171.4951
- Rent YoY
- —
- Metro
- —
- State GDP YoY
- ▲ 3.95%
- F500 in state
- 110
Industry mix (Fortune 500 HQ in TX)
| Industry | F500 HQs | Revenue |
|---|---|---|
| Energy | 16 | $1,198B |
|
||
| Technology | 5 | $198B |
|
||
| Engineering / Construction | 4 | $72B |
|
||
| Energy Services | 3 | $60B |
|
||
| Utilities | 3 | $41B |
|
||
| Healthcare | 2 | $330B |
|
||
Price history
+80.5% since first listed3 events — show timeline
- 2026-06-06 Listed $225,500 BBOR
- 2015-09-14 Sold (MLS) — BBOR
- 2015-08-07 Listed $124,900 BBOR
Property tax history
+5.4%/yrLatest (2025): $3,753 · +28.8% YoY. Source: county tax records.
Cash-flow waterfall
monthlySold comps — $/sqft
last 12 mo · ≤1 miLoading sold comps…