 Duplex
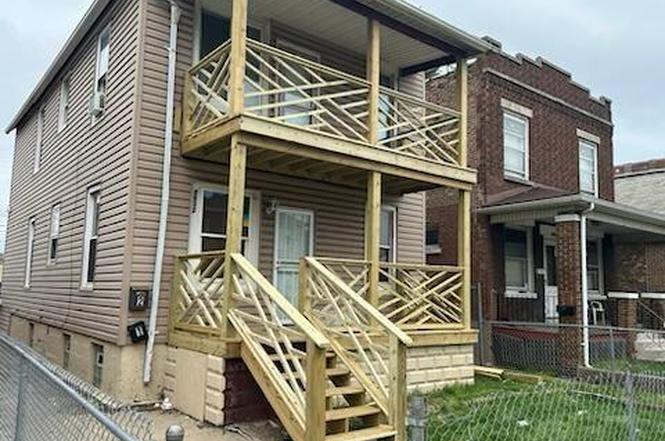
3932 Pulaski St · East Chicago, IN
Flood risk 4/10 · Minor
- FEMA flood zone
- X (unshaded)
- Chance of flooding over 30 yrs
- 0.2%
- Est. flood insurance / yr
- $473 – $860
Fire risk 1/10 · Minimal
- Est. fire insurance / yr
- $717 – $1,331
Heat risk 3/10 · Minor
- Hot days now (above 101°F)
- 7 days/yr
- Hot days in 30 yrs
- 15 days/yr
Wind risk 2/10 · Minimal
- Chance of severe wind over 30 yrs
- 1.0%
Air-quality risk 4/10 · Minor
- Unhealthy air days now
- 5 days/yr
- Unhealthy air days in 30 yrs
- 6 days/yr
Risk factors via First Street. Map © Google.
Why this score? — see what drove the C- grade
The composite is a weighted blend of 9 inputs, each scored 0–100. Each bar is that input's sub-score; the figure is the points it added to the 100-point composite (weight × sub-score).
- Cash flow +20.1/30.0
- ARV discount +7.5/15.0
- DSCR +6.4/10.0
- 1% rule +5.0/10.0
- Appreciation +4.8/10.0
- Rent growth +4.5/5.0
- Livability +3.2/5.0
- Condition / age +2.5/5.0
- Schools +0.8/10.0
$215,000
🖨 Deal sheet 📄 Offer letter ✓ Due diligence
Multi-family units
County records classify this as Multi-Family (2-4 Unit). Listing-text estimate: 2 units. confirmed
Listing remarks
Great Residential Income Opportunity!! Welcome to 3932 Pulaski St, East Chicago, IN - a well-maintained 2-unit multifamily/duplex offering a total of 6 bedrooms, 2 bathrooms, and 1,000 sq ft of living space. Perfect for investors or owner-occupants, this property gives you the flexibility to live in one unit while renting the other, or rent both for maximum income potential. Recent updates (2022) included new flooring, fresh paint, updated kitchens and bathrooms, new windows and doors, PEX water lines, new furnace for the upstairs unit, and a new water heater - making this property move-in ready for tenants. Both units also feature laundry hookups, and the basement has been freshly painted
Key facts
- Fresh paint
- New doors
- New flooring
Tags
Property features AI
Exterior
- Parking: Off-street parking; Other parking features
- Utilities: Public water; Public sewer
- Home design: Two-story property; Built in 1918
- Construction: Asphalt roof
- Exterior features: Neighborhood view; Deck, porch, and patio; Balcony
Interior
- Kitchen: No appliances specified; Other appliances noted
- Bedrooms: Two-unit building (number of units: 2)
- Bathrooms: 2 full bathrooms
- Heating & cooling: Hot water heating; No cooling system
- Interior features: Pets allowed (contact for details); Other interior features
- Laundry & utility: Finished basement (utility space available)
Neighborhood map
What this means for you Summary
Snapshot
- This is a 2 × 3-bed/1.0-bath units multifamily listed at $215k.
Deal economics
- At list price, monthly cash flow is $269 ($3k/yr) — positive. Per door: $135/mo.
- The deal already cash-flows at list — no discount required.
- To meet the 1% rule (rent ≥ 1% of price), the offer needs to be $215k (0.1% below list).
- Recommended offer: $189k (12.0% below list) — sets the bar for market timing.
Location & tenants
- Location reads 64/100 on livability (#371 in IN) — a middle-class / working-renter tenant base. Strengths: commute A+, cost of living A+, housing A; Watch: health & safety D+, crime F, amenities F.
- School City Of East Chicago (suburban): math 7% / reading 15% proficiency, ranked #293 of 301 in IN (top 97%) — low school quality limits family demand, transient renter base, plan for 1-2y turnover; 89% free/reduced lunch — lower-income household profile, screen leases tightly.
- Zoned schools: East Chicago Central High School (math 23% / reading 56%, grade F, #221 of 369 statewide, top 63%, 1,079 students, 77% FRL).
- Zoned-school proficiency averages 40% at this address vs 11% district-wide (+28 pts) — the actual schools serving this property are materially stronger than the School City Of East Chicago average implies; a family-tenant draw the district grade alone would hide.
- Market conditions: Rents rising fast (+8.1%/yr); 79 active listings in the ZIP; lower-income renter base — watch delinquency; 1,642 units permitted in Lake County in 2024 (14 in 5+ unit buildings).
- At $2,147/mo this rent would consume 61% of the median local household income ($42k/yr) (locally 1227% of renters already pay >50% of income on rent) — very limited rent-growth headroom before tenants either downsize or default.
Forward outlook
- In year one you build about $833 of equity ($1k loan paydown + $-653 appreciation (-0.3% local appreciation)).
- Lake County population projected to shrink 7% by 2050 — rents likely to lag national; underwrite the cash flow, not the appreciation.
- At projected returns (-0.3% appreciation + 8.0% rent growth), your $60k cash investment doubles in ~7 years — after that, you're playing with house money.
Negotiation context
- It's been on market 121 days — a 12% lower offer ($189k) is reasonable based on typical stale-listing flexibility.
- 10 sale attempts since 24y ago; this cycle's ask has dropped $20k (9%) from the opening price — seller is motivated, your offer sets the floor, not the list.
- Current owner paid $160k; 34% above their basis — modest negotiation headroom, anchor on the comps not their cost.
Risks & watch-outs
- Watch-outs: built in 1918 — expect roof / HVAC / electrical / plumbing capex.
Questions for the listing agent
- It's been on market 121 days. Have you received any prior offers? Is the seller open to a 12% concession, seller financing, or rate buy-down credit?
- Can we see the unit-by-unit rent roll, current vacancy, and any below-market leases? What's the average tenancy length?
- What capital expenditures (roof, boiler, parking lot, exteriors) have been made in the last 5 years, and what's planned in the next 2?
- Built in 1918 — when were the roof, HVAC, electrical panel, plumbing, and water heater last replaced?
- Why hasn't it sold? Are there any deal-killer items the seller is aware of (foundation, flood, title, zoning, code violations)?
- Is there a deadline driving the sale (1031 exchange, divorce, estate, relocation)? That informs how much negotiation room exists.
- Schools are F-rated, which usually means shorter tenancies and higher turnover. Who's the typical renter profile here, and what's been the actual vacancy rate?
- Crime grade is F in this area — have there been break-ins, vandalism, or insurance claims at this property in the last 3 years? What carrier currently insures it and at what premium?
- What's the average days-on-market for RENTAL listings here right now (not sales)? A rising rental-DOM trend means longer vacancies and softer asking-rent achievability than the comps imply.
- What's the recent tenant-quality profile in this submarket — average credit score on applications, eviction rate, late-payment / NSF rate, and stable-employment percentage? A property-management company in the area should have these aggregated.
- How much new apartment / multifamily construction is in the pipeline within 1–3 miles? Heavy new supply (>2% of stock underway) typically softens rents 12–24 months out; light construction supports rent growth.
Investment metrics
- 1% rule
- 1.00% ✗
- Cap rate
- 7.80%
- Cash-on-cash
- 5.37%
- DSCR
- 1.24
- GRM
- 8.3
CMA / ARV
No comps found within radius.
Projected returns pro-forma
-0.3% appreciation · 8.0% rent growth · sell at horizon
- IRR
- 6.6%
- Equity multiple
- 1.32×
- Total profit
- $19,163
- Equity at exit
- $59,187
- IRR
- 15.5%
- Equity multiple
- 2.91×
- Total profit
- $115,216
- Equity at exit
- $68,606
Cash invested: $60,200 (down + closing). Projections, not guarantees.
Landlord ↔ Tenant lean methodology
- Overall (STATE)
- 90 Strongly Landlord-Friendly
- State Indiana
- 90 Strongly Landlord-Friendly · R+11
- County
- — inherits STATE
- City
- — inherits STATE
ZIP-level market 46312
- Home prices YoY
- -0.1%
- Rents YoY
- 8.1%
- Active inventory
- 79
- Price-to-rent
- 16.7×
Monthly cashflow live
- Estimated rent
- $2,147 medium interval (Pro) →
- Mortgage (P&I)
- −$1,127
- Tax from tax record
- −$210 /mo · $2,516/yr
- Insurance
- −$90
- HOA
- −$0
- Vacancy / Maint / Mgmt
- −$451
- Net cashflow
- $269
Break-even live
2-unit breakdown (identical units grouped — click to expand)
| Units | Beds | Baths | Est. rent |
|---|---|---|---|
| 2× units | 3 | 1 | $2,148 |
| #1 | 3 | 1 | $1,074 |
| #2 | 3 | 1 | $1,074 |
| Total (2 units) | $2,147 | ||
UW: 25.0% down · 7.5% · 30yr · 1.5% tax · 5.0% vac · 8.0% maint · 8.0% mgmt
Financing live
Cash to close
- Down payment
- $53,750
- Closing costs
- $6,450
- Reserves months
- —
- Total cash needed
- —
Loan-product check · same deal, 3 products live
Conventional
25% down · 7.5% · 30yr
- Down + closing
- —
- Monthly P&I
- —
- Monthly cashflow
- —
- DSCR
- —
- Eligible?
- —
Personal DTI + credit; lowest rate.
DSCR
20% down · 8.5% · 30yr
- Down + closing
- —
- Monthly P&I
- —
- Monthly cashflow
- —
- DSCR
- —
- Eligible?
- —
No personal income docs; deal must DSCR.
Hard money
10% down · 12.0% · 12mo
- Down + closing
- —
- Monthly P&I
- —
- Monthly cashflow
- —
- DSCR
- —
- Eligible?
- —
Short-term bridge; refi at stabilization.
Listing history 25 events
-
2026-05-07status Pending
-
2026-04-29price $215,000
-
2026-02-24price $225,000
-
2026-02-10price $230,000
-
2026-01-05$235,000 Active
-
2025-12-08historical
-
2025-09-24historical
-
2025-09-23$235,000 Active
-
2025-09-22$235,000 Active
-
2022-12-28soldstatus $160,000 Closed
-
2022-11-15historical Active Under Contract
-
2022-11-05$169,900 Active
-
2022-10-01historical
-
2022-09-26status Deal Fell Through
-
2022-09-08status Pending
-
2022-09-05historical Active Under Contract
-
2022-08-24status Active
-
2022-08-24historical
-
2022-08-23status Active
-
2022-08-23historical
-
2022-08-23price $189,999
-
2022-07-25$199,900 Active
-
2021-07-01historical
-
2020-12-31$175,000
-
2002-05-28$39,900
ⓘ Source: listings_history table (triggers on properties + properties_extension) + one-shot
backfill from property_details.listing_events for pre-trigger history.
Tax reassessment forecast IN · Partial reset (capped growth)
- Current annual tax
- $2,516 · $210/mo
- Projected year-2 tax
- $2,516 · $210/mo
- Expected delta
- $0/yr ($0/mo · 0.0%)
ⓘ Screening estimate from a state-policy table — verify with the county assessor before closing.
Climate risk First Street
- Flood 4/10 Moderate FEMA zone X (unshaded) · 20% chance over 30 yrs
- Wildfire 1/10 Low
- Heat 3/10 Moderate 7 d/yr ≥101°F today · 15 d/yr by 30 yrs out
- Wind 2/10 Low 100% chance of damaging wind over 30 yrs
- Air quality 4/10 Moderate 5 unhealthy d/yr today · 6 by 30 yrs out
Nearby sold comps map
Loading sold comps map…
Walkable amenities ~0.75 mi
Loading nearby amenities…
Taxation est. · year 1
- Rental income
- $25,764
- − Mortgage interest
- −$12,043
- − Property taxes
- −$2,516
- − Insurance
- −$1,075
- − Repairs & maintenance
- −$2,061
- − Management
- −$2,061
- − Depreciation
- −$6,255
- Taxable loss
- −$247
- Est. tax savings @ 24.0%
- +$59
- After-tax cash flow
- $3,292/yr
For passive investors: Depreciation is non-cash, so a rental often shows a tax loss while cash-flowing — sheltering income. Rental losses are passive: they offset passive income freely, and up to $25,000/yr can offset ordinary (W-2) income if you actively participate and your MAGI is under $100k (phasing out to $0 by $150k); unused losses carry forward. On sale, claimed depreciation is recaptured at up to 25%, and gains may owe capital-gains tax (a 1031 exchange can defer both). Figures are a year-1 estimate at your 24.0% rate — not tax advice; consult a CPA.
Schools (NCES district)
- District
- School City Of East Chicago
- NCES district ID
- 1802880
- Math proficiency
- 7% ▼ -10.00%
- Reading proficiency
- 15% ▼ -7.00%
- Median HH income
- $28,423
- Composite
- 8.36/100
- National rank
- #9909
- State rank
- #293 of 301 in IN
Livability — East Chicago
- Score
- 64/100
- State rank
- #371
- US rank
- #13869
Category grades
Schools grade is shown separately in the Schools card above.
Census & demographics
- Census place
- East Chicago, IN
- County
- Lake County · 422,878 people
- City population
- 26,022
- Metro
- Chicago-Naperville-Elgin, IL-IN-WI
- Population (ZIP)
- 26,022
- Household income
- $42,125
- Rent vs Own
- Severe rent burden
- 1227.0
Population outlook (Lake County) Hauer SSP2
- Today (2025)
- 484,026 people
- By 2030
- 478,091 · -1.2%
- By 2040
- 462,974 · -4.3%
- By 2050
- 449,894 · -7.1%
- By 2075
- 436,169 · -9.9%
- By 2100
- 426,607 · -11.9%
Race, ethnicity, and origin ACS 2023
- Neighborhood character
- Majority Hispanic (56%)
- Race & ethnicity
- Hispanic / Latino 56% Black 36% Two or more races 11% White 7%
- Hispanic origin (detail)
- Mexican 45% Puerto Rican 6%
- Common ancestry
- Romanian 2%
- Foreign-born
- 16% · Canada
- Languages at home
- 59% English-only · Spanish 40%
Political lean MEDSL · Lake
- 2024 margin
- Lean D (+5.6) · D 52.1% · R 46.5% · Other 1.5%
- 2008→2024 swing
- -28.6pp toward R · 2008: 34.3pp · 2024: 5.6pp
- All cycles
- 2024: D+5.6 2020: D+15.1 2016: D+20.6 2012: D+31.0 2008: D+34.3
Not yet ingested
- Civics
- —
Market trends
- HPI YoY
- ▼ -0.30%
- Current HPI
- 267.9232
- Rent YoY
- ▲ 8.06%
- Metro
- Chicago-Naperville-Elgin, IL-IN-WI
- State GDP YoY
- ▲ 2.90%
- F500 in state
- 18
Industry mix (Fortune 500 HQ in IN)
| Industry | F500 HQs | Revenue |
|---|---|---|
| Industrial Machinery | 2 | $37B |
|
||
| Healthcare | 1 | $177B |
|
||
| Pharmaceuticals | 1 | $45B |
|
||
| Metals / Steel | 1 | $18B |
|
||
| Agriculture | 1 | $17B |
|
||
| Packaging | 1 | $12B |
|
||
Price history
+438.8% since first listed25 events — show timeline
- 2026-05-07 Pending — NIRA MLS as Distributed by MLS Grid
- 2026-04-29 Price Changed $215,000 NIRA MLS as Distributed by MLS Grid
- 2026-02-24 Price Changed $225,000 NIRA MLS as Distributed by MLS Grid
- 2026-02-10 Price Changed $230,000 NIRA MLS as Distributed by MLS Grid
- 2026-01-05 Listed $235,000 NIRA MLS as Distributed by MLS Grid
- 2025-12-08 Listing Removed — NIRA MLS as Distributed by MLS Grid
- 2025-09-24 Listing Removed — NIRA MLS as Distributed by MLS Grid
- 2025-09-23 Listed $235,000 NIRA MLS as Distributed by MLS Grid
- 2025-09-22 Listed $235,000 NIRA MLS as Distributed by MLS Grid
- 2022-12-28 Sold (MLS) $160,000 NIRA MLS as Distributed by MLS Grid
- 2022-11-15 Contingent — NIRA MLS as Distributed by MLS Grid
- 2022-11-05 Listed $169,900 NIRA MLS as Distributed by MLS Grid
- 2022-10-01 Listing Removed — NIRA MLS as Distributed by MLS Grid
- 2022-09-26 Relisted — NIRA MLS as Distributed by MLS Grid
- 2022-09-08 Pending — NIRA MLS as Distributed by MLS Grid
- 2022-09-05 Contingent — NIRA MLS as Distributed by MLS Grid
- 2022-08-24 Relisted — NIRA MLS as Distributed by MLS Grid
- 2022-08-24 Listing Removed — NIRA MLS as Distributed by MLS Grid
- 2022-08-23 Relisted — NIRA MLS as Distributed by MLS Grid
- 2022-08-23 Listing Removed — NIRA MLS as Distributed by MLS Grid
- 2022-08-23 Price Changed $189,999 NIRA MLS as Distributed by MLS Grid
- 2022-07-25 Listed $199,900 NIRA MLS as Distributed by MLS Grid
- 2021-07-01 Listing Removed — NIRA MLS as Distributed by MLS Grid
- 2020-12-31 Listed $175,000 NIRA MLS as Distributed by MLS Grid
- 2002-05-28 Listed $39,900 NIRA MLS as Distributed by MLS Grid
Property tax history
+5.8%/yrLatest (2024): $2,516 · +10.4% YoY. Source: county tax records.
Cash-flow waterfall
monthlySold comps — $/sqft
last 12 mo · ≤1 miLoading sold comps…