140 Ryan Ave · Boyce, LA
Flood risk 5/10 · Moderate
- FEMA flood zone
- X (shaded)
- Chance of flooding over 30 yrs
- 0.24%
- Est. flood insurance / yr
- $507 – $1,088
Fire risk 2/10 · Minimal
- Est. fire insurance / yr
- $1,269 – $2,357
Heat risk 8/10 · Major
- Hot days now (above 110°F)
- 7 days/yr
- Hot days in 30 yrs
- 20 days/yr
Wind risk 8/10 · Major
- Chance of severe wind over 30 yrs
- 98.0%
Air-quality risk 1/10 · Minimal
- Unhealthy air days now
- 0 days/yr
- Unhealthy air days in 30 yrs
- 0 days/yr
Risk factors via First Street. Map © Google.
Why this score? — see what drove the C- grade
The composite is a weighted blend of 9 inputs, each scored 0–100. Each bar is that input's sub-score; the figure is the points it added to the 100-point composite (weight × sub-score).
- Cash flow +17.4/30.0
- ARV discount +14.0/15.0
- DSCR +5.4/10.0
- 1% rule +4.6/10.0
- Condition / age +3.8/5.0
- Schools +3.1/10.0
- Livability +2.8/5.0
- Rent growth +2.5/5.0
- Appreciation +0.0/10.0
$127,000
🖨 Deal sheet 📄 Offer letter ✓ Due diligence
Listing remarks
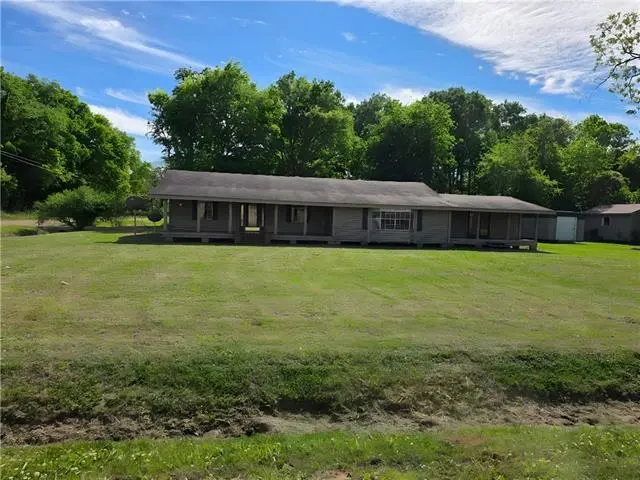
Frame on pier and beam dwelling located on a corner lot on the outskirts of the town of Boyce. Nice back deck and front porch for morning coffee. .. Real Estate Agents please see agent remarks.
Key facts
- Front porch
- Back deck
- Corner lot
Tags
Property features AI
Exterior
- Parking: No designated parking
- Home design: Single-family residence
- Construction: Frame construction; Composition roof
- Exterior features: No fencing; Composition roof; Frame construction
Interior
- Bedrooms: Three bedrooms
- Bathrooms: Two full bathrooms
- Heating & cooling: Central heating; Central air conditioning
- Interior features: Living room; Bedroom 1; Bedroom 2; Bedroom 3; Wood-burning fireplace
Neighborhood map
What this means for you Summary
Snapshot
- This is a 3-bed/2.0-bath single-family listed at $127k. Condition is rated good.
Deal economics
- At list price, monthly cash flow is $95 ($1k/yr) — positive.
- The deal already cash-flows at list — no discount required.
- To meet the 1% rule (rent ≥ 1% of price), the offer needs to be $122k (3.9% below list).
- Recommended offer: $122k (3.9% below list) — sets the bar for 1% rule.
Location & tenants
- Location reads 56/100 on livability (#345 in LA) — a working-class tenant base; expect higher turnover. Strengths: cost of living A+; Watch: health & safety C-, schools F, amenities F.
- Rapides Parish (urban): math 29% / reading 44% proficiency, ranked #31 of 98 in LA (top 32%) — families likely to look elsewhere, expect single-tenant / working-renter base with shorter leases; 64% free/reduced lunch — lower-income household profile, screen leases tightly.
- Market conditions: 54 active listings in the ZIP; 239 units permitted in Rapides Parish in 2024 (0 in 5+ unit buildings).
Forward outlook
- Local home prices are declining (-3.0%/yr); year-one equity from $878 of loan paydown is wiped out by about $4k of value loss. Plan a longer hold.
- Rapides County population projected to shrink 6% by 2050 — rents likely to lag national; underwrite the cash flow, not the appreciation.
Negotiation context
- It's been on market 46 days — a 3% lower offer ($123k) is reasonable based on typical stale-listing flexibility.
- 2 sale attempts since 3y ago; this cycle's ask has dropped $10k (7%) from the opening price — seller is motivated, your offer sets the floor, not the list.
Risks & watch-outs
- Climate carrying-cost: moderate flood risk; severe wind risk, 98% chance of damaging wind over 30y; extreme-heat days projected 7→20/yr by 2055 (HVAC capex compounding) — expect insurance premiums to compound above CPI over the hold.
Questions for the listing agent
- It's been on market 46 days. Have you received any prior offers? Is the seller open to a 4% concession, seller financing, or rate buy-down credit?
- Is there a deadline driving the sale (1031 exchange, divorce, estate, relocation)? That informs how much negotiation room exists.
- Schools are F-rated, which usually means shorter tenancies and higher turnover. Who's the typical renter profile here, and what's been the actual vacancy rate?
- What's the average days-on-market for RENTAL listings here right now (not sales)? A rising rental-DOM trend means longer vacancies and softer asking-rent achievability than the comps imply.
- What's the recent tenant-quality profile in this submarket — average credit score on applications, eviction rate, late-payment / NSF rate, and stable-employment percentage? A property-management company in the area should have these aggregated.
- How much new for-sale + rental construction is in the pipeline within 1–3 miles? Heavy new supply typically softens prices + rents 12–24 months out; constrained supply supports both.
Investment metrics
- 1% rule
- 0.96% ✗
- Cap rate
- 7.19%
- Cash-on-cash
- 3.21%
- DSCR
- 1.14
- GRM
- 8.7
CMA / ARV
- ARV (median comp)
- $148,596
- List price
- $127,000
- Delta
- -14.53%
- Verdict
- UNDERPRICED
- Comps
- 2 within 1.0 mi
Show comp detail 1 sale within ~0.75 mi
| Address | Dist | Beds/Ba | Sqft | Sold | Price | $/sf | Match |
|---|---|---|---|---|---|---|---|
| 52 Bath House Rd | 0.42mi | 3/2.0 | 1,519 (-10%) | 19mo | $192,000 | $126 | 47 |
Match score weights: distance 35% · size 25% · config 20% · recency 20%. Top-matched comps best support the ARV.
Projected returns pro-forma
-3.0% appreciation · 3.0% rent growth · sell at horizon
- IRR
- -11.2%
- Equity multiple
- 0.59×
- Total profit
- $-14,512
- Equity at exit
- $18,936
- IRR
- -2.0%
- Equity multiple
- 0.87×
- Total profit
- $-4,787
- Equity at exit
- $10,981
Cash invested: $35,560 (down + closing). Projections, not guarantees.
Landlord ↔ Tenant lean methodology
- Overall (STATE)
- 90 Strongly Landlord-Friendly
- State Louisiana
- 90 Strongly Landlord-Friendly · R+12
- County
- — inherits STATE
- City
- — inherits STATE
ZIP-level market 71409
- Home prices YoY
- -19.6%
- Active inventory
- 54
- Price-to-rent
- 8.7×
Monthly cashflow live
- Estimated rent
- $1,221 medium interval (Pro) →
- Mortgage (P&I)
- −$666
- Tax from tax record
- −$150 /mo · $1,805/yr
- Insurance
- −$53
- HOA
- −$0
- Vacancy / Maint / Mgmt
- −$256
- Net cashflow
- $95
Break-even live
UW: 25.0% down · 7.5% · 30yr · 1.5% tax · 5.0% vac · 8.0% maint · 8.0% mgmt
Financing live
Cash to close
- Down payment
- $31,750
- Closing costs
- $3,810
- Reserves months
- —
- Total cash needed
- —
Loan-product check · same deal, 3 products live
Conventional
25% down · 7.5% · 30yr
- Down + closing
- —
- Monthly P&I
- —
- Monthly cashflow
- —
- DSCR
- —
- Eligible?
- —
Personal DTI + credit; lowest rate.
DSCR
20% down · 8.5% · 30yr
- Down + closing
- —
- Monthly P&I
- —
- Monthly cashflow
- —
- DSCR
- —
- Eligible?
- —
No personal income docs; deal must DSCR.
Hard money
10% down · 12.0% · 12mo
- Down + closing
- —
- Monthly P&I
- —
- Monthly cashflow
- —
- DSCR
- —
- Eligible?
- —
Short-term bridge; refi at stabilization.
Listing history 18 events
-
2026-06-19days on market $127,000 Active 46 DOM
-
2026-06-18days on market $127,000 Active 45 DOM
-
2026-06-17days on market $127,000 Active 44 DOM
-
2026-06-16days on market $127,000 Active 43 DOM
-
2026-06-15days on market $127,000 Active 42 DOM
-
2026-06-14days on market $127,000 Active 40 DOM
-
2026-06-13pricedays on market $127,000 Active 39 DOM
-
2026-06-10days on market $136,900 Active 37 DOM
-
2026-06-09days on market $136,900 Active 36 DOM
-
2026-06-08days on market $136,900 Active 35 DOM
-
2026-06-07days on market $136,900 Active 34 DOM
-
2026-06-03days on market $136,900 Active 30 DOM
-
2026-06-02days on market $136,900 Active 29 DOM
-
2026-06-01days on market $136,900 Active 28 DOM
-
2026-05-31days on market $136,900 Active 27 DOM
-
2026-05-30days on market $136,900 Active 26 DOM
-
2026-05-04$136,900 Active 192-char remark
-
2023-03-08$149,900
ⓘ Source: listings_history table (triggers on properties + properties_extension) + one-shot
backfill from property_details.listing_events for pre-trigger history.
Tax reassessment forecast LA · Resets to sale price
- Current annual tax
- $1,805 · $150/mo
- Projected year-2 tax
- $1,805 · $150/mo
- Expected delta
- $0/yr ($0/mo · 0.0%)
ⓘ Screening estimate from a state-policy table — verify with the county assessor before closing.
Climate risk First Street
- Flood 5/10 Major FEMA zone X (shaded) · 24% chance over 30 yrs
- Wildfire 2/10 Low
- Heat 8/10 Severe 7 d/yr ≥110°F today · 20 d/yr by 30 yrs out
- Wind 8/10 Severe 98% chance of damaging wind over 30 yrs
- Air quality 1/10 Low 0 unhealthy d/yr today · 0 by 30 yrs out
Nearby sold comps map
Loading sold comps map…
Walkable amenities ~0.75 mi
Loading nearby amenities…
Taxation est. · year 1
- Rental income
- $14,649
- − Mortgage interest
- −$7,114
- − Property taxes
- −$1,805
- − Insurance
- −$635
- − Repairs & maintenance
- −$1,172
- − Management
- −$1,172
- − Depreciation
- −$3,695
- Taxable loss
- −$943
- Est. tax savings @ 24.0%
- +$226
- After-tax cash flow
- $1,367/yr
For passive investors: Depreciation is non-cash, so a rental often shows a tax loss while cash-flowing — sheltering income. Rental losses are passive: they offset passive income freely, and up to $25,000/yr can offset ordinary (W-2) income if you actively participate and your MAGI is under $100k (phasing out to $0 by $150k); unused losses carry forward. On sale, claimed depreciation is recaptured at up to 25%, and gains may owe capital-gains tax (a 1031 exchange can defer both). Figures are a year-1 estimate at your 24.0% rate — not tax advice; consult a CPA.
Condition & rehab AI · 11 photos
This single-family home is in good condition with recent updates, including new flooring and paint. It is move-in ready and has a good curb appeal.
Value-add opportunities
- Both Painting the exterior and interior — Enhances curb appeal and interior aesthetics.
- Both Landscaping and curb appeal improvements — Improves the home's appearance and attracts potential buyers/tenants.
- Both New flooring in the kitchen and bathrooms — Enhances the home's functionality and appeal, making it more attractive to buyers and renters.
Renovation cost estimate screening
Value-add ROI direction
- Both Painting the exterior and interior — Enhances curb appeal and interior aesthetics. ↑
- Both Landscaping and curb appeal improvements — Improves the home's appearance and attracts potential buyers/tenants. ↑
- Both New flooring in the kitchen and bathrooms — Enhances the home's functionality and appeal, making it more attractive to buyers and renters. ↑
ⓘ Cost ranges are severity-bucket heuristics (US national rule-of-thumb). Get contractor quotes + a written scope before underwriting a rehab budget.
Schools (NCES district)
- District
- Rapides Parish
- NCES district ID
- 2201290
- Math proficiency
- 29% ▼ -34.00%
- Reading proficiency
- 44% ▼ -29.00%
- Median HH income
- $41,057
- Composite
- 30.68/100
- National rank
- #6179
- State rank
- #31 of 98 in LA
Livability — Boyce
- Score
- 56/100
- State rank
- #345
- US rank
- #22945
Category grades
Schools grade is shown separately in the Schools card above.
Census & demographics
- Population (ZIP)
- 5,672
Population outlook (Rapides County) Hauer SSP2
- Today (2025)
- 133,047 people
- By 2030
- 132,333 · -0.5%
- By 2040
- 129,355 · -2.8%
- By 2050
- 124,535 · -6.4%
- By 2075
- 110,338 · -17.1%
- By 2100
- 88,641 · -33.4%
Race, ethnicity, and origin ACS 2023
- Neighborhood character
- Predominantly White (73%)
- Race & ethnicity
- White 73% Black 24% Hispanic / Latino 3% Two or more races 2%
- Common ancestry
- Lithuanian 14% Arab 1% Slovak 1%
- Foreign-born
- 1% · Canada
- Languages at home
- 97% English-only · French/Haitian/Cajun 1% Other Indo-European 1% Spanish 1%
Political lean MEDSL · Rapides
- 2024 margin
- Solid R (+36.8) · D 31.0% · R 67.7% · Other 1.3%
- 2008→2024 swing
- -8.1pp toward R · 2008: -28.7pp · 2024: -36.8pp
- All cycles
- 2024: R+36.8 2020: R+32.1 2016: R+32.5 2012: R+29.6 2008: R+28.7
Not yet ingested
- Civics
- —
Market trends
- HPI YoY
- ▼ -53.20%
- Current HPI
- 217.5215
- Rent YoY
- —
- Metro
- —
- State GDP YoY
- ▲ 3.29%
- F500 in state
- 10
Industry mix (Fortune 500 HQ in LA)
| Industry | F500 HQs | Revenue |
|---|---|---|
| Telecommunications | 2 | $23B |
|
||
| Utilities | 1 | $12B |
|
||
| Wholesale / Distribution | 1 | $5B |
|
||
| Advertising | 1 | $2B |
|
||
Price history
-15.3% since first listed3 events — show timeline
- 2026-06-10 Price Changed $127,000 AcadianaMLS
- 2026-05-04 Listed $136,900 AcadianaMLS
- 2023-03-08 Listed $149,900 AcadianaMLS
Property tax history
+23.2%/yrLatest (2025): $1,805 · +0.2% YoY. Source: county tax records.
Cash-flow waterfall
monthlySold comps — $/sqft
last 12 mo · ≤1 miLoading sold comps…