144 S Ben Denton · Kerrville, TX
Flood risk 1/10 · Minimal
- FEMA flood zone
- X (unshaded)
- Chance of flooding over 30 yrs
- 0.0%
- Est. flood insurance / yr
- $507 – $1,088
Fire risk 5/10 · Moderate
- Est. fire insurance / yr
- $1,222 – $2,270
Heat risk 6/10 · Moderate
- Hot days now (above 102°F)
- 7 days/yr
- Hot days in 30 yrs
- 21 days/yr
Wind risk 6/10 · Moderate
- Chance of severe wind over 30 yrs
- 43.0%
Air-quality risk 1/10 · Minimal
- Unhealthy air days now
- 0 days/yr
- Unhealthy air days in 30 yrs
- 0 days/yr
Risk factors via First Street. Map © Google.
Why this score? — see what drove the B- grade
The composite is a weighted blend of 9 inputs, each scored 0–100. Each bar is that input's sub-score; the figure is the points it added to the 100-point composite (weight × sub-score).
- Cash flow +30.0/30.0
- DSCR +10.0/10.0
- ARV discount +7.5/15.0
- 1% rule +7.4/10.0
- Schools +4.1/10.0
- Livability +4.0/5.0
- Rent growth +3.3/5.0
- Condition / age +2.5/5.0
- Appreciation +0.0/10.0
$109,900
🖨 Deal sheet (PDF) 📄 Offer letter ✓ Due diligence
Listing remarks MLS
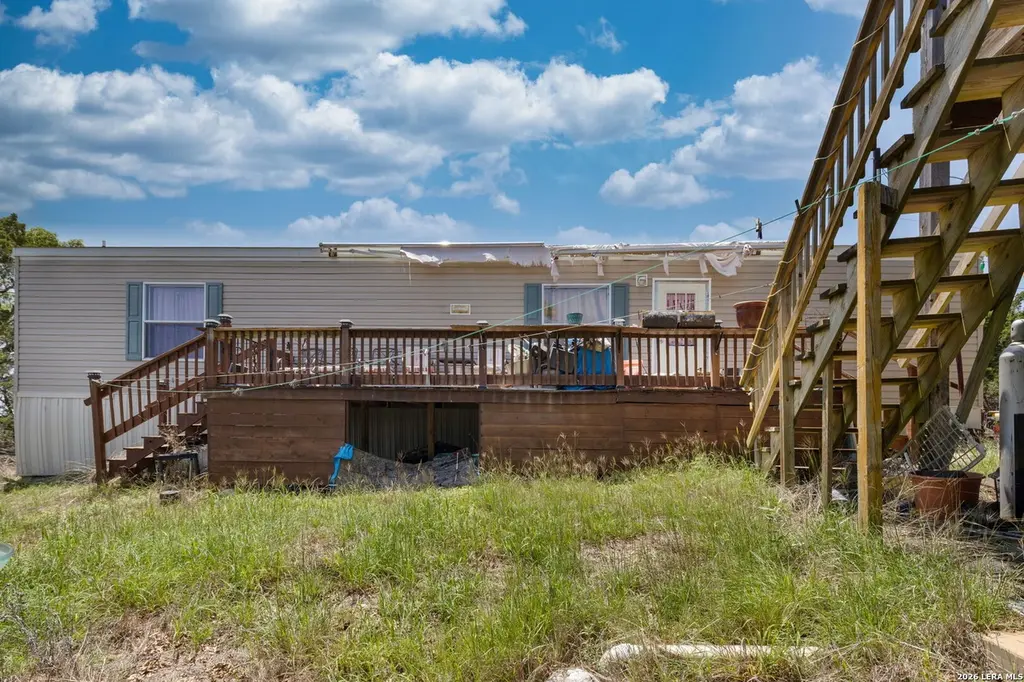
View lot near end of cul-de-sac in established neighborhood. 1.91 acre pie-shaped with many trees. Mobile home would be allowed and you'd be only 15 minutes from Kerrville. Listing agent has estimates for grading, utilities and septic.
Key facts
- Turnkey rental
- Move-in-ready space
- Functional layout
Tags
Property features AI
Finance
- HOA & community: FOUR SEASONS MHP community
Exterior
- Utilities: Other water/sewer information available
- Home design: Pre-owned; Approximate age: 13 years
- Construction: Vinyl exterior; Other roof type (see remarks)
- Exterior features: Located in the FOUR SEASONS MHP subdivision
Interior
- Kitchen: Kitchen about 14 x 15
- Bedrooms: Master bedroom about 12 x 12; Second bedroom about 10 x 10
- Flooring: Vinyl flooring
- Bathrooms: Two full bathrooms; Master bath with tub/shower combination (about 8 x 9)
- Heating & cooling: Central heating (electric); Central air conditioning
- Interior features: Two living areas; All window coverings remain
- Laundry & utility: Washer connection; Dryer connection
Neighborhood map
What this means for you Summary
Snapshot
- This is a 2-bed/2.0-bath manufactured listed at $110k.
Deal economics
- At list price, monthly cash flow is $422 ($5k/yr) — positive.
- The deal already cash-flows at list — no discount required.
- Meets the 1% rule at list price ($1k rent vs $110k).
- Recommended offer: $108k (1.5% below list) — sets the bar for market timing.
- Cap rate 10.9% vs local median 2.1% in Kerrville — top-decile yield for the area; either an underpriced asset or a hidden risk that comps aren't pricing in. Stress-test before assuming the spread holds.
Location & tenants
- Location reads 81/100 on livability (#25 in TX, #1,483 nationally) — a professional / high-income tenant draw. Strengths: crime A+, cost of living A+, housing A+; Watch: employment C-, commute F.
- Kerrville ISD (town): math 45% / reading 51% proficiency, ranked #220 of 826 in TX (top 27%) — families likely to look elsewhere, expect single-tenant / working-renter base with shorter leases.
- Zoned schools: Nimitz El (math 44% / reading 44%, grade F, #1,243 of 4,322 statewide, top 29%, 554 students, 71% FRL); Tivy H S (math 42% / reading 60%, grade D+, #482 of 1,632 statewide, top 30%, 1,468 students, 47% FRL) — zoned schools average 59% FRL vs 41% district-wide (18 pts higher); higher-poverty schools than district average — tighter screening recommended.
- Market conditions: Rents rising (+3.0%/yr); 753 active listings in the ZIP; 422 units permitted in Kerr County in 2024 (322 in 5+ unit buildings).
Forward outlook
- Local home prices are declining (-3.0%/yr); year-one equity from $760 of loan paydown is wiped out by about $3k of value loss. Plan a longer hold.
- Kerr County population projected at +15% by 2050 — long-run rental-demand tailwind backs the buy-and-hold thesis.
- At projected returns (-3.0% appreciation + 3.0% rent growth), your $31k cash investment doubles in ~8 years — after that, you're playing with house money.
Negotiation context
- It's been on market 20 days — a 2% lower offer ($108k) is reasonable based on typical stale-listing flexibility.
- 2 sale attempts since 15y ago with the ask held roughly flat each time — persistent listings suggest the price (not the market) is what's stuck; bring a comps-based counter.
Risks & watch-outs
- Climate carrying-cost: major wind risk, 43% chance of damaging wind over 30y; moderate wildfire risk; extreme-heat days projected 7→21/yr by 2055 (HVAC capex compounding) — expect insurance premiums to compound above CPI over the hold.
Questions for the listing agent
- Is there a deadline driving the sale (1031 exchange, divorce, estate, relocation)? That informs how much negotiation room exists.
- Schools are B-rated — typically a magnet for longer-tenancy family renters. What's the average tenant stay here, and is there a school-zone premium baked into asking?
- What's the average days-on-market for RENTAL listings here right now (not sales)? A rising rental-DOM trend means longer vacancies and softer asking-rent achievability than the comps imply.
- What's the recent tenant-quality profile in this submarket — average credit score on applications, eviction rate, late-payment / NSF rate, and stable-employment percentage? A property-management company in the area should have these aggregated.
- How much new for-sale + rental construction is in the pipeline within 1–3 miles? Heavy new supply typically softens prices + rents 12–24 months out; constrained supply supports both.
Investment metrics
- 1% rule
- 1.24% ✓
- Cap rate
- 10.90%
- Cash-on-cash
- 16.47%
- DSCR
- 1.73
- GRM
- 6.7
CMA / ARV
- ARV (median comp)
- $109,900
- List price
- $109,900
- Delta
- —
- Verdict
- FAIR
- Comps
- 1 within 2.0 mi
Projected returns pro-forma
-3.0% appreciation · 3.03% rent growth · sell at horizon
- IRR
- 7.5%
- Equity multiple
- 1.30×
- Total profit
- $9,083
- Equity at exit
- $16,386
- IRR
- 16.8%
- Equity multiple
- 2.38×
- Total profit
- $42,536
- Equity at exit
- $9,502
Cash invested: $30,772 (down + closing). Projections, not guarantees.
Landlord ↔ Tenant lean methodology
- Overall (STATE)
- 87 Strongly Landlord-Friendly
- State Texas
- 87 Strongly Landlord-Friendly · R+5
- County
- — inherits STATE
- City
- — inherits STATE
ZIP-level market 78028
- Rents YoY
- 3.0%
- Active inventory
- 753
- Price-to-rent
- 6.7×
Monthly cashflow live
- Estimated rent
- $1,367 medium interval (Pro) →
- Mortgage (P&I)
- −$576
- Tax from tax record
- −$36 /mo · $429/yr
- Insurance
- −$46
- HOA
- −$0
- Vacancy / Maint / Mgmt
- −$287
- Net cashflow
- $422
Break-even live
Sensitivity live
| Price | -10% $484 | -5% $453 | +0% $422 | +5% $391 | +10% $360 |
|---|---|---|---|---|---|
| Rent | -10% $314 | -5% $368 | +0% $422 | +5% $476 | +10% $530 |
| Rate | -1.0pp $478 | -0.5pp $450 | base $422 | +0.5pp $394 | +1.0pp $365 |
UW: 25.0% down · 7.5% · 30yr · 1.5% tax · 5.0% vac · 8.0% maint · 8.0% mgmt
Financing live
Cash to close
- Down payment
- $27,475
- Closing costs
- $3,297
- Reserves months
- —
- Total cash needed
- —
Loan-product check · same deal, 3 products live
Conventional
25% down · 7.5% · 30yr
- Down + closing
- —
- Monthly P&I
- —
- Monthly cashflow
- —
- DSCR
- —
- Eligible?
- —
Personal DTI + credit; lowest rate.
DSCR
20% down · 8.5% · 30yr
- Down + closing
- —
- Monthly P&I
- —
- Monthly cashflow
- —
- DSCR
- —
- Eligible?
- —
No personal income docs; deal must DSCR.
Hard money
10% down · 12.0% · 12mo
- Down + closing
- —
- Monthly P&I
- —
- Monthly cashflow
- —
- DSCR
- —
- Eligible?
- —
Short-term bridge; refi at stabilization.
Listing history 4 events
-
2026-05-18status Pending 478-char remark
-
2026-04-28$109,900 New 478-char remark
-
2012-10-10soldstatus 235-char remark
Show marketing remark (235 chars)
View lot near end of cul-de-sac in established neighborhood. 1.91 acre pie-shaped with many trees. Mobile home would be allowed and you'd be only 15 minutes from Kerrville. Listing agent has estimates for grading, utilities and septic.
-
2011-04-08$9,500 235-char remark
Show marketing remark (235 chars)
View lot near end of cul-de-sac in established neighborhood. 1.91 acre pie-shaped with many trees. Mobile home would be allowed and you'd be only 15 minutes from Kerrville. Listing agent has estimates for grading, utilities and septic.
ⓘ Source: listings_history table (triggers on properties + properties_extension) + one-shot
backfill from property_details.listing_events for pre-trigger history.
Tax reassessment forecast TX · Resets to sale price
- Current annual tax
- $429 · $36/mo
- Projected year-2 tax
- $2,011 · $168/mo
- Expected delta
- +$1,582/yr (+$132/mo · 368.7%)
ⓘ Screening estimate from a state-policy table — verify with the county assessor before closing.
Climate risk First Street
- Flood 1/10 Low FEMA zone X (unshaded) · 0% chance over 30 yrs
- Wildfire 5/10 Major
- Heat 6/10 Major 7 d/yr ≥102°F today · 21 d/yr by 30 yrs out
- Wind 6/10 Major 43% chance of damaging wind over 30 yrs
- Air quality 1/10 Low 0 unhealthy d/yr today · 0 by 30 yrs out
Nearby sold comps map
Loading sold comps map…
Walkable amenities ~0.75 mi
Loading nearby amenities…
Taxation est. · year 1
- Rental income
- $16,407
- − Mortgage interest
- −$6,156
- − Property taxes
- −$429
- − Insurance
- −$550
- − Repairs & maintenance
- −$1,313
- − Management
- −$1,313
- − Depreciation
- −$3,197
- Taxable income
- $3,450
- Est. tax owed @ 24.0%
- −$828
- After-tax cash flow
- $4,239/yr
For passive investors: Depreciation is non-cash, so a rental often shows a tax loss while cash-flowing — sheltering income. Rental losses are passive: they offset passive income freely, and up to $25,000/yr can offset ordinary (W-2) income if you actively participate and your MAGI is under $100k (phasing out to $0 by $150k); unused losses carry forward. On sale, claimed depreciation is recaptured at up to 25%, and gains may owe capital-gains tax (a 1031 exchange can defer both). Figures are a year-1 estimate at your 24.0% rate — not tax advice; consult a CPA.
Schools (NCES district)
- District
- Kerrville ISD
- NCES district ID
- 4825590
- Math proficiency
- 45% ▼ -10.00%
- Reading proficiency
- 51% ▼ -1.00%
- Median HH income
- $44,050
- Composite
- 40.54/100
- National rank
- #3702
- State rank
- #220 of 826 in TX
Livability — Kerrville
- Score
- 81/100
- State rank
- #25
- US rank
- #1483
Category grades
Schools grade is shown separately in the Schools card above.
Census & demographics
- County
- Kerr County · 41,206 people
- City population
- 41,206
- Metro
- Kerrville, TX
- Population (ZIP)
- 41,206
- Household income
- $66,991
- Rent vs Own
- Severe rent burden
- 1092.0
Population outlook (Kerr County) Hauer SSP2
- Today (2025)
- 54,010 people
- By 2030
- 55,651 · +3.0%
- By 2040
- 58,923 · +9.1%
- By 2050
- 62,117 · +15.0%
- By 2075
- 71,809 · +33.0%
- By 2100
- 77,004 · +42.6%
Race, ethnicity, and origin ACS 2023
- Neighborhood character
- Predominantly White (69%)
- Race & ethnicity
- White 69% Hispanic / Latino 26% Two or more races 12% Black 2%
- Hispanic origin (detail)
- Mexican 22%
- Common ancestry
- Lithuanian 3% Slovak 3% Portuguese 2%
- Foreign-born
- 6% · Canada
- Languages at home
- 89% English-only · Spanish 10%
Political lean MEDSL · Kerr
- 2024 margin
- Solid R (+54.3) · D 22.4% · R 76.8%
- 2008→2024 swing
- -4.8pp toward R · 2008: -49.6pp · 2024: -54.3pp
- All cycles
- 2024: R+54.3 2020: R+51.7 2016: R+56.3 2012: R+59.1 2008: R+49.6
Not yet ingested
- Civics
- —
Market trends
- HPI YoY
- ▼ -260.97%
- Current HPI
- 213.3663
- Rent YoY
- ▲ 3.03%
- Metro
- Kerrville, TX
- State GDP YoY
- ▲ 3.95%
- F500 in state
- 110
Industry mix (Fortune 500 HQ in TX)
| Industry | F500 HQs | Revenue |
|---|---|---|
| Energy | 16 | $1,198B |
|
||
| Technology | 5 | $198B |
|
||
| Engineering / Construction | 4 | $72B |
|
||
| Energy Services | 3 | $60B |
|
||
| Utilities | 3 | $41B |
|
||
| Healthcare | 2 | $330B |
|
||
Price history
+1056.8% since first listed5 events — show timeline
- 2026-06-10 Sold (MLS) — LERA
- 2026-05-18 Pending — LERA
- 2026-04-28 Listed $109,900 LERA
- 2012-10-10 Sold (MLS) — KVMLS
- 2011-04-08 Listed $9,500 KVMLS
Property tax history
-20.9%/yrLatest (2021): $429 · -52.0% YoY. Source: county tax records.
Cash-flow waterfall
monthlySold comps — $/sqft
last 12 mo · ≤1 miLoading sold comps…