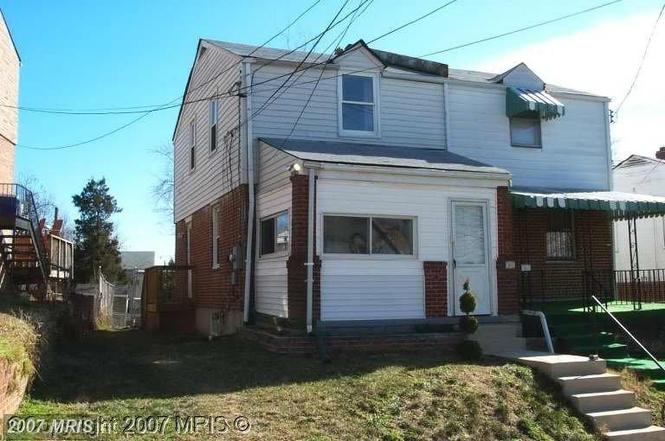
813 51st St NE · Washington, DC
Flood risk 1/10 · Minimal
- FEMA flood zone
- X (unshaded)
- Chance of flooding over 30 yrs
- 0.0%
- Est. flood insurance / yr
- $473 – $860
Fire risk 1/10 · Minimal
- Est. fire insurance / yr
- $631 – $1,173
Heat risk 8/10 · Major
- Hot days now (above 104°F)
- 7 days/yr
- Hot days in 30 yrs
- 15 days/yr
Wind risk 4/10 · Minor
- Chance of severe wind over 30 yrs
- 17.0%
Air-quality risk 4/10 · Minor
- Unhealthy air days now
- 4 days/yr
- Unhealthy air days in 30 yrs
- 5 days/yr
Risk factors via First Street. Map © Google.
Why this score? — see what drove the C- grade
The composite is a weighted blend of 9 inputs, each scored 0–100. Each bar is that input's sub-score; the figure is the points it added to the 100-point composite (weight × sub-score).
- ARV discount +15.0/15.0
- Cash flow +14.2/30.0
- DSCR +4.3/10.0
- Rent growth +4.0/5.0
- Livability +3.7/5.0
- Schools +3.6/10.0
- 1% rule +3.4/10.0
- Condition / age +2.5/5.0
- Appreciation +0.0/10.0
$239,000
🖨 Deal sheet (PDF) 📄 Offer letter ✓ Due diligence
Listing remarks MLS
This is a Best Buy / Best Value opportunity. Get a totally redone home in a convenient neighborhood. HPAP , VPAP and other programs welcomed. This home will pass the test. This home is very airy and has lots of natural light. Both bedrooms are large. The finished basement with full bath is a great feature. Won't last.
Key facts
- Built 1945
- Listed 79 days
Property features AI
Finance
- Other: Fee simple ownership
Exterior
- Parking: On-street parking
- Utilities: Public water; Public sewer; Natural gas service
- Home design: Semi-detached property; Effective major renovation in 2006
- Construction: Vinyl siding and brick exterior; Concrete perimeter foundation; Above grade and below grade structures
- Exterior features: On-street parking; No tidal water
Interior
- Bedrooms: Two bedrooms on the upper level
- Bathrooms: Two full bathrooms (one on upper level, one on lower level)
- Heating & cooling: Forced air heating; Natural gas hot water
- Interior features: Basement with rear entrance and interior access; Living area source: Assessor
Neighborhood map
What this means for you Summary
Snapshot
- This is a 2-bed/1.0-bath single-family listed at $239k.
Deal economics
- At list price, monthly cash flow is $41 ($494/yr) — positive.
- The deal already cash-flows at list — no discount required.
- To meet the 1% rule (rent ≥ 1% of price), the offer needs to be $201k (16.1% below list).
- Recommended offer: $201k (16.1% below list) — sets the bar for 1% rule.
- Cap rate 6.5% vs local median 2.5% in Washington — top-decile yield for the area; either an underpriced asset or a hidden risk that comps aren't pricing in. Stress-test before assuming the spread holds.
Location & tenants
- Location reads 73/100 on livability (#1 in DC) — a middle-class / working-renter tenant base. Strengths: amenities A+, commute A+, employment A+; Watch: crime F, cost of living F.
- District Of Columbia Public Schools (urban): math 33% / reading 40% proficiency, ranked #8 of 32 in DC (top 25%) — families likely to look elsewhere, expect single-tenant / working-renter base with shorter leases; 65% free/reduced lunch — lower-income household profile, screen leases tightly.
- Zoned schools: Burrville Es (278 students, 0% FRL); Kelly Miller Ms (351 students, 0% FRL); H.D. Woodson Hs (543 students, 0% FRL) — zoned schools average 0% FRL vs 65% district-wide (65 pts lower); this property's tenant base skews higher-income than the district average.
- Market conditions: Rents rising fast (+6.1%/yr); 281 active listings in the ZIP; 40 comparable units currently listed for rent nearby; rentals at typical pace (median 26d on market — plan ~3-4 weeks tenant-placement turnaround); 1,737 units permitted in District of Columbia in 2024 (1,506 in 5+ unit buildings).
- This rent runs 41% of the median local income ($58k/yr) — at the standard rent-burdened threshold; future hikes will face affordability resistance.
Forward outlook
- Local home prices are declining (-3.0%/yr); year-one equity from $2k of loan paydown is wiped out by about $7k of value loss. Plan a longer hold.
- District of Columbia County population projected at +50% by 2050 — long-run rental-demand tailwind backs the buy-and-hold thesis.
Negotiation context
- It's been on market 79 days — a 6% lower offer ($225k) is reasonable based on typical stale-listing flexibility.
- 5 sale attempts since 20y ago with the ask held roughly flat each time — persistent listings suggest the price (not the market) is what's stuck; bring a comps-based counter.
Risks & watch-outs
- Watch-outs: built in 1945 — expect roof / HVAC / electrical / plumbing capex.
- Climate carrying-cost: extreme-heat days projected 7→15/yr by 2055 (HVAC capex compounding) — expect insurance premiums to compound above CPI over the hold.
Questions for the listing agent
- It's been on market 79 days. Have you received any prior offers? Is the seller open to a 16% concession, seller financing, or rate buy-down credit?
- Built in 1945 — when were the roof, HVAC, electrical panel, plumbing, and water heater last replaced?
- Why hasn't it sold? Are there any deal-killer items the seller is aware of (foundation, flood, title, zoning, code violations)?
- Is there a deadline driving the sale (1031 exchange, divorce, estate, relocation)? That informs how much negotiation room exists.
- Crime grade is F in this area — have there been break-ins, vandalism, or insurance claims at this property in the last 3 years? What carrier currently insures it and at what premium?
- What's the average days-on-market for RENTAL listings here right now (not sales)? A rising rental-DOM trend means longer vacancies and softer asking-rent achievability than the comps imply.
- What's the recent tenant-quality profile in this submarket — average credit score on applications, eviction rate, late-payment / NSF rate, and stable-employment percentage? A property-management company in the area should have these aggregated.
- How much new for-sale + rental construction is in the pipeline within 1–3 miles? Heavy new supply typically softens prices + rents 12–24 months out; constrained supply supports both.
Investment metrics
- 1% rule
- 0.84% ✗
- Cap rate
- 6.50%
- Cash-on-cash
- 0.74%
- DSCR
- 1.03
- GRM
- 9.9
CMA / ARV
- ARV (on-the-fly)
- $328,050
- Comps found
- 12
Show comp detail 12 sales within ~0.75 mi
| Address | Dist | Beds/Ba | Sqft | Sold | Price | $/sf | Match |
|---|---|---|---|---|---|---|---|
| 917 47th Pl NE | 0.41mi | 2/1.0 | 832 (+3%) | 1mo | $125,000 | $150 | 76 |
| 1113 Booth Ln | 0.40mi | 3/2.0 (+1) | 816 (+1%) | 9mo | $360,000 | $441 | 64 |
| 5901 L St | 0.73mi | 2/1.0 | 792 (-2%) | 1mo | $210,000 | $265 | 62 |
| 4702 Jay St NE | 0.44mi | 2/1.0 | 776 (-4%) | 17mo | $314,000 | $405 | 58 |
| 5104 Brooks St NE | 0.56mi | 2/2.0 | 825 (+2%) | 17mo | $418,500 | $507 | 53 |
| 833 Eastern Ave | 0.41mi | 3/2.0 (+1) | 696 (-14%) | 6mo | $362,000 | $520 | 43 |
| 702 60th | 0.70mi | 2/1.0 | 864 (+7%) | 16mo | $306,500 | $355 | 43 |
| 5014 Leroy Gorham Dr | 0.49mi | 3/2.0 (+1) | 700 (-14%) | 6mo | $330,000 | $471 | 40 |
| 1303 Eastern Ave | 0.50mi | 3/2.0 (+1) | 930 (+15%) | 13mo | $400,000 | $430 | 32 |
| 905 59th Ave | 0.66mi | 3/1.0 (+1) | 900 (+11%) | 23mo | $335,000 | $372 | 27 |
| 1420 Nye St | 0.73mi | 3/1.0 (+1) | 912 (+13%) | 22mo | $335,000 | $367 | 21 |
| 714 60th Ave | 0.68mi | 3/2.0 (+1) | 931 (+15%) | 19mo | $350,000 | $376 | 19 |
Match score weights: distance 35% · size 25% · config 20% · recency 20%. Top-matched comps best support the ARV.
Projected returns pro-forma
-3.0% appreciation · 6.06% rent growth · sell at horizon
- IRR
- -12.0%
- Equity multiple
- 0.56×
- Total profit
- $-29,778
- Equity at exit
- $35,636
- IRR
- 1.0%
- Equity multiple
- 1.08×
- Total profit
- $5,105
- Equity at exit
- $20,664
Cash invested: $66,920 (down + closing). Projections, not guarantees.
Landlord ↔ Tenant lean methodology
- Overall (CITY)
- 0 Strongly Tenant-Friendly
- State District of Columbia
- 12 Strongly Tenant-Friendly · D+43
- County
- — inherits STATE
- City Washington
- 0 Strongly Tenant-Friendly · D+43
ZIP-level market 20019
- Rents YoY
- 6.1%
- Active inventory
- 281
- Price-to-rent
- 9.9×
Monthly cashflow live
- Estimated rent
- $2,005 high interval (Pro) →
- Mortgage (P&I)
- −$1,253
- Tax from tax record
- −$190 /mo · $2,281/yr
- Insurance
- −$100
- HOA
- −$0
- Vacancy / Maint / Mgmt
- −$421
- Net cashflow
- $41
Break-even live
Sensitivity live
| Price | -10% $176 | -5% $109 | +0% $41 | +5% $-26 | +10% $-94 |
|---|---|---|---|---|---|
| Rent | -10% $-117 | -5% $-38 | +0% $41 | +5% $120 | +10% $200 |
| Rate | -1.0pp $162 | -0.5pp $102 | base $41 | +0.5pp $-21 | +1.0pp $-84 |
UW: 25.0% down · 7.5% · 30yr · 1.5% tax · 5.0% vac · 8.0% maint · 8.0% mgmt
Financing live
Cash to close
- Down payment
- $59,750
- Closing costs
- $7,170
- Reserves months
- —
- Total cash needed
- —
Loan-product check · same deal, 3 products live
Conventional
25% down · 7.5% · 30yr
- Down + closing
- —
- Monthly P&I
- —
- Monthly cashflow
- —
- DSCR
- —
- Eligible?
- —
Personal DTI + credit; lowest rate.
DSCR
20% down · 8.5% · 30yr
- Down + closing
- —
- Monthly P&I
- —
- Monthly cashflow
- —
- DSCR
- —
- Eligible?
- —
No personal income docs; deal must DSCR.
Hard money
10% down · 12.0% · 12mo
- Down + closing
- —
- Monthly P&I
- —
- Monthly cashflow
- —
- DSCR
- —
- Eligible?
- —
Short-term bridge; refi at stabilization.
Rent comps 40 comps
| Address | Beds | Baths | Sqft | Rent | $/sqft | DOM | Units | Dist |
|---|---|---|---|---|---|---|---|---|
| 5000 Hunt St NE Washington, DC | 2.0 | 1.0 | 629 | $1,325 | $2.11 | 26d | 20 | 0.19mi |
| 5213 Just St NE Washington, DC | 3.0 | 2.0 | 1114 | $2,400 | $2.15 | 26d | 1 | 0.23mi |
| 4925 Just St NE Washington, DC | 2.0 | 2.0 | 864 | $2,299 | $2.66 | 26d | 1 | 0.24mi |
| 4911 Just St NE Washington, DC | 1.0 | 1.0 | 810 | $2,500 | $3.09 | 15d | 1 | 0.24mi |
| 599 50th St NE Washington, DC | 1.0–2.0 | 1.0–2.0 | 775 | $2,081 | $2.69 | 26d | 1 | 0.25mi |
| 927 52nd St NE Unit 4 Washington, DC | 2.0 | 1.0 | 700 | $1,500 | $2.14 | 26d | 1 | 0.25mi |
| 5338 Jay St NE Washington, DC | 3.0 | 1.5 | 1000 | $2,795 | $2.79 | 26d | 1 | 0.25mi |
| 716 55th St NE Unit 1 Washington, DC | 2.0 | 2.0 | 1100 | $2,200 | $2.00 | 22d | 1 | 0.27mi |
| 832 49th St NE Unit 1 Washington, DC | 3.0 | 1.0 | 1100 | $2,425 | $2.20 | 26d | 1 | 0.27mi |
| 832 49th St NE Washington, DC | 3.0 | 1.0 | 1100 | $2,425 | $2.20 | 18d | 1 | 0.27mi |
| 832 49th St NE Unit 1 Washington, DC | 3.0 | 1.0 | 1100 | $2,350 | $2.14 | 9d | 1 | 0.27mi |
| 945 52nd St NE Washington, DC | 2.0–3.0 | 1.0 | 612 | $1,610 | $2.63 | 26d | 4 | 0.28mi |
| 4934 Just St NE Washington, DC | 2.0 | 1.0 | 966 | $2,200 | $2.28 | 26d | 1 | 0.28mi |
| 405 Division Ave NE Unit 201 Washington, DC | 2.0 | 1.0 | 656 | $1,197 | $1.82 | 18d | 1 | 0.31mi |
| 4820 Hayes St NE Washington, DC | 1.0 | 1.0 | 920 | $1,400 | $1.52 | 26d | 1 | 0.32mi |
| 1100 Eastern Ave NE Washington, DC | 1.0 | 1.0 | 544 | $1,359 | $2.50 | 26d | 1 | 0.32mi |
| 556 49th Pl NE Washington, DC | 3.0 | 3.0 | 894 | $3,475 | $3.89 | 26d | 1 | 0.35mi |
| 5225 Dix St NE Washington, DC | 1.0 | 1.0 | 800 | $1,300 | $1.62 | 7d | 1 | 0.36mi |
| 5225 Dix St NE Apt 101 Washington, DC | 1.0 | 1.0 | 650 | $1,550 | $2.38 | 26d | 1 | 0.36mi |
| 5225 Dix St NE Washington, DC | 2.0 | 1.0 | 800 | $1,500 | $1.88 | 24d | 1 | 0.36mi |
| 5225 Dix St NE Washington, DC | 1.0 | 1.0 | 800 | $1,300 | $1.62 | 22d | 1 | 0.36mi |
| 4930 Eads Pl NE Washington, DC | 3.0 | 1.5 | 1054 | $2,400 | $2.28 | 26d | 1 | 0.38mi |
| 5601 Nannie Helen Burroughs Ave NE #103 Washington, DC | 1.0 | 1.0 | 675 | $1,375 | $2.04 | 26d | 1 | 0.39mi |
| 4651 Nannie Helen Burroughs Ave NE Washington, DC | 1.0–2.0 | 1.0 | 663 | $1,749 | $2.64 | 7d | 3 | 0.40mi |
| 907 47th Pl NE Unit 1 Washington, DC | 2.0 | 1.0 | 950 | $1,575 | $1.66 | 16d | 1 | 0.42mi |
| 1012 48th St NE Unit 1 Washington, DC | 1.0 | 1.0 | 580 | $1,600 | $2.76 | 20d | 1 | 0.46mi |
| 1126 48th Pl NE Unit 2 Washington, DC | 1.0 | 1.0 | 625 | $1,500 | $2.40 | 20d | 1 | 0.49mi |
| 4936 Nash St NE Unit 9 Washington, DC | 3.0 | 1.0 | 800 | $2,175 | $2.72 | 9d | 1 | 0.54mi |
| 5811 Field Pl NE Unit 304 Washington, DC | 3.0 | 1.0 | 779 | $2,922 | $3.75 | 26d | 1 | 0.55mi |
| 4629 Meade St NE Washington, DC | 3.0 | 1.5 | 960 | $2,300 | $2.40 | 26d | 1 | 0.59mi |
| 622 Eastern Ave NE #301 Washington, DC | 2.0 | 1.0 | 755 | $1,900 | $2.52 | 26d | 1 | 0.61mi |
| 611 60th Pl Fairmount Heights, MD | 1.0 | 2.0 | 828 | $1,550 | $1.87 | 45d | 1 | 0.70mi |
| 506 Eastern Ave NE Unit 102 Washington, DC | 1.0 | 1.0 | 650 | $1,199 | $1.84 | 26d | 1 | 0.74mi |
| 4255 Eads St NE Unit 3 Washington, DC | 2.0 | 1.0 | 610 | $1,750 | $2.87 | 24d | 1 | 0.76mi |
| 4241 Foote St NE Apt 301 Washington, DC | 3.0 | 1.0 | 909 | $2,925 | $3.22 | 6d | 1 | 0.77mi |
| 4241 Foote St NE Unit 102 Washington, DC | 2.0 | 1.0 | 811 | $2,200 | $2.71 | 6d | 1 | 0.77mi |
| 4601 Blaine St NE Unit 1 Washington, DC | 2.0 | 1.0 | 750 | $1,500 | $2.00 | 26d | 1 | 0.77mi |
| 4800 Addison Rd Capitol Heights, MD | 1.0–3.0 | 1.0–3.0 | 998 | $2,374 | $2.38 | 1d | 41 | 0.80mi |
| 324 61st St NE Unit 4 Washington, DC | 3.0 | 1.5 | 850 | $2,800 | $3.29 | 26d | 1 | 0.82mi |
| 44 49th St SE Unit A1 Washington, DC | 3.0 | 1.0 | 793 | $2,499 | $3.15 | 26d | 1 | 0.82mi |
Listing history 16 events
-
2026-04-29price $239,000
-
2026-04-29status Active
-
2025-08-15status Pending
-
2025-08-05price $199,999
-
2025-06-30price $265,000
-
2025-06-29status Active
-
2025-05-13status Pending
-
2025-05-10$239,999 Active
-
2025-04-22historical $239,999
-
2007-04-10soldstatus $220,000
-
2007-03-09soldstatus $220,000 319-char remark
Show marketing remark (319 chars)
This is a Best Buy / Best Value opportunity. Get a totally redone home in a convenient neighborhood. HPAP , VPAP and other programs welcomed. This home will pass the test. This home is very airy and has lots of natural light. Both bedrooms are large. The finished basement with full bath is a great feature. Won't last.
-
2007-02-03historical 319-char remark
Show marketing remark (319 chars)
This is a Best Buy / Best Value opportunity. Get a totally redone home in a convenient neighborhood. HPAP , VPAP and other programs welcomed. This home will pass the test. This home is very airy and has lots of natural light. Both bedrooms are large. The finished basement with full bath is a great feature. Won't last.
-
2007-01-31$240,000 319-char remark
Show marketing remark (319 chars)
This is a Best Buy / Best Value opportunity. Get a totally redone home in a convenient neighborhood. HPAP , VPAP and other programs welcomed. This home will pass the test. This home is very airy and has lots of natural light. Both bedrooms are large. The finished basement with full bath is a great feature. Won't last.
-
2006-12-01historical
-
2006-07-14
-
2004-12-15soldstatus $75,000
ⓘ Source: listings_history table (triggers on properties + properties_extension) + one-shot
backfill from property_details.listing_events for pre-trigger history.
Tax reassessment forecast DC · Partial reset (capped growth)
- Current annual tax
- $2,281 · $190/mo
- Projected year-2 tax
- $2,281 · $190/mo
- Expected delta
- $0/yr ($0/mo · 0.0%)
ⓘ Screening estimate from a state-policy table — verify with the county assessor before closing.
Climate risk First Street
- Flood 1/10 Low FEMA zone X (unshaded) · 0% chance over 30 yrs
- Wildfire 1/10 Low
- Heat 8/10 Severe 7 d/yr ≥104°F today · 15 d/yr by 30 yrs out
- Wind 4/10 Moderate 17% chance of damaging wind over 30 yrs
- Air quality 4/10 Moderate 4 unhealthy d/yr today · 5 by 30 yrs out
Nearby sold comps map
Loading sold comps map…
Walkable amenities ~0.75 mi
Loading nearby amenities…
Taxation est. · year 1
- Rental income
- $24,063
- − Mortgage interest
- −$13,388
- − Property taxes
- −$2,281
- − Insurance
- −$1,195
- − Repairs & maintenance
- −$1,925
- − Management
- −$1,925
- − Depreciation
- −$6,953
- Taxable loss
- −$3,603
- Est. tax savings @ 24.0%
- +$865
- After-tax cash flow
- $1,359/yr
For passive investors: Depreciation is non-cash, so a rental often shows a tax loss while cash-flowing — sheltering income. Rental losses are passive: they offset passive income freely, and up to $25,000/yr can offset ordinary (W-2) income if you actively participate and your MAGI is under $100k (phasing out to $0 by $150k); unused losses carry forward. On sale, claimed depreciation is recaptured at up to 25%, and gains may owe capital-gains tax (a 1031 exchange can defer both). Figures are a year-1 estimate at your 24.0% rate — not tax advice; consult a CPA.
Schools (NCES district)
- District
- District Of Columbia Public Schools
- NCES district ID
- 1100030
- Math proficiency
- 33% ▲ 3.00%
- Reading proficiency
- 40% ▲ 5.00%
- Median HH income
- $67,671
- Composite
- 35.84/100
- National rank
- #9606
- State rank
- #8 of 32 in DC
Livability — Washington
- Score
- 73/100
- State rank
- #1
- US rank
- #5327
Category grades
Schools grade is shown separately in the Schools card above.
Census & demographics
- Census place
- Washington, DC
- County
- District of Columbia · 671,873 people
- City population
- 671,873
- Metro
- Washington-Arlington-Alexandria, DC-VA-MD-WV
- Population (ZIP)
- 63,380
- Household income
- $58,296
- Rent vs Own
- Severe rent burden
- 5115.0
Population outlook (District of Columbia County) Hauer SSP2
- Today (2025)
- 821,926 people
- By 2030
- 899,517 · +9.4%
- By 2040
- 1,061,162 · +29.1%
- By 2050
- 1,231,493 · +49.8%
- By 2075
- 1,603,312 · +95.1%
- By 2100
- 1,847,141 · +124.7%
Race, ethnicity, and origin ACS 2023
- Neighborhood character
- Predominantly Black (87%)
- Race & ethnicity
- Black 87% Hispanic / Latino 7% Two or more races 4% White 2%
- Hispanic origin (detail)
- Mexican 1% Dominican 1%
- Foreign-born
- 6% · Canada
- Languages at home
- 91% English-only · Spanish 6% French/Haitian/Cajun 1%
Political lean MEDSL · District of Columbia
- 2024 margin
- Solid D (+86.1) · D 91.2% · R 5.1% · Other 3.8%
- 2008→2024 swing
- +0.1pp no change · 2008: 85.9pp · 2024: 86.1pp
- All cycles
- 2024: D+86.1 2020: D+86.8 2016: D+88.7 2012: D+84.2 2008: D+85.9
Not yet ingested
- Civics
- —
Market trends
- HPI YoY
- ▼ -416.91%
- Current HPI
- 326.4481
- Rent YoY
- ▲ 6.06%
- Metro
- Washington-Arlington-Alexandria, DC-VA-MD-WV
- State GDP YoY
- ▲ 1.33%
- F500 in state
- 6
Industry mix (Fortune 500 HQ in DC)
| Industry | F500 HQs | Revenue |
|---|---|---|
| Financial Services | 1 | $153B |
|
||
| Life Sciences / Industrials | 1 | $25B |
|
||
| Industrial Machinery | 1 | $8B |
|
||
Price history
+218.7% since first listed16 events — show timeline
- 2026-04-29 Price Changed $239,000 BRIGHT MLS
- 2026-04-29 Relisted — BRIGHT MLS
- 2025-08-15 Pending — BRIGHT MLS
- 2025-08-05 Price Changed $199,999 BRIGHT MLS
- 2025-06-30 Price Changed $265,000 BRIGHT MLS
- 2025-06-29 Relisted — BRIGHT MLS
- 2025-05-13 Pending — BRIGHT MLS
- 2025-05-10 Listed $239,999 BRIGHT MLS
- 2025-04-22 Coming Soon $239,999 BRIGHT MLS
- 2007-04-10 Sold (Public Records) $220,000 Public Records
- 2007-03-09 Sold (MLS) $220,000 MRIS
- 2007-02-03 Delisted — MRIS
- 2007-01-31 Listed $240,000 MRIS
- 2006-12-01 Delisted — MRIS
- 2006-07-14 Listed — MRIS
- 2004-12-15 Sold (Public Records) $75,000 Public Records
Property tax history
+11.8%/yrLatest (2025): $2,281 · +414.2% YoY. Source: county tax records.
Cash-flow waterfall
monthlySold comps — $/sqft
last 12 mo · ≤1 miLoading sold comps…