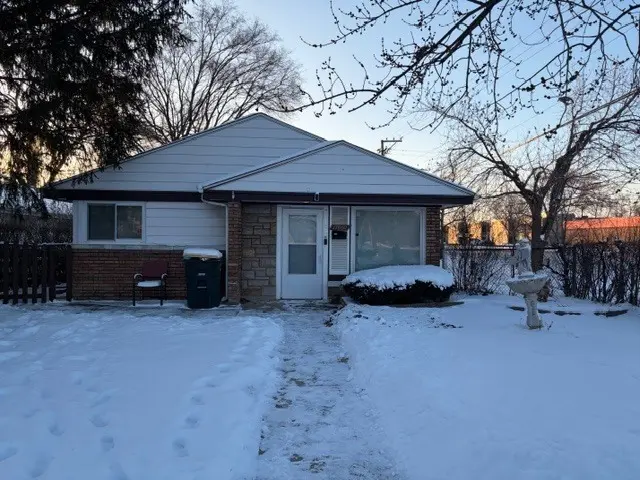
17002 Lorenz Ave · Lansing, IL
Flood risk 5/10 · Moderate
- FEMA flood zone
- X (shaded)
- Chance of flooding over 30 yrs
- 0.24%
- Est. flood insurance / yr
- $473 – $860
Fire risk 1/10 · Minimal
- Est. fire insurance / yr
- $804 – $1,492
Heat risk 3/10 · Minor
- Hot days now (above 102°F)
- 7 days/yr
- Hot days in 30 yrs
- 15 days/yr
Wind risk 2/10 · Minimal
- Chance of severe wind over 30 yrs
- —
Air-quality risk 4/10 · Minor
- Unhealthy air days now
- 5 days/yr
- Unhealthy air days in 30 yrs
- 6 days/yr
Risk factors via First Street. Map © Google.
Why this score? — see what drove the C- grade
The composite is a weighted blend of 9 inputs, each scored 0–100. Each bar is that input's sub-score; the figure is the points it added to the 100-point composite (weight × sub-score).
- Cash flow +19.6/30.0
- ARV discount +11.7/15.0
- 1% rule +7.3/10.0
- DSCR +6.2/10.0
- Livability +3.7/5.0
- Rent growth +2.5/5.0
- Condition / age +2.5/5.0
- Schools +1.0/10.0
- Appreciation +0.0/10.0
$125,000
🖨 Deal sheet 📄 Offer letter ✓ Due diligence
Listing remarks
Discover the perfect blend of affordability, convenience, and income potential with this well-maintained 2-bedroom, 1-bath ranch in Lansing. Ideally situated near I-294 and I-94, this home offers easy access to major commuting routes, retail, dining, and everyday amenities. Inside, the property features recent updates completed within the last three years, including the kitchen, bathroom, flooring, and select appliances allowing for a move-in-ready experience with minimal upfront investment. The functional layout is complemented by central air conditioning and abundant natural light throughout. Exterior highlights include a spacious two-car garage and a large, fully fenced yard ideal for ou
Key facts
- Easy access
- Cash-flowing rental
- Fully fenced yard
Tags
Property features AI
Finance
- Other: Property in Lansing (Bloom township)
- HOA & community: No master association fee required
Exterior
- Parking: Attached garage with 2 garage spaces (2 total parking spaces)
- Utilities: Public water; Public sewer
- Home design: Detached single-family home; One-story layout; Fee simple ownership; Rehab completed in 2022; Built before 1978
- Construction: Brick construction
- Exterior features: Lot dimensions approximately 42 x 123; Lot smaller than 0.25 acre; Commuter bus access
Interior
- Kitchen: Main-level kitchen (17 x 12)
- Bedrooms: Master bedroom on main level (18 x 13); Second bedroom on main level (14 x 12); Additional bedrooms
- Bathrooms: One full bathroom
- Heating & cooling: Natural gas heating; Central air conditioning
- Interior features: Five total rooms; Dining room; Family room; Living room; Laundry room
- Laundry & utility: Dedicated laundry room
Neighborhood map
What this means for you Summary
Snapshot
- This is a 2-bed/1.0-bath single-family listed at $125k.
Deal economics
- At list price, monthly cash flow is $145 ($2k/yr) — positive.
- The deal already cash-flows at list — no discount required.
- Meets the 1% rule at list price ($2k rent vs $125k).
- Recommended offer: $121k (3.0% below list) — sets the bar for market timing.
- Cap rate 7.7% vs local median 5.8% in Lansing — top-decile yield for the area; either an underpriced asset or a hidden risk that comps aren't pricing in. Stress-test before assuming the spread holds.
Location & tenants
- Location reads 73/100 on livability (#296 in IL) — a middle-class / working-renter tenant base. Strengths: commute A+, cost of living A+, housing A+; Watch: schools D+, crime D+, health & safety D+.
- Thornton Fractional Twp Hsd 215 (suburban): math 9% / reading 13% proficiency, ranked #563 of 620 in IL (top 91%) — low school quality limits family demand, transient renter base, plan for 1-2y turnover.
- Market conditions: 132 active listings in the ZIP; 10 comparable units currently listed for rent nearby; rentals at typical pace (median 21d on market — plan ~3-4 weeks tenant-placement turnaround); solid renter incomes; 6,272 units permitted in Cook County in 2024 (4,658 in 5+ unit buildings).
Forward outlook
- Local home prices are declining (-3.0%/yr); year-one equity from $864 of loan paydown is wiped out by about $4k of value loss. Plan a longer hold.
Negotiation context
- It's been on market 53 days — a 3% lower offer ($121k) is reasonable based on typical stale-listing flexibility.
- 5 sale attempts since 8y ago with the ask held roughly flat each time — persistent listings suggest the price (not the market) is what's stuck; bring a comps-based counter.
- Current owner paid $49k; list at $125k implies a 155% gain — meaningful room to come down on a strong offer.
Risks & watch-outs
- Watch-outs: property tax is 3.5% of price; built in 1953 — expect roof / HVAC / electrical / plumbing capex.
- Climate carrying-cost: moderate flood risk — expect insurance premiums to compound above CPI over the hold.
Questions for the listing agent
- It's been on market 53 days. Have you received any prior offers? Is the seller open to a 3% concession, seller financing, or rate buy-down credit?
- Built in 1953 — when were the roof, HVAC, electrical panel, plumbing, and water heater last replaced?
- Property tax is high relative to price — has the assessment been appealed recently, and will the sale trigger a re-assessment?
- Is there a deadline driving the sale (1031 exchange, divorce, estate, relocation)? That informs how much negotiation room exists.
- Schools are D-rated, which usually means shorter tenancies and higher turnover. Who's the typical renter profile here, and what's been the actual vacancy rate?
- Crime grade is D in this area — have there been break-ins, vandalism, or insurance claims at this property in the last 3 years? What carrier currently insures it and at what premium?
- What's the average days-on-market for RENTAL listings here right now (not sales)? A rising rental-DOM trend means longer vacancies and softer asking-rent achievability than the comps imply.
- What's the recent tenant-quality profile in this submarket — average credit score on applications, eviction rate, late-payment / NSF rate, and stable-employment percentage? A property-management company in the area should have these aggregated.
- How much new for-sale + rental construction is in the pipeline within 1–3 miles? Heavy new supply typically softens prices + rents 12–24 months out; constrained supply supports both.
Investment metrics
- 1% rule
- 1.23% ✓
- Cap rate
- 7.68%
- Cash-on-cash
- 4.96%
- DSCR
- 1.22
- GRM
- 6.8
CMA / ARV
- ARV (on-the-fly)
- $137,788
- Comps found
- 12
Show comp detail 12 sales within ~0.75 mi
| Address | Dist | Beds/Ba | Sqft | Sold | Price | $/sf | Match |
|---|---|---|---|---|---|---|---|
| 1554 Burnham Ave | 0.17mi | 2/1.0 | 945 (+2%) | 2mo | $125,000 | $132 | 88 |
| 17157 Chicago Ave | 0.25mi | 3/1.0 (+1) | 931 (0%) | 4mo | $179,800 | $193 | 80 |
| 17222 Roy St | 0.38mi | 2/1.0 | 945 (+2%) | 1mo | $149,900 | $159 | 79 |
| 17115 Park Ave | 0.15mi | 3/1.0 (+1) | 1,030 (+11%) | 2mo | $179,999 | $175 | 69 |
| 1404 Burnham Ave | 0.51mi | 2/1.0 | 945 (+2%) | 7mo | $77,595 | $82 | 68 |
| 17130 Park Ave | 0.18mi | 2/1.0 | 806 (-13%) | 7mo | $155,000 | $192 | 63 |
| 17053 Lorenz Ave | 0.10mi | 3/1.0 (+1) | 1,070 (+15%) | 4mo | $120,000 | $112 | 63 |
| 1351 Gordon Ave | 0.71mi | 2/1.0 | 945 (+2%) | 7mo | $140,000 | $148 | 58 |
| 1501 Freeland Ave | 0.49mi | 3/1.0 (+1) | 1,000 (+7%) | 9mo | $110,000 | $110 | 52 |
| 1481 Lincoln Pl | 0.56mi | 3/1.5 (+1) | 1,047 (+12%) | 6mo | $85,000 | $81 | 41 |
| 17557 Burnham Ave | 0.74mi | 3/1.0 (+1) | 1,008 (+8%) | 7mo | $189,900 | $188 | 41 |
| 3346 Bernice Rd | 0.59mi | 3/1.5 (+1) | 1,056 (+13%) | 7mo | $155,000 | $147 | 38 |
Match score weights: distance 35% · size 25% · config 20% · recency 20%. Top-matched comps best support the ARV.
Projected returns pro-forma
-3.0% appreciation · 3.0% rent growth · sell at horizon
- IRR
- -8.5%
- Equity multiple
- 0.69×
- Total profit
- $-10,888
- Equity at exit
- $18,638
- IRR
- 1.2%
- Equity multiple
- 1.09×
- Total profit
- $2,999
- Equity at exit
- $10,808
Cash invested: $35,000 (down + closing). Projections, not guarantees.
Landlord ↔ Tenant lean methodology
- Overall (STATE)
- 43 Moderately Tenant-Leaning
- State Illinois
- 43 Moderately Tenant-Leaning · D+7
- County
- — inherits STATE
- City
- — inherits STATE
ZIP-level market 60438
- Active inventory
- 132
- Price-to-rent
- 6.8×
Monthly cashflow live
- Estimated rent
- $1,538 high interval (Pro) →
- Mortgage (P&I)
- −$656
- Tax from tax record
- −$363 /mo · $4,355/yr
- Insurance
- −$52
- HOA
- −$0
- Vacancy / Maint / Mgmt
- −$323
- Net cashflow
- $145
Break-even live
UW: 25.0% down · 7.5% · 30yr · 1.5% tax · 5.0% vac · 8.0% maint · 8.0% mgmt
Financing live
Cash to close
- Down payment
- $31,250
- Closing costs
- $3,750
- Reserves months
- —
- Total cash needed
- —
Loan-product check · same deal, 3 products live
Conventional
25% down · 7.5% · 30yr
- Down + closing
- —
- Monthly P&I
- —
- Monthly cashflow
- —
- DSCR
- —
- Eligible?
- —
Personal DTI + credit; lowest rate.
DSCR
20% down · 8.5% · 30yr
- Down + closing
- —
- Monthly P&I
- —
- Monthly cashflow
- —
- DSCR
- —
- Eligible?
- —
No personal income docs; deal must DSCR.
Hard money
10% down · 12.0% · 12mo
- Down + closing
- —
- Monthly P&I
- —
- Monthly cashflow
- —
- DSCR
- —
- Eligible?
- —
Short-term bridge; refi at stabilization.
Rent comps 10 comps
| Address | Beds | Baths | Sqft | Rent | $/sqft | DOM | Units | Dist |
|---|---|---|---|---|---|---|---|---|
| 3069 Bernice Rd Apt 2S Lansing, IL | 3.0 | 1.0 | 950 | $1,535 | $1.62 | 3d | 1 | 0.48mi |
| 3069 Bernice Rd Apt 2N Lansing, IL | 3.0 | 1.0 | 950 | $1,535 | $1.62 | 20d | 1 | 0.48mi |
| 3023 Bernice Rd Apt 2S Lansing, IL | 3.0 | 1.0 | 1000 | $1,600 | $1.60 | 1d | 1 | 0.49mi |
| 1539 Wentworth Ave Unit 3W Calumet City, IL | 3.0 | 1.0 | 1100 | $1,700 | $1.55 | 12d | 1 | 0.68mi |
| 1338 Wentworth Ave Unit 1338 Calumet City, IL | 2.0 | 1.0 | 800 | $1,430 | $1.79 | 24d | 1 | 0.91mi |
| 3649 173rd Ct Lansing, IL | 2.0 | 2.0 | 972 | $1,357 | $1.40 | 24d | 1 | 0.91mi |
| 3020 178th St Unit C1 Lansing, IL | 2.0 | 1.0 | 900 | $1,550 | $1.72 | 1d | 1 | 0.95mi |
| 3020 178th St Apt C7 Lansing, IL | 2.0 | 1.0 | 900 | $1,550 | $1.72 | 24d | 1 | 0.95mi |
| 17723 Exchange Ave Unit 17723-1N Lansing, IL | 3.0 | 2.0 | 1100 | $1,800 | $1.64 | 1d | 1 | 1.01mi |
| 230 Wildwood Rd Unit 103 Hammond, IN | 1.0 | 1.0 | 750 | $1,295 | $1.73 | 24d | 1 | 1.47mi |
Listing history 25 events
-
2026-06-18days on market $125,000 Active 53 DOM
-
2026-06-17days on market $125,000 Active 52 DOM
-
2026-06-16days on market $125,000 Active 51 DOM
-
2026-06-15days on market $125,000 Active 50 DOM
-
2026-06-13days on market $125,000 Active 48 DOM
-
2026-06-09days on market $125,000 Active 44 DOM
-
2026-06-08days on market $125,000 Active 43 DOM
-
2026-06-07days on market $125,000 Active 42 DOM
-
2026-06-04days on market $125,000 Active 39 DOM
-
2026-06-03days on market $125,000 Active 38 DOM
-
2026-06-02days on market $125,000 Active 37 DOM
-
2026-06-01days on market $125,000 Active 36 DOM
-
2026-05-31days on market $125,000 Active 35 DOM
-
2026-04-26$125,000 Active
-
2026-02-17historical Contingent - No Showings
-
2026-02-12historical
-
2026-01-28Active
-
2026-01-28historical
-
2026-01-19Active
-
2018-06-26soldstatus $49,000
-
2018-06-14soldstatus $49,000 Closed Sale
-
2018-04-28historical Contingent
-
2018-04-28status Reactivated
-
2018-04-19historical Contingent
-
2018-04-09$44,800 New
ⓘ Source: listings_history table (triggers on properties + properties_extension) + one-shot
backfill from property_details.listing_events for pre-trigger history.
Tax reassessment forecast IL · Partial reset (capped growth)
- Current annual tax
- $4,355 · $363/mo
- Projected year-2 tax
- $4,355 · $363/mo
- Expected delta
- $0/yr ($0/mo · 0.0%)
ⓘ Screening estimate from a state-policy table — verify with the county assessor before closing.
Climate risk First Street
- Flood 5/10 Major FEMA zone X (shaded) · 24% chance over 30 yrs
- Wildfire 1/10 Low
- Heat 3/10 Moderate 7 d/yr ≥102°F today · 15 d/yr by 30 yrs out
- Wind 2/10 Low
- Air quality 4/10 Moderate 5 unhealthy d/yr today · 6 by 30 yrs out
Nearby sold comps map
Loading sold comps map…
Walkable amenities ~0.75 mi
Loading nearby amenities…
Taxation est. · year 1
- Rental income
- $18,459
- − Mortgage interest
- −$7,002
- − Property taxes
- −$4,355
- − Insurance
- −$625
- − Repairs & maintenance
- −$1,477
- − Management
- −$1,477
- − Depreciation
- −$3,636
- Taxable loss
- −$112
- Est. tax savings @ 24.0%
- +$27
- After-tax cash flow
- $1,764/yr
For passive investors: Depreciation is non-cash, so a rental often shows a tax loss while cash-flowing — sheltering income. Rental losses are passive: they offset passive income freely, and up to $25,000/yr can offset ordinary (W-2) income if you actively participate and your MAGI is under $100k (phasing out to $0 by $150k); unused losses carry forward. On sale, claimed depreciation is recaptured at up to 25%, and gains may owe capital-gains tax (a 1031 exchange can defer both). Figures are a year-1 estimate at your 24.0% rate — not tax advice; consult a CPA.
Schools (NCES district)
- District
- Thornton Fractional Twp Hsd 215
- NCES district ID
- 1738940
- Math proficiency
- 9% ▼ -3.00%
- Reading proficiency
- 13% ▼ -3.00%
- Median HH income
- $48,207
- Composite
- 10.27/100
- National rank
- #9793
- State rank
- #563 of 620 in IL
Livability — Lansing
- Score
- 73/100
- State rank
- #296
- US rank
- #5698
Category grades
Schools grade is shown separately in the Schools card above.
Census & demographics
- Census place
- Lansing, IL
- County
- Cook County · 4,486,803 people
- City population
- 28,806
- Metro
- Chicago-Naperville-Elgin, IL-IN-WI
- Population (ZIP)
- 28,806
- Household income
- $75,681
- Rent vs Own
- Severe rent burden
- 830.0
Population outlook (Cook County) Hauer SSP2
- Today (2025)
- 5,347,519 people
- By 2030
- 5,357,703 · +0.2%
- By 2040
- 5,324,924 · -0.4%
- By 2050
- 5,230,762 · -2.2%
- By 2075
- 4,785,735 · -10.5%
- By 2100
- 4,188,836 · -21.7%
Race, ethnicity, and origin ACS 2023
- Neighborhood character
- Diverse neighborhood (Simpson 0.65)
- Race & ethnicity
- Black 51% White 25% Hispanic / Latino 18% Two or more races 7% Asian 2%
- Hispanic origin (detail)
- Mexican 15%
- Common ancestry
- Romanian 5% Iranian 3% Lithuanian 1%
- Foreign-born
- 10% · Canada
- Languages at home
- 83% English-only · Spanish 12% Vietnamese 1% French/Haitian/Cajun 1%
Political lean MEDSL · Cook
- 2024 margin
- Solid D (+42.0) · D 70.4% · R 28.4% · Other 1.2%
- 2008→2024 swing
- -11.4pp toward R · 2008: 53.4pp · 2024: 42.0pp
- All cycles
- 2024: D+42.0 2020: D+50.3 2016: D+53.0 2012: D+49.4 2008: D+53.4
Not yet ingested
- Civics
- —
Market trends
- HPI YoY
- ▼ -151.65%
- Current HPI
- 210.3398
- Rent YoY
- —
- Metro
- Chicago-Naperville-Elgin, IL-IN-WI
- State GDP YoY
- ▲ 1.59%
- F500 in state
- 60
Industry mix (Fortune 500 HQ in IL)
| Industry | F500 HQs | Revenue |
|---|---|---|
| Insurance | 4 | $201B |
|
||
| Consumer Goods | 4 | $87B |
|
||
| Industrial Machinery | 3 | $64B |
|
||
| Healthcare | 2 | $55B |
|
||
| Retail / Pharmacy | 1 | $148B |
|
||
| Agriculture / Food | 1 | $86B |
|
||
Price history
+179.0% since first listed12 events — show timeline
- 2026-04-26 Listed $125,000 MRED as Distributed by MLS Grid
- 2026-02-17 Contingent — MRED as Distributed by MLS Grid
- 2026-02-12 Listing Removed — MRED as Distributed by MLS Grid
- 2026-01-28 Listing Removed — MRED as Distributed by MLS Grid
- 2026-01-28 Listed — MRED as Distributed by MLS Grid
- 2026-01-19 Listed — MRED as Distributed by MLS Grid
- 2018-06-26 Sold (Public Records) $49,000 Public Records
- 2018-06-14 Sold (MLS) $49,000 MRED as Distributed by MLS Grid
- 2018-04-28 Contingent — MRED as Distributed by MLS Grid
- 2018-04-28 Relisted — MRED as Distributed by MLS Grid
- 2018-04-19 Contingent — MRED as Distributed by MLS Grid
- 2018-04-09 Listed $44,800 MRED as Distributed by MLS Grid
Property tax history
+4.8%/yrLatest (2023): $4,355 · +9.6% YoY. Source: county tax records.
Cash-flow waterfall
monthlySold comps — $/sqft
last 12 mo · ≤1 miLoading sold comps…