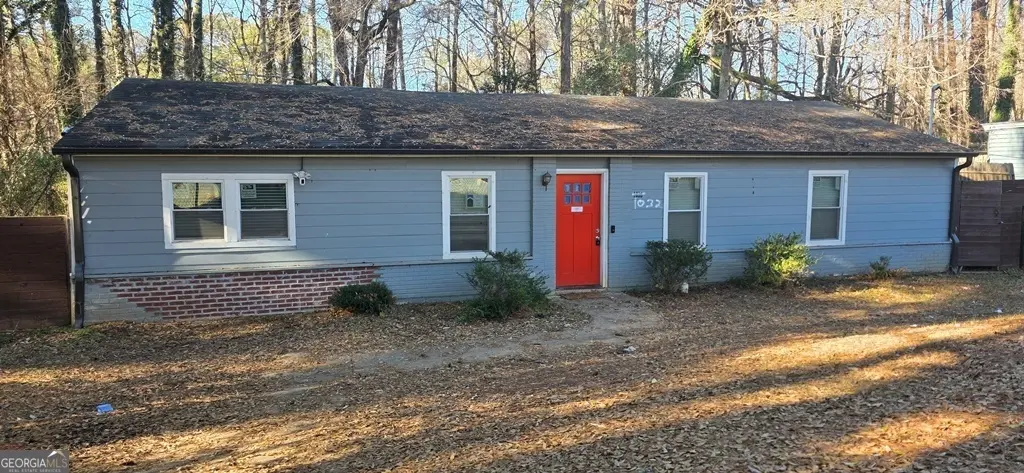
1032 Valley View Rd · Atlanta, GA
Flood risk 1/10 · Minimal
- FEMA flood zone
- X (unshaded)
- Chance of flooding over 30 yrs
- 0.0%
- Est. flood insurance / yr
- $507 – $1,088
Fire risk 3/10 · Minor
- Est. fire insurance / yr
- $963 – $1,789
Heat risk 5/10 · Moderate
- Hot days now (above 104°F)
- 7 days/yr
- Hot days in 30 yrs
- 18 days/yr
Wind risk 6/10 · Moderate
- Chance of severe wind over 30 yrs
- 27.0%
Air-quality risk 4/10 · Minor
- Unhealthy air days now
- 4 days/yr
- Unhealthy air days in 30 yrs
- 6 days/yr
Risk factors via First Street. Map © Google.
Why this score? — see what drove the B- grade
The composite is a weighted blend of 9 inputs, each scored 0–100. Each bar is that input's sub-score; the figure is the points it added to the 100-point composite (weight × sub-score).
- Cash flow +23.5/30.0
- ARV discount +15.0/15.0
- DSCR +7.6/10.0
- 1% rule +6.5/10.0
- Livability +4.2/5.0
- Rent growth +3.3/5.0
- Schools +2.7/10.0
- Condition / age +2.5/5.0
- Appreciation +0.0/10.0
$170,100
🖨 Deal sheet 📄 Offer letter ✓ Due diligence
Listing remarks MLS
Not move in ready, bank owned. Great investment opportunity for the savvy investor! Home is ready for remodeling. Three bedrooms and 1 full bath, the possibilities are endless! Sold as-is, no disclosures, cash only
Key facts
- Added bedroom
- Original bathroom
- Second bathroom
Tags
Neighborhood map
What this means for you Summary
Snapshot
- This is a 3-bed/1.0-bath single-family listed at $170k.
Deal economics
- At list price, monthly cash flow is $319 ($4k/yr) — positive.
- The deal already cash-flows at list — no discount required.
- Meets the 1% rule at list price ($2k rent vs $170k).
- Recommended offer: $168k (1.5% below list) — sets the bar for market timing.
- Cap rate 8.5% vs local median 3.1% in Atlanta — top-decile yield for the area; either an underpriced asset or a hidden risk that comps aren't pricing in. Stress-test before assuming the spread holds.
Location & tenants
- Location reads 83/100 on livability (#6 in GA, #919 nationally) — a professional / high-income tenant draw. Strengths: amenities A+, commute A+, housing A+; Watch: schools C-, cost of living C-.
- Atlanta Public Schools (urban): math 28% / reading 35% proficiency, ranked #80 of 174 in GA (top 46%) — families likely to look elsewhere, expect single-tenant / working-renter base with shorter leases; 71% free/reduced lunch — lower-income household profile, screen leases tightly.
- Market conditions: Rents rising (+3.2%/yr); 378 active listings in the ZIP; 15 comparable units currently listed for rent nearby; rentals at typical pace (median 24d on market — plan ~3-4 weeks tenant-placement turnaround); 11,565 units permitted in Fulton County in 2024 (8,159 in 5+ unit buildings).
- At $1,952/mo this rent would consume 46% of the median local household income ($51k/yr) (locally 2962% of renters already pay >50% of income on rent) — very limited rent-growth headroom before tenants either downsize or default.
Forward outlook
- Local home prices are declining (-3.0%/yr); year-one equity from $1k of loan paydown is wiped out by about $5k of value loss. Plan a longer hold.
- Fulton County population projected at +38% by 2050 — long-run rental-demand tailwind backs the buy-and-hold thesis.
Negotiation context
- It's been on market 24 days — a 2% lower offer ($168k) is reasonable based on typical stale-listing flexibility.
- 4 sale attempts since 9y ago; this cycle's ask has dropped $55k (24%) from the opening price — seller is motivated, your offer sets the floor, not the list.
- Current owner paid $10k; list at $170k implies a 1601% gain — meaningful room to come down on a strong offer.
Risks & watch-outs
- Watch-outs: built in 1959 — expect roof / HVAC / electrical / plumbing capex.
- Climate carrying-cost: major wind risk, 27% chance of damaging wind over 30y; extreme-heat days projected 7→18/yr by 2055 (HVAC capex compounding) — expect insurance premiums to compound above CPI over the hold.
Questions for the listing agent
- Built in 1959 — when were the roof, HVAC, electrical panel, plumbing, and water heater last replaced?
- Is there a deadline driving the sale (1031 exchange, divorce, estate, relocation)? That informs how much negotiation room exists.
- What's the average days-on-market for RENTAL listings here right now (not sales)? A rising rental-DOM trend means longer vacancies and softer asking-rent achievability than the comps imply.
- What's the recent tenant-quality profile in this submarket — average credit score on applications, eviction rate, late-payment / NSF rate, and stable-employment percentage? A property-management company in the area should have these aggregated.
- How much new for-sale + rental construction is in the pipeline within 1–3 miles? Heavy new supply typically softens prices + rents 12–24 months out; constrained supply supports both.
Investment metrics
- 1% rule
- 1.15% ✓
- Cap rate
- 8.54%
- Cash-on-cash
- 8.03%
- DSCR
- 1.36
- GRM
- 7.3
CMA / ARV
- ARV (on-the-fly)
- $302,500
- Comps found
- 12
Show comp detail 12 sales within ~0.75 mi
| Address | Dist | Beds/Ba | Sqft | Sold | Price | $/sf | Match |
|---|---|---|---|---|---|---|---|
| 1974 Thomasville Estates Dr SE | 0.17mi | 3/2.0 | 1,299 (-6%) | 2mo | $286,000 | $220 | 77 |
| 1026 Valley View Rd | 0.01mi | 4/2.0 (+1) | 1,314 (-4%) | 11mo | $165,000 | $126 | 74 |
| 947 Rebel Forest Dr | 0.36mi | 3/2.0 | 1,400 (+2%) | 11mo | $295,000 | $211 | 67 |
| 2413 Rose Palm Pl | 0.67mi | 3/2.5 | 1,364 (-1%) | 2mo | $317,000 | $232 | 60 |
| 926 Natham Dr | 0.31mi | 3/2.0 | 1,230 (-10%) | 9mo | $280,000 | $228 | 56 |
| 2166 Ohara Pl SE | 0.20mi | 4/2.5 (+1) | 1,500 (+9%) | 14mo | $340,000 | $227 | 53 |
| 776 Norwood Rd SE | 0.69mi | 3/2.5 | 1,444 (+5%) | 2mo | $270,000 | $187 | 52 |
| 1065 Kipling St SE | 0.75mi | 3/2.0 | 1,450 (+6%) | 2mo | $339,000 | $234 | 50 |
| 2366 Forrest Park Rd SE | 0.35mi | 3/2.0 | 1,176 (-14%) | 12mo | $194,000 | $165 | 45 |
| 1135 Dobbs Dr | 0.67mi | 3/2.0 | 1,272 (-8%) | 10mo | $170,000 | $134 | 44 |
| 1930 Phillips Dr SE | 0.67mi | 3/2.0 | 1,540 (+12%) | 6mo | $245,000 | $159 | 40 |
| 692 Rose Palm Ln | 0.72mi | 3/2.5 | 1,470 (+7%) | 13mo | $365,000 | $248 | 38 |
Match score weights: distance 35% · size 25% · config 20% · recency 20%. Top-matched comps best support the ARV.
Projected returns pro-forma
-3.0% appreciation · 3.23% rent growth · sell at horizon
- IRR
- -3.8%
- Equity multiple
- 0.86×
- Total profit
- $-6,751
- Equity at exit
- $25,362
- IRR
- 6.2%
- Equity multiple
- 1.47×
- Total profit
- $22,368
- Equity at exit
- $14,707
Cash invested: $47,628 (down + closing). Projections, not guarantees.
Landlord ↔ Tenant lean methodology
- Overall (STATE)
- 90 Strongly Landlord-Friendly
- State Georgia
- 90 Strongly Landlord-Friendly · R+3
- County
- — inherits STATE
- City
- — inherits STATE
ZIP-level market 30315
- Rents YoY
- 3.2%
- Active inventory
- 378
- Price-to-rent
- 7.3×
Monthly cashflow live
- Estimated rent
- $1,952 high interval (Pro) →
- Mortgage (P&I)
- −$892
- Tax from tax record
- −$260 /mo · $3,125/yr
- Insurance
- −$71
- HOA
- −$0
- Vacancy / Maint / Mgmt
- −$410
- Net cashflow
- $319
Break-even live
UW: 25.0% down · 7.5% · 30yr · 1.5% tax · 5.0% vac · 8.0% maint · 8.0% mgmt
Financing live
Cash to close
- Down payment
- $42,525
- Closing costs
- $5,103
- Reserves months
- —
- Total cash needed
- —
Loan-product check · same deal, 3 products live
Conventional
25% down · 7.5% · 30yr
- Down + closing
- —
- Monthly P&I
- —
- Monthly cashflow
- —
- DSCR
- —
- Eligible?
- —
Personal DTI + credit; lowest rate.
DSCR
20% down · 8.5% · 30yr
- Down + closing
- —
- Monthly P&I
- —
- Monthly cashflow
- —
- DSCR
- —
- Eligible?
- —
No personal income docs; deal must DSCR.
Hard money
10% down · 12.0% · 12mo
- Down + closing
- —
- Monthly P&I
- —
- Monthly cashflow
- —
- DSCR
- —
- Eligible?
- —
Short-term bridge; refi at stabilization.
Rent comps 15 comps
| Address | Beds | Baths | Sqft | Rent | $/sqft | DOM | Units | Dist |
|---|---|---|---|---|---|---|---|---|
| 1144 Regis Rd SE Atlanta, GA | 3.0 | 1.0 | 1430 | $1,725 | $1.21 | 24d | 1 | 0.16mi |
| 1317 Redford Dr SE Atlanta, GA | 3.0 | 2.0 | 1137 | $2,100 | $1.85 | 24d | 1 | 0.24mi |
| 1037 Rebel Forest Dr SE Atlanta, GA | 3.0 | 2.0 | 1075 | $1,750 | $1.63 | 24d | 1 | 0.34mi |
| 871 Hargis St SE Atlanta, GA | 2.0 | 2.0 | 1040 | $1,800 | $1.73 | 24d | 1 | 0.49mi |
| 976 McKay Dr SE Atlanta, GA | 3.0 | 1.0 | 1200 | $1,695 | $1.41 | 3d | 1 | 0.59mi |
| 585 McWilliams Rd SE #2402 Atlanta, GA | 2.0 | 2.5 | 1548 | $2,200 | $1.42 | 3d | 1 | 0.88mi |
| 585 McWilliams Rd SE #104 Atlanta, GA | 2.0 | 3.0 | 1500 | $2,078 | $1.39 | 20d | 1 | 0.91mi |
| 585 McWilliams Rd SE #1406 Atlanta, GA | 3.0 | 2.5 | 1742 | $2,400 | $1.38 | 24d | 1 | 0.98mi |
| 972 Welch St SE Atlanta, GA | 3.0 | 2.0 | 1100 | $900 | $0.82 | 5d | 1 | 1.20mi |
| 386 Lindsey Dr SE Atlanta, GA | 3.0 | 1.0 | 1040 | $1,808 | $1.74 | 15d | 1 | 1.32mi |
| 837 Forrest Cir SE Atlanta, GA | 3.0 | 2.0 | 1500 | $1,845 | $1.23 | 24d | 1 | 1.35mi |
| 2087 Lakewood Trl SE Atlanta, GA | 3.0 | 2.5 | 1056 | $2,256 | $2.14 | 24d | 1 | 1.36mi |
| 3080 Forrest Park Rd SE Atlanta, GA | 3.0 | 2.0 | 1828 | $1,950 | $1.07 | 24d | 1 | 1.44mi |
| 831 River Gardens Dr Atlanta, GA | 3.0 | 2.5 | 1680 | $2,800 | $1.67 | 24d | 1 | 1.46mi |
| 752 McDonough Blvd SE Atlanta, GA | 3.0 | 2.0 | 1120 | $1,895 | $1.69 | 24d | 1 | 1.46mi |
Listing history 30 events
-
2026-06-15statusdays on market $170,100 Pending 24 DOM
-
2026-06-13days on market $170,100 Active Under Contract 23 DOM
-
2026-06-13days on market $170,100 Active Under Contract 22 DOM
-
2026-06-10status $170,100 Active Under Contract 19 DOM
-
2026-06-09days on market $170,100 Active 19 DOM
-
2026-06-08days on market $170,100 Active 18 DOM
-
2026-06-07days on market $170,100 Active 17 DOM
-
2026-06-04days on market $170,100 Active 14 DOM
-
2026-06-03days on market $170,100 Active 13 DOM
-
2026-06-02days on market $170,100 Active 12 DOM
-
2026-06-01days on market $170,100 Active 11 DOM
-
2026-05-31days on market $170,100 Active 10 DOM
-
2026-05-18historical
-
2026-04-20price $179,900
-
2026-04-02status Back On Market
-
2026-03-18historical
-
2026-02-19price $194,900
-
2026-02-02price $214,900
-
2025-12-19$224,900 New
-
2024-07-31soldstatus $10,000
-
2023-08-02soldstatus $372,644
-
2018-02-12soldstatus $32,000 Sold 214-char remark
Show marketing remark (214 chars)
Not move in ready, bank owned. Great investment opportunity for the savvy investor! Home is ready for remodeling. Three bedrooms and 1 full bath, the possibilities are endless! Sold as-is, no disclosures, cash only
-
2018-02-12soldstatus $32,000 Sold
Show marketing remark (214 chars)
Not move in ready, bank owned. Great investment opportunity for the savvy investor! Home is ready for remodeling. Three bedrooms and 1 full bath, the possibilities are endless! Sold as-is, no disclosures, cash only
-
2018-01-31status Pending 214-char remark
Show marketing remark (214 chars)
Not move in ready, bank owned. Great investment opportunity for the savvy investor! Home is ready for remodeling. Three bedrooms and 1 full bath, the possibilities are endless! Sold as-is, no disclosures, cash only
-
2018-01-31status Under Contract
Show marketing remark (214 chars)
Not move in ready, bank owned. Great investment opportunity for the savvy investor! Home is ready for remodeling. Three bedrooms and 1 full bath, the possibilities are endless! Sold as-is, no disclosures, cash only
-
2017-10-07$35,000 Active 214-char remark
Show marketing remark (214 chars)
Not move in ready, bank owned. Great investment opportunity for the savvy investor! Home is ready for remodeling. Three bedrooms and 1 full bath, the possibilities are endless! Sold as-is, no disclosures, cash only
-
2017-10-07$35,000 New
Show marketing remark (214 chars)
Not move in ready, bank owned. Great investment opportunity for the savvy investor! Home is ready for remodeling. Three bedrooms and 1 full bath, the possibilities are endless! Sold as-is, no disclosures, cash only
-
2003-10-17soldstatus $69,500
-
2002-05-07soldstatus $63,000
-
1984-04-24soldstatus $31,900
ⓘ Source: listings_history table (triggers on properties + properties_extension) + one-shot
backfill from property_details.listing_events for pre-trigger history.
Tax reassessment forecast GA · Resets to sale price
- Current annual tax
- $3,125 · $260/mo
- Projected year-2 tax
- $3,125 · $260/mo
- Expected delta
- $0/yr ($0/mo · 0.0%)
ⓘ Screening estimate from a state-policy table — verify with the county assessor before closing.
Climate risk First Street
- Flood 1/10 Low FEMA zone X (unshaded) · 0% chance over 30 yrs
- Wildfire 3/10 Moderate
- Heat 5/10 Major 7 d/yr ≥104°F today · 18 d/yr by 30 yrs out
- Wind 6/10 Major 27% chance of damaging wind over 30 yrs
- Air quality 4/10 Moderate 4 unhealthy d/yr today · 6 by 30 yrs out
Nearby sold comps map
Loading sold comps map…
Walkable amenities ~0.75 mi
Loading nearby amenities…
Taxation est. · year 1
- Rental income
- $23,424
- − Mortgage interest
- −$9,528
- − Property taxes
- −$3,125
- − Insurance
- −$850
- − Repairs & maintenance
- −$1,874
- − Management
- −$1,874
- − Depreciation
- −$4,948
- Taxable income
- $1,224
- Est. tax owed @ 24.0%
- −$294
- After-tax cash flow
- $3,531/yr
For passive investors: Depreciation is non-cash, so a rental often shows a tax loss while cash-flowing — sheltering income. Rental losses are passive: they offset passive income freely, and up to $25,000/yr can offset ordinary (W-2) income if you actively participate and your MAGI is under $100k (phasing out to $0 by $150k); unused losses carry forward. On sale, claimed depreciation is recaptured at up to 25%, and gains may owe capital-gains tax (a 1031 exchange can defer both). Figures are a year-1 estimate at your 24.0% rate — not tax advice; consult a CPA.
Schools (NCES district)
- District
- Atlanta Public Schools
- NCES district ID
- 1300120
- Math proficiency
- 28% ▼ -6.00%
- Reading proficiency
- 35% ▼ -2.00%
- Median HH income
- $48,306
- Composite
- 27.27/100
- National rank
- #7006
- State rank
- #80 of 174 in GA
Livability — Atlanta
- Score
- 83/100
- State rank
- #6
- US rank
- #919
Category grades
Schools grade is shown separately in the Schools card above.
Census & demographics
- Census place
- Atlanta, GA
- County
- Fulton County · 1,094,430 people
- City population
- 629,525
- Metro
- Atlanta-Sandy Springs-Alpharetta, GA
- Population (ZIP)
- 34,264
- Household income
- $50,822
- Rent vs Own
- Severe rent burden
- 2962.0
Population outlook (Fulton County) Hauer SSP2
- Today (2025)
- 1,203,707 people
- By 2030
- 1,299,706 · +8.0%
- By 2040
- 1,488,256 · +23.6%
- By 2050
- 1,664,580 · +38.3%
- By 2075
- 2,036,072 · +69.2%
- By 2100
- 2,222,402 · +84.6%
Race, ethnicity, and origin ACS 2023
- Neighborhood character
- Predominantly Black (72%)
- Race & ethnicity
- Black 72% White 14% Hispanic / Latino 10% Two or more races 4%
- Hispanic origin (detail)
- Mexican 4%
- Common ancestry
- Romanian 1% Italian 1% Lithuanian 1%
- Foreign-born
- 5% · Canada
- Languages at home
- 90% English-only · Spanish 9% French/Haitian/Cajun 1%
Political lean MEDSL · Fulton
- 2024 margin
- Solid D (+44.9) · D 71.9% · R 27.0% · Other 1.1%
- 2008→2024 swing
- +9.8pp toward D · 2008: 35.0pp · 2024: 44.9pp
- All cycles
- 2024: D+44.9 2020: D+46.4 2016: D+42.1 2012: D+29.6 2008: D+35.0
Not yet ingested
- Civics
- —
Market trends
- HPI YoY
- ▼ -281.87%
- Current HPI
- 176.673
- Rent YoY
- ▲ 3.23%
- Metro
- Atlanta-Sandy Springs-Alpharetta, GA
- State GDP YoY
- ▲ 2.66%
- F500 in state
- 28
Industry mix (Fortune 500 HQ in GA)
| Industry | F500 HQs | Revenue |
|---|---|---|
| Paper / Packaging | 2 | $29B |
|
||
| Retail | 1 | $160B |
|
||
| Transportation / Logistics | 1 | $91B |
|
||
| Airlines | 1 | $62B |
|
||
| Consumer Goods | 1 | $47B |
|
||
| Utilities | 1 | $25B |
|
||
Price history
+463.9% since first listed18 events — show timeline
- 2026-05-18 Listing Removed — GAMLS
- 2026-04-20 Price Changed $179,900 GAMLS
- 2026-04-02 Relisted — GAMLS
- 2026-03-18 Listing Removed — GAMLS
- 2026-02-19 Price Changed $194,900 GAMLS
- 2026-02-02 Price Changed $214,900 GAMLS
- 2025-12-19 Listed $224,900 GAMLS
- 2024-07-31 Sold (Public Records) $10,000 Public Records
- 2023-08-02 Sold (Public Records) $372,644 Public Records
- 2018-02-12 Sold (MLS) $32,000 GAMLS
- 2018-02-12 Sold (MLS) $32,000 FMLS
- 2018-01-31 Pending — FMLS
- 2018-01-31 Pending — GAMLS
- 2017-10-07 Listed $35,000 FMLS
- 2017-10-07 Listed $35,000 GAMLS
- 2003-10-17 Sold (Public Records) $69,500 Public Records
- 2002-05-07 Sold (Public Records) $63,000 Public Records
- 1984-04-24 Sold (Public Records) $31,900 Public Records
Property tax history
+6.3%/yrLatest (2025): $3,125 · -21.7% YoY. Source: county tax records.
Cash-flow waterfall
monthlySold comps — $/sqft
last 12 mo · ≤1 miLoading sold comps…