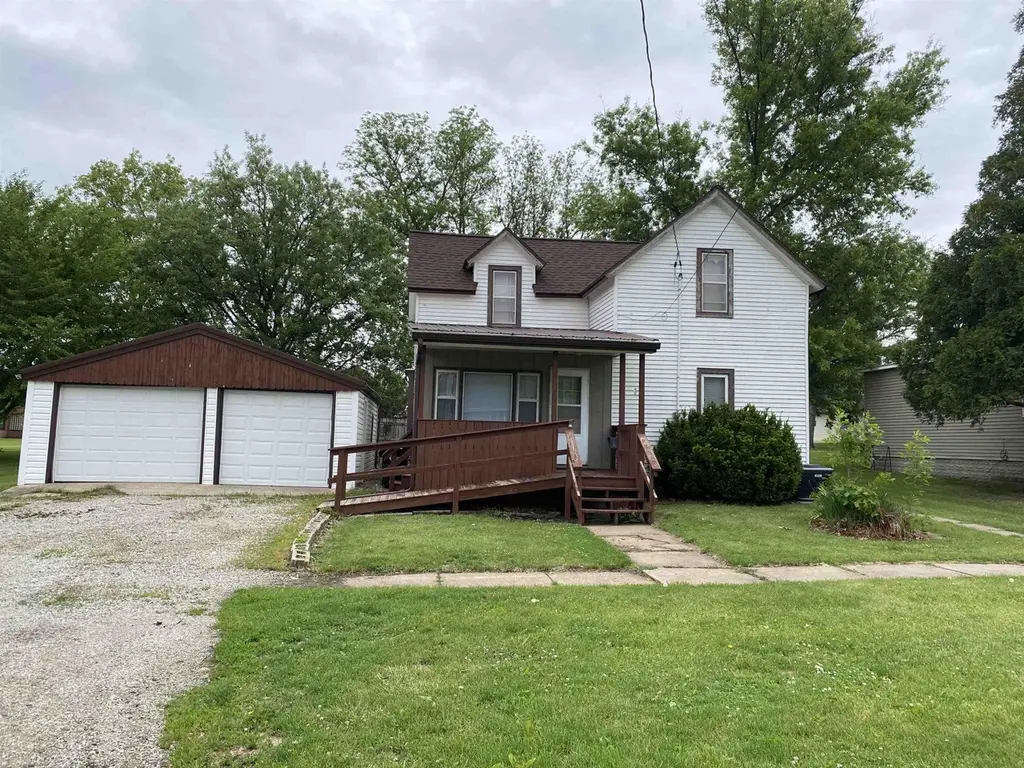
907 Iowa St · Dysart, IA
Flood risk 3/10 · Minor
- FEMA flood zone
- X (unshaded)
- Chance of flooding over 30 yrs
- 0.2%
- Est. flood insurance / yr
- $473 – $860
Fire risk 1/10 · Minimal
- Est. fire insurance / yr
- $902 – $1,676
Heat risk 2/10 · Minimal
- Hot days now (above 103°F)
- 7 days/yr
- Hot days in 30 yrs
- 15 days/yr
Wind risk 2/10 · Minimal
- Chance of severe wind over 30 yrs
- —
Air-quality risk 1/10 · Minimal
- Unhealthy air days now
- 0 days/yr
- Unhealthy air days in 30 yrs
- 0 days/yr
Risk factors via First Street. Map © Google.
Why this score? — see what drove the C- grade
The composite is a weighted blend of 9 inputs, each scored 0–100. Each bar is that input's sub-score; the figure is the points it added to the 100-point composite (weight × sub-score).
- Cash flow +14.8/30.0
- ARV discount +7.5/15.0
- Appreciation +7.2/10.0
- Schools +6.5/10.0
- DSCR +4.5/10.0
- 1% rule +4.3/10.0
- Livability +3.9/5.0
- Rent growth +2.5/5.0
- Condition / age +2.5/5.0
$99,500
🖨 Deal sheet 📄 Offer letter ✓ Due diligence
Listing remarks MLS
This home has had many updates and a great location, no neighbor to west and backs up to Elementary and within 1 block to Pool. The main floor offers a large living room with an open concept to the kitchen. The kitchen has a breakfast bar, dishwasher, room for table and chairs and lots of countertop and cupboards, newer gas range and refrigerator included. Off the kitchen is a room for den or craft room with main floor laundry ( washer and dryer included). There is a nice bedroom and full bath also on main floor. Upstairs offers 2 bedrooms which have not had anything done or updated. Nice double garage plus an additional single behind making room for 3 vehicles. Improvements and updates include new carpet(2025)some replacement windows, roof, furnace, central air have been replaced over the years. Great Lot with a Great Location!! CHEAPER THAN RENT!!!! Plus a ramp and steps on a front porch and entry to the home.
Key facts
- Double garage
- Newer gas range
- Main floor laundry
Tags
Neighborhood map
What this means for you Summary
Snapshot
- This is a 3-bed/1.0-bath single-family listed at $100k.
Deal economics
- At list price, monthly cash flow is $27 ($324/yr) — positive.
- The deal already cash-flows at list — no discount required.
- To meet the 1% rule (rent ≥ 1% of price), the offer needs to be $92k (7.1% below list).
- Recommended offer: $91k (9.0% below list) — sets the bar for market timing.
Location & tenants
- Location reads 77/100 on livability (#158 in IA, #2,881 nationally) — a middle-class / working-renter tenant base. Strengths: schools A+, crime A+, cost of living A+; Watch: employment C-, amenities F, commute F.
- Union Community School District (rural): math 77% / reading 75% proficiency, ranked #53 of 289 in IA (top 18%) — strong family-tenant draw, lease renewals of 3-5y typical; only 20% free/reduced lunch — higher-income household profile.
- Market conditions: 27 active listings in the ZIP; 17 units permitted in Tama County in 2024 (0 in 5+ unit buildings).
Forward outlook
- In year one you build about $5k of equity ($688 loan paydown + $4k appreciation (4.4% local appreciation)).
- Tama County population projected at -15% by 2050 — secular population decline; favor cash flow + early exit over multi-decade hold.
- At projected returns (4.4% appreciation + 3.0% rent growth), your $28k cash investment doubles in ~5 years — after that, you're playing with house money.
- By year 7, paydown + projected appreciation supports a ~$32k cash-out refi (75% LTV) — recoverable capital for the next deal without selling this one.
Negotiation context
- It's been on market 105 days — a 9% lower offer ($91k) is reasonable based on typical stale-listing flexibility.
- 2 sale attempts since 5y ago; this cycle's ask has dropped $10k (9%) from the opening price — seller is motivated, your offer sets the floor, not the list.
Risks & watch-outs
- Watch-outs: built in 1900 — expect roof / HVAC / electrical / plumbing capex.
Questions for the listing agent
- It's been on market 105 days. Have you received any prior offers? Is the seller open to a 9% concession, seller financing, or rate buy-down credit?
- Built in 1900 — when were the roof, HVAC, electrical panel, plumbing, and water heater last replaced?
- Why hasn't it sold? Are there any deal-killer items the seller is aware of (foundation, flood, title, zoning, code violations)?
- Is there a deadline driving the sale (1031 exchange, divorce, estate, relocation)? That informs how much negotiation room exists.
- Schools are A-rated — typically a magnet for longer-tenancy family renters. What's the average tenant stay here, and is there a school-zone premium baked into asking?
- What's the average days-on-market for RENTAL listings here right now (not sales)? A rising rental-DOM trend means longer vacancies and softer asking-rent achievability than the comps imply.
- What's the recent tenant-quality profile in this submarket — average credit score on applications, eviction rate, late-payment / NSF rate, and stable-employment percentage? A property-management company in the area should have these aggregated.
- How much new for-sale + rental construction is in the pipeline within 1–3 miles? Heavy new supply typically softens prices + rents 12–24 months out; constrained supply supports both.
Investment metrics
- 1% rule
- 0.93% ✗
- Cap rate
- 6.62%
- Cash-on-cash
- 1.16%
- DSCR
- 1.05
- GRM
- 9.0
CMA / ARV
No comps found within radius.
Projected returns pro-forma
4.4% appreciation · 3.0% rent growth · sell at horizon
- IRR
- 12.4%
- Equity multiple
- 1.77×
- Total profit
- $21,326
- Equity at exit
- $52,824
- IRR
- 13.6%
- Equity multiple
- 3.32×
- Total profit
- $64,745
- Equity at exit
- $88,349
Cash invested: $27,860 (down + closing). Projections, not guarantees.
Landlord ↔ Tenant lean methodology
- Overall (STATE)
- 83 Strongly Landlord-Friendly
- State Iowa
- 83 Strongly Landlord-Friendly · R+6
- County
- — inherits STATE
- City
- — inherits STATE
ZIP-level market 52224
- Home prices YoY
- 2.6%
- Active inventory
- 27
- Price-to-rent
- 9.0×
Monthly cashflow live
- Estimated rent
- $925 medium interval (Pro) →
- Mortgage (P&I)
- −$522
- Tax from tax record
- −$140 /mo · $1,682/yr
- Insurance
- −$41
- HOA
- −$0
- Vacancy / Maint / Mgmt
- −$194
- Net cashflow
- $27
Break-even live
UW: 25.0% down · 7.5% · 30yr · 1.5% tax · 5.0% vac · 8.0% maint · 8.0% mgmt
Financing live
Cash to close
- Down payment
- $24,875
- Closing costs
- $2,985
- Reserves months
- —
- Total cash needed
- —
Loan-product check · same deal, 3 products live
Conventional
25% down · 7.5% · 30yr
- Down + closing
- —
- Monthly P&I
- —
- Monthly cashflow
- —
- DSCR
- —
- Eligible?
- —
Personal DTI + credit; lowest rate.
DSCR
20% down · 8.5% · 30yr
- Down + closing
- —
- Monthly P&I
- —
- Monthly cashflow
- —
- DSCR
- —
- Eligible?
- —
No personal income docs; deal must DSCR.
Hard money
10% down · 12.0% · 12mo
- Down + closing
- —
- Monthly P&I
- —
- Monthly cashflow
- —
- DSCR
- —
- Eligible?
- —
Short-term bridge; refi at stabilization.
Listing history 22 events
-
2026-06-19days on market $99,500 Active 105 DOM
-
2026-06-18days on market $99,500 Active 104 DOM
-
2026-06-17days on market $99,500 Active 103 DOM
-
2026-06-16days on market $99,500 Active 102 DOM
-
2026-06-15days on market $99,500 Active 101 DOM
-
2026-06-14days on market $99,500 Active 99 DOM
-
2026-06-13days on market $99,500 Active 98 DOM
-
2026-06-10days on market $99,500 Active 96 DOM
-
2026-06-09days on market $99,500 Active 95 DOM
-
2026-06-08days on market $99,500 Active 94 DOM
-
2026-06-07days on market $99,500 Active 93 DOM
-
2026-06-02days on market $99,500 Active 88 DOM
-
2026-06-01days on market $99,500 Active 87 DOM
-
2026-05-31days on market $99,500 Active 86 DOM
-
2026-05-30days on market $99,500 Active 85 DOM
-
2026-03-06$109,500 Active 930-char remark
Show marketing remark (930 chars)
This home has had many updates and a great location, no neighbor to west and backs up to Elementary and within 1 block to Pool. The main floor offers a large living room with an open concept to the kitchen. The kitchen has a breakfast bar, dishwasher, room for table and chairs and lots of countertop and cupboards, newer gas range and refrigerator included. Off the kitchen is a room for den or craft room with main floor laundry ( washer and dryer included). There is a nice bedroom and full bath also on main floor. Upstairs offers 2 bedrooms which have not had anything done or updated. Nice double garage plus an additional single behind making room for 3 vehicles. Improvements and updates include new carpet(2025)some replacement windows, roof, furnace, central air have been replaced over the years. Great Lot with a Great Location!! CHEAPER THAN RENT!!!! Plus a ramp and steps on a front porch and entry to the home.
-
2025-09-22price $107,500
-
2025-08-09price $109,000
-
2025-05-28price $119,000
-
2021-08-11soldstatus $88,000
-
2021-08-09soldstatus $88,000
-
2021-06-24$99,900
ⓘ Source: listings_history table (triggers on properties + properties_extension) + one-shot
backfill from property_details.listing_events for pre-trigger history.
Tax reassessment forecast IA · Partial reset (capped growth)
- Current annual tax
- $1,682 · $140/mo
- Projected year-2 tax
- $1,682 · $140/mo
- Expected delta
- $0/yr ($0/mo · 0.0%)
ⓘ Screening estimate from a state-policy table — verify with the county assessor before closing.
Climate risk First Street
- Flood 3/10 Moderate FEMA zone X (unshaded) · 20% chance over 30 yrs
- Wildfire 1/10 Low
- Heat 2/10 Low 7 d/yr ≥103°F today · 15 d/yr by 30 yrs out
- Wind 2/10 Low
- Air quality 1/10 Low 0 unhealthy d/yr today · 0 by 30 yrs out
Nearby sold comps map
Loading sold comps map…
Walkable amenities ~0.75 mi
Loading nearby amenities…
Taxation est. · year 1
- Rental income
- $11,094
- − Mortgage interest
- −$5,574
- − Property taxes
- −$1,682
- − Insurance
- −$498
- − Repairs & maintenance
- −$888
- − Management
- −$888
- − Depreciation
- −$2,895
- Taxable loss
- −$1,328
- Est. tax savings @ 24.0%
- +$319
- After-tax cash flow
- $642/yr
For passive investors: Depreciation is non-cash, so a rental often shows a tax loss while cash-flowing — sheltering income. Rental losses are passive: they offset passive income freely, and up to $25,000/yr can offset ordinary (W-2) income if you actively participate and your MAGI is under $100k (phasing out to $0 by $150k); unused losses carry forward. On sale, claimed depreciation is recaptured at up to 25%, and gains may owe capital-gains tax (a 1031 exchange can defer both). Figures are a year-1 estimate at your 24.0% rate — not tax advice; consult a CPA.
Schools (NCES district)
- District
- Union Community School District
- NCES district ID
- 1900022
- Math proficiency
- 77% ▼ -3.00%
- Reading proficiency
- 75% ▲ 2.00%
- Median HH income
- $58,114
- Composite
- 65.13/100
- National rank
- #496
- State rank
- #53 of 289 in IA
Livability — Dysart
- Score
- 77/100
- State rank
- #158
- US rank
- #2881
Category grades
Schools grade is shown separately in the Schools card above.
Census & demographics
- Census place
- Dysart, IA
- Population (ZIP)
- 1,954
Population outlook (Tama County) Hauer SSP2
- Today (2025)
- 16,690 people
- By 2030
- 16,217 · -2.8%
- By 2040
- 15,207 · -8.9%
- By 2050
- 14,186 · -15.0%
- By 2075
- 12,228 · -26.7%
- By 2100
- 10,386 · -37.8%
Race, ethnicity, and origin ACS 2023
- Neighborhood character
- Predominantly White (94%)
- Race & ethnicity
- White 94% Asian 3% Two or more races 2% Black 1%
- Common ancestry
- Iranian 2% Romanian 2% Italian 2%
- Foreign-born
- 3% · China
Political lean MEDSL · Tama
- 2024 margin
- Strong R (+26.9) · D 35.7% · R 62.6% · Other 1.7%
- 2008→2024 swing
- -39.1pp toward R · 2008: 12.2pp · 2024: -26.9pp
- All cycles
- 2024: R+26.9 2020: R+19.1 2016: R+20.6 2012: D+7.4 2008: D+12.2
Not yet ingested
- Civics
- —
Market trends
- HPI YoY
- ▲ 4.40%
- Current HPI
- 174.1922
- Rent YoY
- —
- Metro
- —
- State GDP YoY
- ▲ 2.48%
- F500 in state
- 4
Industry mix (Fortune 500 HQ in IA)
| Industry | F500 HQs | Revenue |
|---|---|---|
| Financial Services | 1 | $16B |
|
||
| Retail / Convenience | 1 | $15B |
|
||
Price history
+9.6% since first listed7 events — show timeline
- 2026-03-06 Listed $109,500 NEIRBR as distributed by MLS GRID
- 2025-09-22 Price Changed $107,500 NEIRBR as distributed by MLS GRID
- 2025-08-09 Price Changed $109,000 NEIRBR as distributed by MLS GRID
- 2025-05-28 Price Changed $119,000 NEIRBR as distributed by MLS GRID
- 2021-08-11 Sold (Public Records) $88,000 Public Records
- 2021-08-09 Sold (MLS) $88,000 NEIRBR as distributed by MLS GRID
- 2021-06-24 Listed $99,900 NEIRBR as distributed by MLS GRID
Property tax history
+6.7%/yrLatest (2025): $1,682 · +5.7% YoY. Source: county tax records.
Cash-flow waterfall
monthlySold comps — $/sqft
last 12 mo · ≤1 miLoading sold comps…