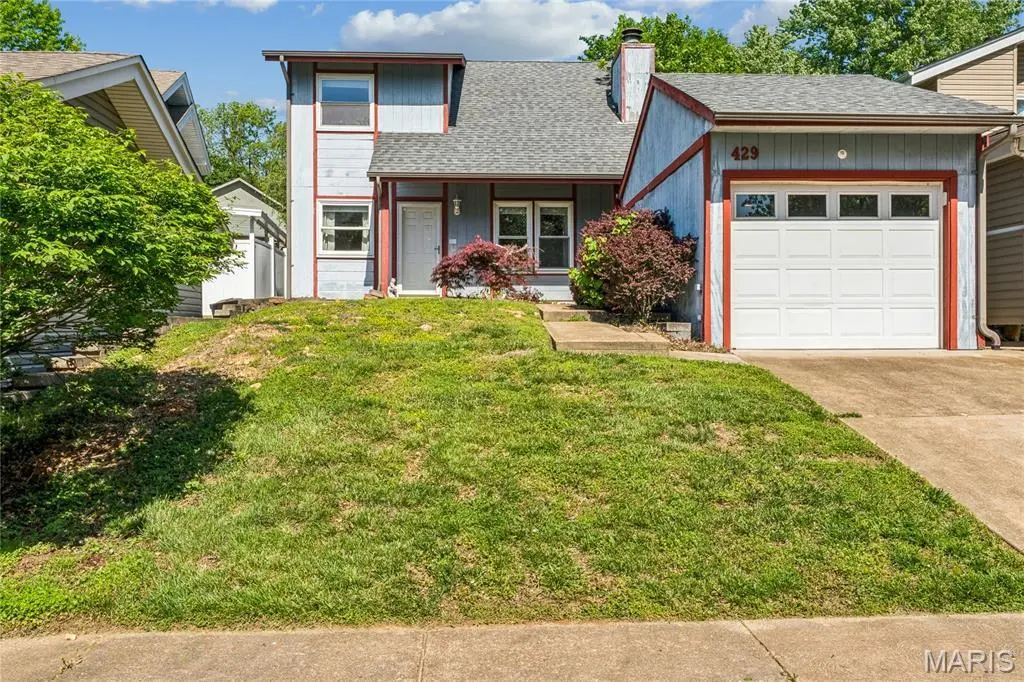
429 Far Hill Dr · Ballwin, MO
Flood risk 1/10 · Minimal
- FEMA flood zone
- X (unshaded)
- Chance of flooding over 30 yrs
- 0.0%
- Est. flood insurance / yr
- $507 – $1,088
Fire risk 1/10 · Minimal
- Est. fire insurance / yr
- $1,054 – $1,958
Heat risk 5/10 · Moderate
- Hot days now (above 107°F)
- 7 days/yr
- Hot days in 30 yrs
- 20 days/yr
Wind risk 2/10 · Minimal
- Chance of severe wind over 30 yrs
- 1.0%
Air-quality risk 2/10 · Minimal
- Unhealthy air days now
- 1 days/yr
- Unhealthy air days in 30 yrs
- 1 days/yr
Risk factors via First Street. Map © Google.
Why this score? — see what drove the B+ grade
The composite is a weighted blend of 9 inputs, each scored 0–100. Each bar is that input's sub-score; the figure is the points it added to the 100-point composite (weight × sub-score).
- Cash flow +30.0/30.0
- ARV discount +15.0/15.0
- DSCR +10.0/10.0
- 1% rule +9.3/10.0
- Schools +5.1/10.0
- Livability +4.3/5.0
- Rent growth +3.0/5.0
- Condition / age +2.5/5.0
- Appreciation +0.0/10.0
$149,900
🖨 Deal sheet (PDF) 📄 Offer letter ✓ Due diligence
Listing remarks
Tucked inside Rolling Hills Country Club Park, this is your shot to step into Ballwin with confidence and upside. Whether you are building a portfolio or planting roots in the highly sought-after Parkway School District, this one checks the boxes and leaves room to create something special. The main level delivers a warm, functional layout with a comfortable living room anchored by a wood burning fireplace, flowing into the dining space and kitchen, plus main floor laundry for everyday ease and a primary bedroom on the main level just steps from a full bath. Upstairs, two additional bedrooms, a second full bath, and a versatile bonus room offer flexibility for a home office, playroom, or cr
Key facts
- 3,998 sq ft lot
- Garage
- Community pool
Property features AI
Finance
- Other: Living area reported as 1,092 (source: assessor); No home warranty
- Financial info: Lease not considered
- HOA & community: Part of Rolling Hills and Rustic Valley Subdivision site; Annual association fee ($350) covering pool, common area maintenance, parking/roads maintenance and snow removal
Exterior
- Parking: Detached garage (1 car); Driveway
- Security: Storm door(s)
- Utilities: Public water; Public sewer; Electricity (Ameren); Natural gas connected; Water connected; Electricity connected
- Home design: Single family residence; One and one-half levels; Residential property
- Construction: Frame construction; Architectural shingle roof; Slab foundation; Built according to public records
- Exterior features: Enclosed rear screened porch; Porch; Wood fence; Back yard; Pool (community/association)
Interior
- Kitchen: Dishwasher; Electric oven
- Bedrooms: 3 bedrooms total (1 on main level, 2 on upper level)
- Bathrooms: 2 full bathrooms (1 on main level, 1 on upper level)
- Heating & cooling: Forced air heating (natural gas); Central air conditioning; Ceiling fan(s); Gas cooling connection
- Interior features: Ceiling fans; Kitchen/dining room combo; Wood-burning fireplace (1)
- Laundry & utility: Utility room on main level
Neighborhood map
What this means for you Summary
Snapshot
- This is a 3-bed/2.0-bath single-family listed at $150k.
Deal economics
- At list price, monthly cash flow is $641 ($8k/yr) — positive.
- The deal already cash-flows at list — no discount required.
- Meets the 1% rule at list price ($2k rent vs $150k).
- Cap rate 11.4% vs local median 4.0% in Ballwin — top-decile yield for the area; either an underpriced asset or a hidden risk that comps aren't pricing in. Stress-test before assuming the spread holds.
Location & tenants
- Location reads 86/100 on livability (#2 in MO, #357 nationally) — a professional / high-income tenant draw. Strengths: crime A+, employment A+, housing A+; Watch: commute D.
- Parkway C-2 (suburban): math 49% / reading 62% proficiency, ranked #18 of 324 in MO (top 6%) — acceptable for families but not a draw, mixed tenant base, ~2y average lease; only 14% free/reduced lunch — higher-income household profile.
- Zoned schools: Oak Brook Elem. (math 62% / reading 69%, grade B+, #63 of 1,115 statewide, top 6%, 390 students, 8% FRL); Southwest Middle (math 42% / reading 58%, grade C, #68 of 391 statewide, top 18%, 688 students, 17% FRL); South High (math 42% / reading 68%, grade C, #65 of 521 statewide, top 13%, 1,598 students, 23% FRL) — zoned schools at 16% FRL track the district average.
- Market conditions: Rents rising (+1.9%/yr); 245 active listings in the ZIP; 8 comparable units currently listed for rent nearby; rentals at typical pace (median 16d on market — plan ~3-4 weeks tenant-placement turnaround); high-income renter base; 920 units permitted in St. Louis County in 2024 (250 in 5+ unit buildings).
Forward outlook
- Local home prices are declining (-3.0%/yr); year-one equity from $1k of loan paydown is wiped out by about $4k of value loss. Plan a longer hold.
- At projected returns (-3.0% appreciation + 1.9% rent growth), your $42k cash investment doubles in ~8 years — after that, you're playing with house money.
Negotiation context
- Only 2 days on market — expect competitive offers; lowballing is unlikely to land.
- Current owner paid $130k; 15% above their basis — modest negotiation headroom, anchor on the comps not their cost.
Risks & watch-outs
- Climate carrying-cost: extreme-heat days projected 7→20/yr by 2055 (HVAC capex compounding) — expect insurance premiums to compound above CPI over the hold.
Questions for the listing agent
- What does the HOA fee cover, when was the last increase, and are there any pending special assessments or reserve-fund shortfalls?
- Is there a deadline driving the sale (1031 exchange, divorce, estate, relocation)? That informs how much negotiation room exists.
- Schools are A-rated — typically a magnet for longer-tenancy family renters. What's the average tenant stay here, and is there a school-zone premium baked into asking?
- What's the average days-on-market for RENTAL listings here right now (not sales)? A rising rental-DOM trend means longer vacancies and softer asking-rent achievability than the comps imply.
- What's the recent tenant-quality profile in this submarket — average credit score on applications, eviction rate, late-payment / NSF rate, and stable-employment percentage? A property-management company in the area should have these aggregated.
- How much new for-sale + rental construction is in the pipeline within 1–3 miles? Heavy new supply typically softens prices + rents 12–24 months out; constrained supply supports both.
Investment metrics
- 1% rule
- 1.43% ✓
- Cap rate
- 11.42%
- Cash-on-cash
- 18.33%
- DSCR
- 1.82
- GRM
- 5.8
CMA / ARV
- ARV (on-the-fly)
- $254,436
- Comps found
- 12
Show comp detail 12 sales within ~0.75 mi
| Address | Dist | Beds/Ba | Sqft | Sold | Price | $/sf | Match |
|---|---|---|---|---|---|---|---|
| 429 Far Hill Dr | 0.00mi | 3/2.0 | 1,092 (0%) | 1mo | $149,900 | $137 | 99 |
| 570 Twigwood Dr | 0.14mi | 3/1.5 | 1,090 (-0%) | 12mo | $320,000 | $294 | 82 |
| 420 Echo Hill Dr | 0.09mi | 3/1.5 | 996 (-9%) | 10mo | $232,500 | $233 | 71 |
| 409 Briarhill Dr | 0.17mi | 3/2.0 | 1,196 (+10%) | 18mo | $300,000 | $251 | 61 |
| 648 Running Creek Dr | 0.31mi | 3/2.5 | 1,236 (+13%) | 1mo | $260,000 | $210 | 60 |
| 723 Westglen Village Dr | 0.57mi | 3/2.0 | 1,176 (+8%) | 1mo | $325,000 | $276 | 60 |
| 697 Woodrun Ct | 0.44mi | 3/2.0 | 1,006 (-8%) | 12mo | $299,000 | $297 | 57 |
| 400 Woodrun Dr | 0.62mi | 3/2.0 | 1,173 (+7%) | 3mo | $350,000 | $298 | 56 |
| 613 Hickory Knoll Ct | 0.28mi | 3/2.0 | 1,247 (+14%) | 8mo | $249,900 | $200 | 56 |
| 247 Ramsey Ln | 0.64mi | 3/1.0 | 1,008 (-8%) | 3mo | $230,000 | $228 | 51 |
| 285 Ramsey Ln | 0.67mi | 3/1.0 | 1,008 (-8%) | 12mo | $129,900 | $129 | 42 |
| 239 Ramsey Ln | 0.71mi | 3/1.0 | 1,000 (-8%) | 13mo | $219,999 | $220 | 38 |
Match score weights: distance 35% · size 25% · config 20% · recency 20%. Top-matched comps best support the ARV.
Projected returns pro-forma
-3.0% appreciation · 1.94% rent growth · sell at horizon
- IRR
- 8.8%
- Equity multiple
- 1.34×
- Total profit
- $14,312
- Equity at exit
- $22,351
- IRR
- 17.1%
- Equity multiple
- 2.34×
- Total profit
- $56,109
- Equity at exit
- $12,961
Cash invested: $41,972 (down + closing). Projections, not guarantees.
Landlord ↔ Tenant lean methodology
- Overall (STATE)
- 81 Strongly Landlord-Friendly
- State Missouri
- 81 Strongly Landlord-Friendly · R+10
- County
- — inherits STATE
- City
- — inherits STATE
ZIP-level market 63021
- Rents YoY
- 1.9%
- Active inventory
- 245
- Price-to-rent
- 5.8×
Monthly cashflow live
- Estimated rent
- $2,146 high interval (Pro) →
- Mortgage (P&I)
- −$786
- Tax from tax record
- −$177 /mo · $2,126/yr
- Insurance
- −$62
- HOA
- −$29
- Vacancy / Maint / Mgmt
- −$451
- Net cashflow
- $641
Break-even live
Sensitivity live
| Price | -10% $726 | -5% $683 | +0% $641 | +5% $599 | +10% $556 |
|---|---|---|---|---|---|
| Rent | -10% $471 | -5% $556 | +0% $641 | +5% $726 | +10% $811 |
| Rate | -1.0pp $716 | -0.5pp $679 | base $641 | +0.5pp $602 | +1.0pp $563 |
UW: 25.0% down · 7.5% · 30yr · 1.5% tax · 5.0% vac · 8.0% maint · 8.0% mgmt
Financing live
Cash to close
- Down payment
- $37,475
- Closing costs
- $4,497
- Reserves months
- —
- Total cash needed
- —
Loan-product check · same deal, 3 products live
Conventional
25% down · 7.5% · 30yr
- Down + closing
- —
- Monthly P&I
- —
- Monthly cashflow
- —
- DSCR
- —
- Eligible?
- —
Personal DTI + credit; lowest rate.
DSCR
20% down · 8.5% · 30yr
- Down + closing
- —
- Monthly P&I
- —
- Monthly cashflow
- —
- DSCR
- —
- Eligible?
- —
No personal income docs; deal must DSCR.
Hard money
10% down · 12.0% · 12mo
- Down + closing
- —
- Monthly P&I
- —
- Monthly cashflow
- —
- DSCR
- —
- Eligible?
- —
Short-term bridge; refi at stabilization.
Rent comps 8 comps
| Address | Beds | Baths | Sqft | Rent | $/sqft | DOM | Units | Dist |
|---|---|---|---|---|---|---|---|---|
| 411 Down Hill Dr Ballwin, MO | 2.0 | 2.0 | 1313 | $1,875 | $1.43 | 25d | 1 | 0.10mi |
| 455 Down Hill Dr Ballwin, MO | 3.0 | 2.0 | 1092 | $1,826 | $1.67 | 0d | 1 | 0.11mi |
| 424 Harvest Hill Ct Ballwin, MO | 4.0 | 3.0 | 1307 | $2,880 | $2.20 | 45d | 1 | 0.14mi |
| 622 Rustic Valley Dr Ballwin, MO | 3.0 | 2.0 | 1241 | $2,400 | $1.93 | 0d | 1 | 0.22mi |
| 691 Walnut Point Ct Ballwin, MO | 3.0 | 2.0 | 1311 | $2,100 | $1.60 | 19d | 1 | 0.40mi |
| 284 Ramsey Ln Ballwin, MO | 4.0 | 1.0 | 1296 | $2,300 | $1.77 | 16d | 1 | 0.70mi |
| 920 Quail Terrace Ct Ballwin, MO | 1.0–3.0 | 1.0–2.0 | 971 | $2,209 | $2.27 | 0d | 10 | 0.83mi |
| 170 Steamboat Ln Ballwin, MO | 1.0–3.0 | 1.0–2.5 | 1177 | $2,302 | $1.95 | 0d | 11 | 1.45mi |
HOA detail
- Monthly dues
- $29 · $348/yr
Listing history 6 events
-
2026-04-29status Pending
-
2026-04-27$149,900 Active
-
2026-04-24historical $149,900
-
2011-05-20soldstatus $130,000
-
2002-12-24soldstatus $127,500
-
1985-09-01soldstatus
ⓘ Source: listings_history table (triggers on properties + properties_extension) + one-shot
backfill from property_details.listing_events for pre-trigger history.
Tax reassessment forecast MO · Resets to sale price
- Current annual tax
- $2,126 · $177/mo
- Projected year-2 tax
- $2,126 · $177/mo
- Expected delta
- $0/yr ($0/mo · 0.0%)
ⓘ Screening estimate from a state-policy table — verify with the county assessor before closing.
Climate risk First Street
- Flood 1/10 Low FEMA zone X (unshaded) · 0% chance over 30 yrs
- Wildfire 1/10 Low
- Heat 5/10 Major 7 d/yr ≥107°F today · 20 d/yr by 30 yrs out
- Wind 2/10 Low 100% chance of damaging wind over 30 yrs
- Air quality 2/10 Low 1 unhealthy d/yr today · 1 by 30 yrs out
Nearby sold comps map
Loading sold comps map…
Walkable amenities ~0.75 mi
Loading nearby amenities…
Taxation est. · year 1
- Rental income
- $25,758
- − Mortgage interest
- −$8,397
- − Property taxes
- −$2,126
- − Insurance
- −$750
- − Repairs & maintenance
- −$2,061
- − Management
- −$2,061
- − HOA
- −$348
- − Depreciation
- −$4,361
- Taxable income
- $5,655
- Est. tax owed @ 24.0%
- −$1,357
- After-tax cash flow
- $6,334/yr
For passive investors: Depreciation is non-cash, so a rental often shows a tax loss while cash-flowing — sheltering income. Rental losses are passive: they offset passive income freely, and up to $25,000/yr can offset ordinary (W-2) income if you actively participate and your MAGI is under $100k (phasing out to $0 by $150k); unused losses carry forward. On sale, claimed depreciation is recaptured at up to 25%, and gains may owe capital-gains tax (a 1031 exchange can defer both). Figures are a year-1 estimate at your 24.0% rate — not tax advice; consult a CPA.
Schools (NCES district)
- District
- Parkway C-2
- NCES district ID
- 2923580
- Math proficiency
- 49% ▼ -11.00%
- Reading proficiency
- 62% ▼ -2.00%
- Median HH income
- $83,551
- Composite
- 50.5/100
- National rank
- #1851
- State rank
- #18 of 324 in MO
Livability — Ballwin
- Score
- 86/100
- State rank
- #2
- US rank
- #357
Category grades
Schools grade is shown separately in the Schools card above.
Census & demographics
- Census place
- Ballwin, MO
- County
- Saint Louis County · 888,823 people
- City population
- 91,586
- Metro
- St. Louis, MO-IL
- Population (ZIP)
- 55,666
- Household income
- $120,177
- Rent vs Own
- Severe rent burden
- 932.0
Population outlook (St. Louis County) Hauer SSP2
- Today (2025)
- 1,025,227 people
- By 2030
- 1,028,023 · +0.3%
- By 2040
- 1,020,940 · -0.4%
- By 2050
- 1,007,280 · -1.8%
- By 2075
- 987,277 · -3.7%
- By 2100
- 921,984 · -10.1%
Race, ethnicity, and origin ACS 2023
- Neighborhood character
- Predominantly White (76%)
- Race & ethnicity
- White 76% Asian 10% Two or more races 9% Hispanic / Latino 5% Black 3%
- Hispanic origin (detail)
- Mexican 4%
- Common ancestry
- Lithuanian 3% Romanian 2% Italian 2%
- Foreign-born
- 11% · Canada, China, South Korea
- Languages at home
- 85% English-only · Other Indo-European 4% Spanish 3% Other Asian/Pacific 2%
Political lean MEDSL · St. Louis
- 2024 margin
- Strong D (+23.4) · D 60.8% · R 37.4% · Other 1.7%
- 2008→2024 swing
- +3.5pp toward D · 2008: 19.9pp · 2024: 23.4pp
- All cycles
- 2024: D+23.4 2020: D+24.0 2016: D+16.2 2012: D+13.7 2008: D+19.9
Not yet ingested
- Civics
- —
Market trends
- HPI YoY
- ▼ -209.71%
- Current HPI
- 221.4498
- Rent YoY
- ▲ 1.94%
- Metro
- St. Louis, MO-IL
- State GDP YoY
- ▲ 1.84%
- F500 in state
- 20
Industry mix (Fortune 500 HQ in MO)
| Industry | F500 HQs | Revenue |
|---|---|---|
| Healthcare | 1 | $163B |
|
||
| Insurance | 1 | $21B |
|
||
| Industrial Technology | 1 | $17B |
|
||
| Retail | 1 | $16B |
|
||
| Industrial Distribution | 1 | $10B |
|
||
| Utilities | 1 | $9B |
|
||
Price history
+17.6% since first listed6 events — show timeline
- 2026-04-29 Pending — MARIS as Distributed by MLS Grid
- 2026-04-27 Listed $149,900 MARIS as Distributed by MLS Grid
- 2026-04-24 Coming Soon $149,900 MARIS as Distributed by MLS Grid
- 2011-05-20 Sold (Public Records) $130,000 Public Records
- 2002-12-24 Sold (Public Records) $127,500 Public Records
- 1985-09-01 Sold (Public Records) — Public Records
Property tax history
+2.8%/yrLatest (2022): $2,126 · +0.6% YoY. Source: county tax records.
Cash-flow waterfall
monthlySold comps — $/sqft
last 12 mo · ≤1 miLoading sold comps…