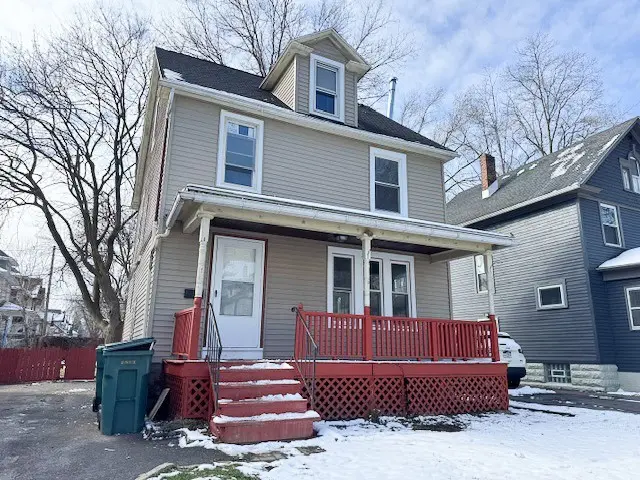
541 Birr St · Rochester, NY
Flood risk 1/10 · Minimal
- FEMA flood zone
- X (unshaded)
- Chance of flooding over 30 yrs
- 0.0%
- Est. flood insurance / yr
- $473 – $860
Fire risk 1/10 · Minimal
- Est. fire insurance / yr
- $691 – $1,283
Heat risk 2/10 · Minimal
- Hot days now (above 96°F)
- 7 days/yr
- Hot days in 30 yrs
- 15 days/yr
Wind risk 1/10 · Minimal
- Chance of severe wind over 30 yrs
- —
Air-quality risk 2/10 · Minimal
- Unhealthy air days now
- 1 days/yr
- Unhealthy air days in 30 yrs
- 2 days/yr
Risk factors via First Street. Map © Google.
Why this score? — see what drove the B- grade
The composite is a weighted blend of 9 inputs, each scored 0–100. Each bar is that input's sub-score; the figure is the points it added to the 100-point composite (weight × sub-score).
- Cash flow +26.2/30.0
- ARV discount +13.5/15.0
- DSCR +8.9/10.0
- 1% rule +6.0/10.0
- Livability +3.8/5.0
- Rent growth +2.5/5.0
- Condition / age +2.5/5.0
- Appreciation +2.2/10.0
- Schools +1.9/10.0
$139,000
🖨 Deal sheet 📄 Offer letter ✓ Due diligence
Listing remarks MLS
Another Bracci Investment Team offering! Finally an opportunity to own a home in the Maplewood neighborhood at a nice price! Priced $17k below assessed value due to work needed, but do-able! Good roof. Great layout, formal dining room w/ kitchen pass thru, bay window, modern light fixtures, large livingroom, hardwood floors, 3 bdrms on 2nd floor, & fully finished attic. Rental value of this home easily $900/month or more. Located in area of well kept homes on quiet dead end street. Fully fenced yard, deck off back of house, many new thermo windows. Lots of good stuff here- check it out.
Key facts
- Open floor plan
- New plumbing
- Fresh paint
Tags
Property features AI
Exterior
- Parking: No garage
- Utilities: Public water connected; Sewer connected
- Home design: 2-story house; Existing (previously built) property
- Construction: Vinyl siding; Block foundation; Full basement
- Exterior features: Blacktop driveway; Near public transit; Rectangular residential lot; City street frontage
Interior
- Kitchen: Eat-in kitchen
- Bedrooms: Total of 7 rooms including bedroom spaces
- Flooring: Hardwood flooring; Vinyl flooring; Varied flooring in some areas
- Bathrooms: 1 full bathroom; 1 half bathroom; One main-level bathroom
- Heating & cooling: Gas heating; Forced-air heating
- Interior features: Attic; Separate/formal dining room; Entrance foyer; Eat-in kitchen; Additional miscellaneous interior features (see remarks)
- Laundry & utility: Gas water heater
Neighborhood map
What this means for you Summary
Snapshot
- This is a 3-bed/1.5-bath single-family listed at $139k.
Deal economics
- At list price, monthly cash flow is $354 ($4k/yr) — positive.
- The deal already cash-flows at list — no discount required.
- Meets the 1% rule at list price ($2k rent vs $139k).
- Recommended offer: $137k (1.5% below list) — sets the bar for market timing.
Location & tenants
- Location reads 76/100 on livability (#222 in NY, #3,482 nationally) — a middle-class / working-renter tenant base. Strengths: commute A+, cost of living A+, housing A+; Watch: schools D+, crime F, employment F.
- Rochester City School District (urban): math 21% / reading 26% proficiency, ranked #589 of 590 in NY (top 100%) — low school quality limits family demand, transient renter base, plan for 1-2y turnover; 82% free/reduced lunch — lower-income household profile, screen leases tightly.
- Market conditions: 71 active listings in the ZIP; 14 comparable units currently listed for rent nearby; rentals at typical pace (median 24d on market — plan ~3-4 weeks tenant-placement turnaround); 1,169 units permitted in Monroe County in 2024 (591 in 5+ unit buildings).
Forward outlook
- Local home prices are declining (-3.0%/yr); year-one equity from $961 of loan paydown is wiped out by about $4k of value loss. Plan a longer hold.
- Monroe County population projected to shrink 6% by 2050 — rents likely to lag national; underwrite the cash flow, not the appreciation.
- At projected returns (-3.0% appreciation + 3.0% rent growth), your $39k cash investment doubles in ~10 years — after that, you're playing with house money.
Negotiation context
- It's been on market 19 days — a 2% lower offer ($137k) is reasonable based on typical stale-listing flexibility.
- 5 sale attempts since 14y ago; this cycle's ask has dropped $10k (7%) from the opening price — seller is motivated, your offer sets the floor, not the list.
- Current owner paid $33k; list at $139k implies a 321% gain — meaningful room to come down on a strong offer.
Risks & watch-outs
- Watch-outs: built in 1909 — expect roof / HVAC / electrical / plumbing capex.
Questions for the listing agent
- Built in 1909 — when were the roof, HVAC, electrical panel, plumbing, and water heater last replaced?
- Is there a deadline driving the sale (1031 exchange, divorce, estate, relocation)? That informs how much negotiation room exists.
- Schools are D-rated, which usually means shorter tenancies and higher turnover. Who's the typical renter profile here, and what's been the actual vacancy rate?
- Crime grade is F in this area — have there been break-ins, vandalism, or insurance claims at this property in the last 3 years? What carrier currently insures it and at what premium?
- What's the average days-on-market for RENTAL listings here right now (not sales)? A rising rental-DOM trend means longer vacancies and softer asking-rent achievability than the comps imply.
- What's the recent tenant-quality profile in this submarket — average credit score on applications, eviction rate, late-payment / NSF rate, and stable-employment percentage? A property-management company in the area should have these aggregated.
- How much new for-sale + rental construction is in the pipeline within 1–3 miles? Heavy new supply typically softens prices + rents 12–24 months out; constrained supply supports both.
Investment metrics
- 1% rule
- 1.10% ✓
- Cap rate
- 9.35%
- Cash-on-cash
- 10.92%
- DSCR
- 1.49
- GRM
- 7.5
CMA / ARV
- ARV (on-the-fly)
- $160,484
- Comps found
- 12
Show comp detail 12 sales within ~0.75 mi
| Address | Dist | Beds/Ba | Sqft | Sold | Price | $/sf | Match |
|---|---|---|---|---|---|---|---|
| 541 Birr St | 0.00mi | 3/1.5 | 1,514 (0%) | 1mo | $142,000 | $94 | 99 |
| 507 Driving Park Ave | 0.33mi | 3/1.5 | 1,602 (+6%) | 3mo | $215,000 | $134 | 73 |
| 232 Alameda St | 0.49mi | 3/1.5 | 1,542 (+2%) | 3mo | $160,000 | $104 | 72 |
| 539 Lakeview Park | 0.19mi | 4/1.0 (+1) | 1,398 (-8%) | 2mo | $150,000 | $107 | 70 |
| 505 Augustine St | 0.09mi | 4/1.0 (+1) | 1,678 (+11%) | 3mo | $160,000 | $95 | 68 |
| 225 Bryan St | 0.16mi | 3/1.0 | 1,315 (-13%) | 3mo | $92,000 | $70 | 66 |
| 451 Lakeview Park | 0.22mi | 3/1.0 | 1,326 (-12%) | 3mo | $185,000 | $140 | 65 |
| 621 Clay Ave | 0.45mi | 3/1.5 | 1,334 (-12%) | 0mo | $200,000 | $150 | 59 |
| 174 Alameda St | 0.57mi | 3/1.5 | 1,658 (+10%) | 3mo | $175,000 | $106 | 55 |
| 22 Starling St | 0.44mi | 4/1.5 (+1) | 1,344 (-11%) | 2mo | $100,000 | $74 | 54 |
| 297 Knickerbocker Ave | 0.66mi | 4/1.5 (+1) | 1,618 (+7%) | 1mo | $202,500 | $125 | 52 |
| 842 Flower City Park | 0.56mi | 3/1.5 | 1,300 (-14%) | 1mo | $116,000 | $89 | 50 |
Match score weights: distance 35% · size 25% · config 20% · recency 20%. Top-matched comps best support the ARV.
Projected returns pro-forma
-3.0% appreciation · 3.0% rent growth · sell at horizon
- IRR
- -0.0%
- Equity multiple
- 1.00×
- Total profit
- $-2
- Equity at exit
- $20,725
- IRR
- 9.6%
- Equity multiple
- 1.74×
- Total profit
- $28,888
- Equity at exit
- $12,018
Cash invested: $38,920 (down + closing). Projections, not guarantees.
Landlord ↔ Tenant lean methodology
- Overall (STATE)
- 15 Strongly Tenant-Friendly
- State New York
- 15 Strongly Tenant-Friendly · D+10
- County
- — inherits STATE
- City
- — inherits STATE
ZIP-level market 14613
- Home prices YoY
- -2.0%
- Active inventory
- 71
- Price-to-rent
- 7.5×
Monthly cashflow live
- Estimated rent
- $1,534 high interval (Pro) →
- Mortgage (P&I)
- −$729
- Tax from tax record
- −$71 /mo · $854/yr
- Insurance
- −$58
- HOA
- −$0
- Vacancy / Maint / Mgmt
- −$322
- Net cashflow
- $354
Break-even live
UW: 25.0% down · 7.5% · 30yr · 1.5% tax · 5.0% vac · 8.0% maint · 8.0% mgmt
Financing live
Cash to close
- Down payment
- $34,750
- Closing costs
- $4,170
- Reserves months
- —
- Total cash needed
- —
Loan-product check · same deal, 3 products live
Conventional
25% down · 7.5% · 30yr
- Down + closing
- —
- Monthly P&I
- —
- Monthly cashflow
- —
- DSCR
- —
- Eligible?
- —
Personal DTI + credit; lowest rate.
DSCR
20% down · 8.5% · 30yr
- Down + closing
- —
- Monthly P&I
- —
- Monthly cashflow
- —
- DSCR
- —
- Eligible?
- —
No personal income docs; deal must DSCR.
Hard money
10% down · 12.0% · 12mo
- Down + closing
- —
- Monthly P&I
- —
- Monthly cashflow
- —
- DSCR
- —
- Eligible?
- —
Short-term bridge; refi at stabilization.
Rent comps 14 comps
| Address | Beds | Baths | Sqft | Rent | $/sqft | DOM | Units | Dist |
|---|---|---|---|---|---|---|---|---|
| 287 Electric Ave Rochester, NY | 3.0 | 1.5 | 1297 | $1,500 | $1.16 | 2d | 1 | 0.44mi |
| 98 Pierpont St Rochester, NY | 3.0 | 1.0 | 1973 | $1,295 | $0.66 | 43d | 1 | 0.53mi |
| 768 Flower City Park Rochester, NY | 3.0 | 1.0 | 1995 | $1,995 | $1.00 | 10d | 1 | 0.55mi |
| 327 Glenwood Ave Rochester, NY | 3.0 | 1.0 | 2012 | $1,690 | $0.84 | 3d | 1 | 0.69mi |
| 1016 Lake Ave Unit 1 Rochester, NY | 3.0 | 1.0 | 1300 | $1,600 | $1.23 | 43d | 1 | 0.76mi |
| 235 Flower City Park Rochester, NY | 3.0 | 1.0 | 2000 | $1,360 | $0.68 | 43d | 1 | 0.91mi |
| 248 Flower City Park Rochester, NY | 3.0 | 1.0 | 1350 | $1,800 | $1.33 | 3d | 1 | 0.92mi |
| 28-30 Carthage Dr Unit 28 Rochester, NY | 3.0 | 1.0 | 1415 | $1,600 | $1.13 | 23d | 1 | 1.08mi |
| 25 Karnes St Rochester, NY | 2.0 | 1.0 | 1059 | $1,250 | $1.18 | 21d | 1 | 1.09mi |
| 84 Twin Beeches Rochester, NY | 2.0 | 1.5 | 1096 | $1,250 | $1.14 | 23d | 1 | 1.17mi |
| 89 Twin Beeches Rochester, NY | 2.0 | 1.5 | 1096 | $1,250 | $1.14 | 43d | 1 | 1.19mi |
| 87 McNaughton St Unit 87 Rochester, NY | 2.0 | 1.0 | 1929 | $1,300 | $0.67 | 14d | 1 | 1.30mi |
| 85 Cameron St Unit B Rochester, NY | 3.0 | 1.0 | 1138 | $1,650 | $1.45 | 43d | 1 | 1.31mi |
| 69 Angle St Rochester, NY | 2.0 | 1.0 | 1500 | $1,500 | $1.00 | 14d | 1 | 1.37mi |
Listing history 11 events
-
2026-04-16status Pending
-
2026-04-07price $139,000
-
2026-03-29$149,000 Active
-
2013-10-21soldstatus $33,000 598-char remark
Show marketing remark (598 chars)
Another Bracci Investment Team offering! Finally an opportunity to own a home in the Maplewood neighborhood at a nice price! Priced $17k below assessed value due to work needed, but do-able! Good roof. Great layout, formal dining room w/ kitchen pass thru, bay window, modern light fixtures, large livingroom, hardwood floors, 3 bdrms on 2nd floor, & fully finished attic. Rental value of this home easily $900/month or more. Located in area of well kept homes on quiet dead end street. Fully fenced yard, deck off back of house, many new thermo windows. Lots of good stuff here- check it out.
-
2013-10-21soldstatus $33,000
Show marketing remark (598 chars)
Another Bracci Investment Team offering! Finally an opportunity to own a home in the Maplewood neighborhood at a nice price! Priced $17k below assessed value due to work needed, but do-able! Good roof. Great layout, formal dining room w/ kitchen pass thru, bay window, modern light fixtures, large livingroom, hardwood floors, 3 bdrms on 2nd floor, & fully finished attic. Rental value of this home easily $900/month or more. Located in area of well kept homes on quiet dead end street. Fully fenced yard, deck off back of house, many new thermo windows. Lots of good stuff here- check it out.
-
2013-02-21$39,900 598-char remark
Show marketing remark (598 chars)
Another Bracci Investment Team offering! Finally an opportunity to own a home in the Maplewood neighborhood at a nice price! Priced $17k below assessed value due to work needed, but do-able! Good roof. Great layout, formal dining room w/ kitchen pass thru, bay window, modern light fixtures, large livingroom, hardwood floors, 3 bdrms on 2nd floor, & fully finished attic. Rental value of this home easily $900/month or more. Located in area of well kept homes on quiet dead end street. Fully fenced yard, deck off back of house, many new thermo windows. Lots of good stuff here- check it out.
-
2012-11-27$45,000
-
2012-09-30historical
-
2012-09-07historical
-
2012-09-07$45,000
-
2012-05-02$45,000
ⓘ Source: listings_history table (triggers on properties + properties_extension) + one-shot
backfill from property_details.listing_events for pre-trigger history.
Tax reassessment forecast NY · Partial reset (capped growth)
- Current annual tax
- $854 · $71/mo
- Projected year-2 tax
- $1,601 · $133/mo
- Expected delta
- +$748/yr (+$62/mo · 87.6%)
ⓘ Screening estimate from a state-policy table — verify with the county assessor before closing.
Climate risk First Street
- Flood 1/10 Low FEMA zone X (unshaded) · 0% chance over 30 yrs
- Wildfire 1/10 Low
- Heat 2/10 Low 7 d/yr ≥96°F today · 15 d/yr by 30 yrs out
- Wind 1/10 Low
- Air quality 2/10 Low 1 unhealthy d/yr today · 2 by 30 yrs out
Nearby sold comps map
Loading sold comps map…
Walkable amenities ~0.75 mi
Loading nearby amenities…
Taxation est. · year 1
- Rental income
- $18,414
- − Mortgage interest
- −$7,786
- − Property taxes
- −$854
- − Insurance
- −$695
- − Repairs & maintenance
- −$1,473
- − Management
- −$1,473
- − Depreciation
- −$4,044
- Taxable income
- $2,089
- Est. tax owed @ 24.0%
- −$501
- After-tax cash flow
- $3,750/yr
For passive investors: Depreciation is non-cash, so a rental often shows a tax loss while cash-flowing — sheltering income. Rental losses are passive: they offset passive income freely, and up to $25,000/yr can offset ordinary (W-2) income if you actively participate and your MAGI is under $100k (phasing out to $0 by $150k); unused losses carry forward. On sale, claimed depreciation is recaptured at up to 25%, and gains may owe capital-gains tax (a 1031 exchange can defer both). Figures are a year-1 estimate at your 24.0% rate — not tax advice; consult a CPA.
Schools (NCES district)
- District
- Rochester City School District
- NCES district ID
- 3624750
- Math proficiency
- 21% ▬ 0.00%
- Reading proficiency
- 26% ▲ 4.00%
- Median HH income
- $30,923
- Composite
- 18.98/100
- National rank
- #8850
- State rank
- #589 of 590 in NY
Livability — Rochester
- Score
- 76/100
- State rank
- #222
- US rank
- #3482
Category grades
Schools grade is shown separately in the Schools card above.
Census & demographics
- Census place
- Rochester, NY
- City population
- 432,803
- Population (ZIP)
- 14,740
Population outlook (Monroe County) Hauer SSP2
- Today (2025)
- 759,460 people
- By 2030
- 757,154 · -0.3%
- By 2040
- 740,644 · -2.5%
- By 2050
- 714,443 · -5.9%
- By 2075
- 645,883 · -15.0%
- By 2100
- 547,084 · -28.0%
Race, ethnicity, and origin ACS 2023
- Neighborhood character
- Highly diverse neighborhood (Simpson 0.70)
- Race & ethnicity
- Black 45% White 22% Hispanic / Latino 20% Two or more races 10% Asian 8% Pacific Islander 1%
- Hispanic origin (detail)
- Puerto Rican 16% Dominican 3%
- Common ancestry
- British 2% Serbian 1% Romanian 1%
- Foreign-born
- 13% · Canada, India, Philippines
- Languages at home
- 79% English-only · Spanish 12% Other Asian/Pacific 5% Other Indo-European 3%
Political lean MEDSL · Monroe
- 2024 margin
- D (+19.1) · D 59.5% · R 40.5%
- 2008→2024 swing
- +1.4pp toward D · 2008: 17.7pp · 2024: 19.1pp
- All cycles
- 2024: D+19.1 2020: D+21.0 2016: D+14.1 2012: D+17.4 2008: D+17.7
Not yet ingested
- Civics
- —
Market trends
- HPI YoY
- ▼ -5.56%
- Current HPI
- 274.2485
- Rent YoY
- —
- Metro
- —
- State GDP YoY
- ▲ 2.60%
- F500 in state
- 92
Industry mix (Fortune 500 HQ in NY)
| Industry | F500 HQs | Revenue |
|---|---|---|
| Financial Services | 10 | $950B |
|
||
| Consumer Goods | 9 | $162B |
|
||
| Insurance | 4 | $225B |
|
||
| Telecommunications | 2 | $144B |
|
||
| Pharmaceuticals | 2 | $112B |
|
||
| Media / Entertainment | 2 | $69B |
|
||
Price history
+208.9% since first listed11 events — show timeline
- 2026-04-16 Pending — UNYREIS
- 2026-04-07 Price Changed $139,000 UNYREIS
- 2026-03-29 Listed $149,000 UNYREIS
- 2013-10-21 Sold (Public Records) $33,000 Public Records
- 2013-10-21 Sold (MLS) $33,000 UNYREIS
- 2013-02-21 Listed $39,900 UNYREIS
- 2012-11-27 Listed $45,000 UNYREIS
- 2012-09-30 Listing Removed — UNYREIS
- 2012-09-07 Listed $45,000 UNYREIS
- 2012-09-07 Listing Removed — UNYREIS
- 2012-05-02 Listed $45,000 UNYREIS
Property tax history
+0.2%/yrLatest (2025): $854 · +0.0% YoY. Source: county tax records.
Cash-flow waterfall
monthlySold comps — $/sqft
last 12 mo · ≤1 miLoading sold comps…