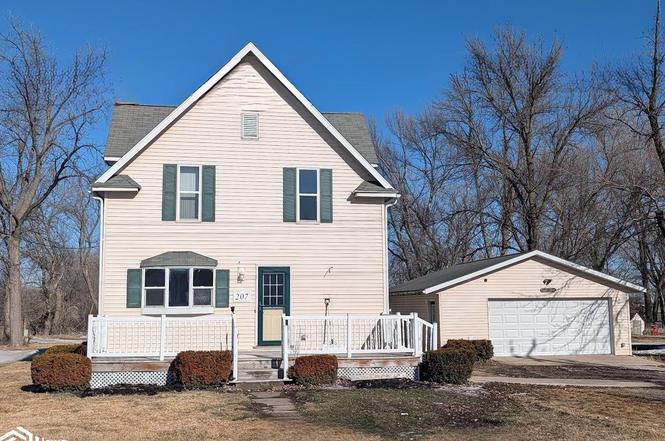
207 Lake St · Joice, IA
Flood risk 1/10 · Minimal
- FEMA flood zone
- X (unshaded)
- Chance of flooding over 30 yrs
- 0.0%
- Est. flood insurance / yr
- $473 – $860
Fire risk 2/10 · Minimal
- Est. fire insurance / yr
- $902 – $1,676
Heat risk 2/10 · Minimal
- Hot days now (above 99°F)
- 7 days/yr
- Hot days in 30 yrs
- 16 days/yr
Wind risk 2/10 · Minimal
- Chance of severe wind over 30 yrs
- —
Air-quality risk 1/10 · Minimal
- Unhealthy air days now
- 0 days/yr
- Unhealthy air days in 30 yrs
- 0 days/yr
Risk factors via First Street. Map © Google.
Why this score? — see what drove the D grade
The composite is a weighted blend of 9 inputs, each scored 0–100. Each bar is that input's sub-score; the figure is the points it added to the 100-point composite (weight × sub-score).
- Appreciation +8.8/10.0
- Cash flow +8.2/30.0
- ARV discount +7.5/15.0
- Schools +5.9/10.0
- Livability +3.1/5.0
- Rent growth +2.5/5.0
- Condition / age +2.5/5.0
- 1% rule +2.2/10.0
- DSCR +2.2/10.0
$149,000
🖨 Deal sheet 📄 Offer letter ✓ Due diligence
Listing remarks
PRICE REDUCTION- MOTIVATED SELLERS! 2-STORY, UPDATED HOME WITH 2 DECKS ON A HALF ACRE IN TOWN! Small town living at its best! Your family will appreciate this spacious 4-bedroom, 2-bath home on just over a half-acre of land! Entering from a large, maintenance-free deck on the south side, you’ll love the large kitchen island, which is a focal point for hosting & daily routines. An adjoining dining area & laundry room with pantry completes this highly functional space. You’ll enjoy a main floor master bedroom & family room, both with partially vaulted ceilings. Natural light fills these rooms & the family room has a sliding patio door out to a small deck.
Key facts
- Large kitchen island
- Sliding patio door
- Updated home
Tags
Property features AI
Exterior
- Parking: Detached 2-car garage
- Utilities: Public water; Public sewer
- Home design: Two-story single-family residence; Vinyl siding
- Construction: Vinyl siding construction
- Exterior features: Lot approximately 0.52 acres
Interior
- Bathrooms: 2 full bathrooms
- Heating & cooling: Central air conditioning; Forced air heating
- Interior features: Basement
Neighborhood map
What this means for you Summary
Snapshot
- This is a 4-bed/2.0-bath single-family listed at $149k.
Deal economics
- At list price, monthly cash flow is $-140 ($-2k/yr) — negative.
- To cash-flow at today's rent, offer at most $124k (16.6% below list).
- To meet the 1% rule (rent ≥ 1% of price), the offer needs to be $107k (28.5% below list).
- Recommended offer: $107k (28.5% below list) — sets the bar for 1% rule.
Location & tenants
- Location reads 61/100 on livability (#752 in IA) — a middle-class / working-renter tenant base. Strengths: cost of living A+, housing A+; Watch: crime C-, health & safety C-, schools D-.
- Lake Mills Community School District (rural): math 68% / reading 72% proficiency, ranked #148 of 289 in IA (top 51%) — strong family-tenant draw, lease renewals of 3-5y typical.
- Market conditions: 3 active listings in the ZIP.
Forward outlook
- In year one you build about $12k of equity ($1k loan paydown + $11k appreciation (7.5% local appreciation)).
- By year 3, paydown + projected appreciation supports a ~$31k cash-out refi (75% LTV) — recoverable capital for the next deal without selling this one.
Negotiation context
- It's been on market 65 days — a 6% lower offer ($140k) is reasonable based on typical stale-listing flexibility.
- 2 sale attempts; this cycle's ask has dropped $10k (6%) from the opening price — seller is motivated, your offer sets the floor, not the list.
Risks & watch-outs
- Watch-outs: built in 1920 — expect roof / HVAC / electrical / plumbing capex.
Questions for the listing agent
- What do current leases actually rent for vs. the listed asking? Can we see a recent rent roll and the last 12 months of T-12 income?
- It's been on market 65 days. Have you received any prior offers? Is the seller open to a 28% concession, seller financing, or rate buy-down credit?
- Built in 1920 — when were the roof, HVAC, electrical panel, plumbing, and water heater last replaced?
- Why hasn't it sold? Are there any deal-killer items the seller is aware of (foundation, flood, title, zoning, code violations)?
- Is there a deadline driving the sale (1031 exchange, divorce, estate, relocation)? That informs how much negotiation room exists.
- Schools are D-rated, which usually means shorter tenancies and higher turnover. Who's the typical renter profile here, and what's been the actual vacancy rate?
- The area grade is low — what's the realistic commute time and amenity access for the typical tenant pool here? Any planned neighborhood developments (good or bad) we should know about?
- What's the average days-on-market for RENTAL listings here right now (not sales)? A rising rental-DOM trend means longer vacancies and softer asking-rent achievability than the comps imply.
- What's the recent tenant-quality profile in this submarket — average credit score on applications, eviction rate, late-payment / NSF rate, and stable-employment percentage? A property-management company in the area should have these aggregated.
- How much new for-sale + rental construction is in the pipeline within 1–3 miles? Heavy new supply typically softens prices + rents 12–24 months out; constrained supply supports both.
Investment metrics
- 1% rule
- 0.72% ✗
- Cap rate
- 5.16%
- Cash-on-cash
- -4.03%
- DSCR
- 0.82
- GRM
- 11.6
CMA / ARV
No comps found within radius.
Projected returns pro-forma
7.53% appreciation · 3.0% rent growth · sell at horizon
- IRR
- 15.8%
- Equity multiple
- 2.15×
- Total profit
- $48,035
- Equity at exit
- $108,519
- IRR
- 15.5%
- Equity multiple
- 4.50×
- Total profit
- $145,948
- Equity at exit
- $211,093
Cash invested: $41,720 (down + closing). Projections, not guarantees.
Landlord ↔ Tenant lean methodology
- Overall (STATE)
- 83 Strongly Landlord-Friendly
- State Iowa
- 83 Strongly Landlord-Friendly · R+6
- County
- — inherits STATE
- City
- — inherits STATE
ZIP-level market 50446
- Home prices YoY
- 5.0%
- Active inventory
- 3
- Price-to-rent
- 11.6×
Monthly cashflow live
- Estimated rent
- $1,066 medium interval (Pro) →
- Mortgage (P&I)
- −$781
- Tax from tax record
- −$139 /mo · $1,666/yr
- Insurance
- −$62
- HOA
- −$0
- Vacancy / Maint / Mgmt
- −$224
- Net cashflow
- $-140
Break-even live
UW: 25.0% down · 7.5% · 30yr · 1.5% tax · 5.0% vac · 8.0% maint · 8.0% mgmt
Financing live
Cash to close
- Down payment
- $37,250
- Closing costs
- $4,470
- Reserves months
- —
- Total cash needed
- —
Loan-product check · same deal, 3 products live
Conventional
25% down · 7.5% · 30yr
- Down + closing
- —
- Monthly P&I
- —
- Monthly cashflow
- —
- DSCR
- —
- Eligible?
- —
Personal DTI + credit; lowest rate.
DSCR
20% down · 8.5% · 30yr
- Down + closing
- —
- Monthly P&I
- —
- Monthly cashflow
- —
- DSCR
- —
- Eligible?
- —
No personal income docs; deal must DSCR.
Hard money
10% down · 12.0% · 12mo
- Down + closing
- —
- Monthly P&I
- —
- Monthly cashflow
- —
- DSCR
- —
- Eligible?
- —
Short-term bridge; refi at stabilization.
Listing history 5 events
-
2026-04-30status Pending
-
2026-04-19status Active
-
2026-04-15status Pending
-
2026-04-13price $149,000
-
2026-02-19$159,000 Active
ⓘ Source: listings_history table (triggers on properties + properties_extension) + one-shot
backfill from property_details.listing_events for pre-trigger history.
Tax reassessment forecast IA · Partial reset (capped growth)
- Current annual tax
- $1,666 · $139/mo
- Projected year-2 tax
- $2,003 · $167/mo
- Expected delta
- +$337/yr (+$28/mo · 20.2%)
ⓘ Screening estimate from a state-policy table — verify with the county assessor before closing.
Climate risk First Street
- Flood 1/10 Low FEMA zone X (unshaded) · 0% chance over 30 yrs
- Wildfire 2/10 Low
- Heat 2/10 Low 7 d/yr ≥99°F today · 16 d/yr by 30 yrs out
- Wind 2/10 Low
- Air quality 1/10 Low 0 unhealthy d/yr today · 0 by 30 yrs out
Nearby sold comps map
Loading sold comps map…
Walkable amenities ~0.75 mi
Loading nearby amenities…
Taxation est. · year 1
- Rental income
- $12,790
- − Mortgage interest
- −$8,346
- − Property taxes
- −$1,666
- − Insurance
- −$745
- − Repairs & maintenance
- −$1,023
- − Management
- −$1,023
- − Depreciation
- −$4,335
- Taxable loss
- −$4,348
- Est. tax savings @ 24.0%
- +$1,043
- After-tax cash flow
- $-640/yr
For passive investors: Depreciation is non-cash, so a rental often shows a tax loss while cash-flowing — sheltering income. Rental losses are passive: they offset passive income freely, and up to $25,000/yr can offset ordinary (W-2) income if you actively participate and your MAGI is under $100k (phasing out to $0 by $150k); unused losses carry forward. On sale, claimed depreciation is recaptured at up to 25%, and gains may owe capital-gains tax (a 1031 exchange can defer both). Figures are a year-1 estimate at your 24.0% rate — not tax advice; consult a CPA.
Schools (NCES district)
- District
- Lake Mills Community School District
- NCES district ID
- 1916110
- Math proficiency
- 68% ▼ -5.00%
- Reading proficiency
- 72% ▼ -2.00%
- Median HH income
- $48,268
- Composite
- 59.19/100
- National rank
- #945
- State rank
- #148 of 289 in IA
Livability — Joice
- Score
- 61/100
- State rank
- #752
- US rank
- #17322
Category grades
Schools grade is shown separately in the Schools card above.
Census & demographics
- Census place
- Joice, IA
- Population (ZIP)
- 518
Population outlook (Worth County) Hauer SSP2
- Today (2025)
- 7,751 people
- By 2030
- 7,775 · +0.3%
- By 2040
- 7,722 · -0.4%
- By 2050
- 7,645 · -1.4%
- By 2075
- 7,785 · +0.4%
- By 2100
- 7,554 · -2.5%
Race, ethnicity, and origin ACS 2023
- Neighborhood character
- Predominantly White (97%)
- Race & ethnicity
- White 97% Hispanic / Latino 3% Two or more races 2%
- Common ancestry
- Portuguese 28% Scottish 9% Lithuanian 3%
- Foreign-born
- 0%
Political lean MEDSL · Worth
- 2024 margin
- Strong R (+28.2) · D 35.2% · R 63.5% · Other 1.3%
- 2008→2024 swing
- -50.6pp toward R · 2008: 22.4pp · 2024: -28.2pp
- All cycles
- 2024: R+28.2 2020: R+25.9 2016: R+21.8 2012: D+14.5 2008: D+22.4
Not yet ingested
- Civics
- —
Market trends
- HPI YoY
- ▲ 7.53%
- Current HPI
- 158.6483
- Rent YoY
- —
- Metro
- —
- State GDP YoY
- ▲ 2.48%
- F500 in state
- 4
Industry mix (Fortune 500 HQ in IA)
| Industry | F500 HQs | Revenue |
|---|---|---|
| Financial Services | 1 | $16B |
|
||
| Retail / Convenience | 1 | $15B |
|
||
Price history
-6.3% since first listed5 events — show timeline
- 2026-04-30 Pending — IAR
- 2026-04-19 Relisted — IAR
- 2026-04-15 Pending — IAR
- 2026-04-13 Price Changed $149,000 IAR
- 2026-02-19 Listed $159,000 IAR
Property tax history
+4.7%/yrLatest (2025): $1,666 · +5.8% YoY. Source: county tax records.
Cash-flow waterfall
monthlySold comps — $/sqft
last 12 mo · ≤1 miLoading sold comps…