7908 NE 69th St · Vancouver, WA
Flood risk 1/10 · Minimal
- FEMA flood zone
- X (unshaded)
- Chance of flooding over 30 yrs
- 0.0%
- Est. flood insurance / yr
- $507 – $1,088
Fire risk 3/10 · Minor
- Est. fire insurance / yr
- $604 – $1,122
Heat risk 3/10 · Minor
- Hot days now (above 91°F)
- 7 days/yr
- Hot days in 30 yrs
- 15 days/yr
Wind risk 1/10 · Minimal
- Chance of severe wind over 30 yrs
- —
Air-quality risk 9/10 · Severe
- Unhealthy air days now
- 15 days/yr
- Unhealthy air days in 30 yrs
- 15 days/yr
Risk factors via First Street. Map © Google.
Why this score? — see what drove the C+ grade
The composite is a weighted blend of 9 inputs, each scored 0–100. Each bar is that input's sub-score; the figure is the points it added to the 100-point composite (weight × sub-score).
- Cash flow +22.2/30.0
- ARV discount +15.0/15.0
- DSCR +7.1/10.0
- 1% rule +4.4/10.0
- Schools +4.3/10.0
- Livability +4.1/5.0
- Condition / age +2.5/5.0
- Rent growth +2.4/5.0
- Appreciation +0.0/10.0
$300,000
🖨 Deal sheet 📄 Offer letter ✓ Due diligence
Listing remarks MLS
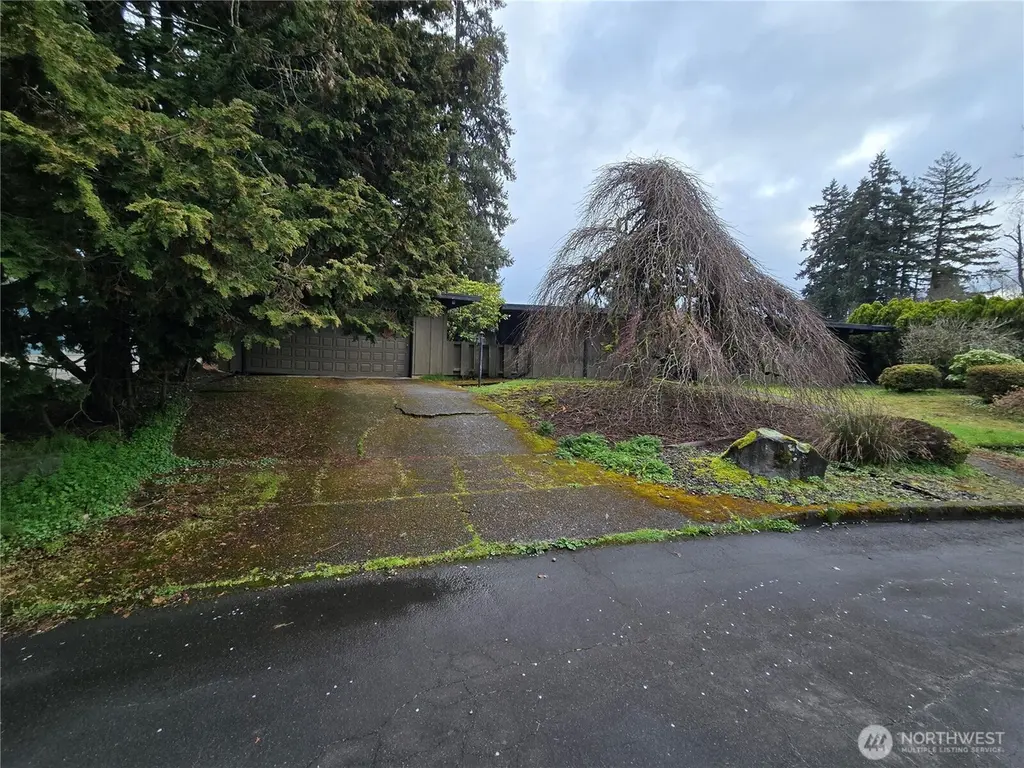
Opportunity knocks! This property backs directly to Green Meadows Golf Course, offering a prime setting that's hard to find and full of future potential. The existing single-level home is in significant disrepair, creating the perfect canvas for investors, builders, or buyers looking to design something new in an exceptional location. Garage visually appears to be in decent shape. Please write offers subject to interior inspection. No one will be approved to go inside until after an offer has been accepted. Cash offers only, this home will not finance!
Key facts
- Single-level home
- Exceptional location
- 0.27 acre lot
Tags
Property features AI
Finance
- Other: Bus line nearby
- Financial info: Listing terms: Cash
- HOA & community: CCRs; Golf community features; Senior exemption applies
Exterior
- Parking: Attached garage; Covered parking (2 spaces); Uncovered parking (2 spaces); Garage (total) with approximately 630 sq ft
- Utilities: Public water (City of Vancouver); Sewer connected (Clark Regional Waste); Power provided by Clark PUD
- Home design: Single family residence; One story; Main entry level; Faces southwest; Built on lot, detached; Effective year built 1968; Green Meadows community/building name; Property zoned R-9
- Construction: Wood construction; Flat roof (see remarks); Foundation details: see remarks
- Exterior features: Wood exterior; Dead-end street; Paved driveway and street; Sidewalk; Value in land; Has view
Interior
- Kitchen: Dishwasher; Microwave; Stove/Range
- Bedrooms: 4 bedrooms (all on the main level)
- Flooring: Vinyl; Carpet; See remarks (additional flooring details)
- Bathrooms: 1 full bath and 1 three-quarter bath (both on the main level); Total of 1 bathtub and 2 showers
- Heating & cooling: Heating present (see remarks); Cooling present
- Interior features: Fireplace
- Laundry & utility: Washer; Dryer; Water heater located in utility
Neighborhood map
What this means for you Summary
Snapshot
- This is a 4-bed/2.0-bath single-family listed at $300k.
Deal economics
- At list price, monthly cash flow is $486 ($6k/yr) — positive.
- The deal already cash-flows at list — no discount required.
- To meet the 1% rule (rent ≥ 1% of price), the offer needs to be $283k (5.5% below list).
- Recommended offer: $283k (5.5% below list) — sets the bar for 1% rule.
- Cap rate 8.2% vs local median 2.7% in Vancouver — top-decile yield for the area; either an underpriced asset or a hidden risk that comps aren't pricing in. Stress-test before assuming the spread holds.
Location & tenants
- Location reads 82/100 on livability (#62 in WA, #1,133 nationally) — a professional / high-income tenant draw. Strengths: amenities A+, commute A+, housing A+; Watch: crime F, cost of living D-.
- Vancouver School District (suburban): math 43% / reading 53% proficiency, ranked #156 of 291 in WA (top 54%) — families likely to look elsewhere, expect single-tenant / working-renter base with shorter leases.
- Zoned schools: Walnut Grove Elementary (654 students, 63% FRL); Fort Vancouver High School (1,547 students, 76% FRL) — zoned schools average 69% FRL vs 44% district-wide (25 pts higher); higher-poverty schools than district average — tighter screening recommended.
- Market conditions: Rents soft (-0.2%/yr); 219 active listings in the ZIP; 9 comparable units currently listed for rent nearby; rentals leasing fast (median 5d on market — plan ~1-2 weeks tenant-placement turnaround); solid renter incomes; 3,547 units permitted in Clark County in 2024 (1,361 in 5+ unit buildings).
- This rent runs 36% of the median local income ($94k/yr) — at the standard rent-burdened threshold; future hikes will face affordability resistance.
Forward outlook
- Local home prices are declining (-3.0%/yr); year-one equity from $2k of loan paydown is wiped out by about $9k of value loss. Plan a longer hold.
- Clark County population projected at +29% by 2050 — long-run rental-demand tailwind backs the buy-and-hold thesis.
Negotiation context
- It's been on market 16 days — a 2% lower offer ($296k) is reasonable based on typical stale-listing flexibility.
- 2 sale attempts with the ask held roughly flat each time — persistent listings suggest the price (not the market) is what's stuck; bring a comps-based counter.
Risks & watch-outs
- Watch-outs: built in 1901 — expect roof / HVAC / electrical / plumbing capex.
Questions for the listing agent
- Built in 1901 — when were the roof, HVAC, electrical panel, plumbing, and water heater last replaced?
- Is there a deadline driving the sale (1031 exchange, divorce, estate, relocation)? That informs how much negotiation room exists.
- Crime grade is F in this area — have there been break-ins, vandalism, or insurance claims at this property in the last 3 years? What carrier currently insures it and at what premium?
- What's the average days-on-market for RENTAL listings here right now (not sales)? A rising rental-DOM trend means longer vacancies and softer asking-rent achievability than the comps imply.
- What's the recent tenant-quality profile in this submarket — average credit score on applications, eviction rate, late-payment / NSF rate, and stable-employment percentage? A property-management company in the area should have these aggregated.
- How much new for-sale + rental construction is in the pipeline within 1–3 miles? Heavy new supply typically softens prices + rents 12–24 months out; constrained supply supports both.
Investment metrics
- 1% rule
- 0.94% ✗
- Cap rate
- 8.24%
- Cash-on-cash
- 6.94%
- DSCR
- 1.31
- GRM
- 8.8
CMA / ARV
- ARV (median comp)
- $553,430
- List price
- $300,000
- Delta
- -45.79%
- Verdict
- UNDERPRICED
- Comps
- 20 within 1.0 mi
Show comp detail 12 sales within ~0.75 mi
| Address | Dist | Beds/Ba | Sqft | Sold | Price | $/sf | Match |
|---|---|---|---|---|---|---|---|
| 7908 NE 69th St | 0.00mi | 4/2.0 | 2,304 (0%) | 0mo | $320,000 | $139 | 100 |
| 7908 NE 64th St | 0.23mi | 4/3.0 | 2,217 (-4%) | 2mo | $605,000 | $273 | 78 |
| 7517 NE 64th Cir | 0.34mi | 4/3.0 | 2,298 (-0%) | 7mo | $514,000 | $224 | 74 |
| 8310 NE 71st St | 0.24mi | 3/2.5 (-1) | 2,455 (+7%) | 0mo | $815,000 | $332 | 70 |
| 7205 NE 72nd Pl | 0.42mi | 3/3.0 (-1) | 2,426 (+5%) | 3mo | $480,000 | $198 | 60 |
| 7610 NE Meadows Dr | 0.43mi | 3/2.0 (-1) | 2,108 (-8%) | 3mo | $614,000 | $291 | 59 |
| 6214 NE 84th Ave | 0.34mi | 4/3.0 | 2,589 (+12%) | 4mo | $425,000 | $164 | 56 |
| 8635 NE 70th Cir | 0.36mi | 4/3.0 | 1,968 (-15%) | 4mo | $534,000 | $271 | 52 |
| 8615 NE 69th St | 0.37mi | 4/3.0 | 2,621 (+14%) | 7mo | $610,000 | $233 | 50 |
| 6504 NE 66th Ave | 0.70mi | 4/3.0 | 2,038 (-12%) | 6mo | $694,000 | $341 | 39 |
| 8003 NE 87th Ave | 0.70mi | 4/2.5 | 1,995 (-13%) | 6mo | $532,950 | $267 | 38 |
| 5401 NE 79th Ave | 0.74mi | 4/3.0 | 1,998 (-13%) | 2mo | $595,000 | $298 | 38 |
Match score weights: distance 35% · size 25% · config 20% · recency 20%. Top-matched comps best support the ARV.
Projected returns pro-forma
-3.0% appreciation · 0.0% rent growth · sell at horizon
- IRR
- -8.7%
- Equity multiple
- 0.69×
- Total profit
- $-26,120
- Equity at exit
- $44,731
- IRR
- -3.2%
- Equity multiple
- 0.81×
- Total profit
- $-15,612
- Equity at exit
- $25,939
Cash invested: $84,000 (down + closing). Projections, not guarantees.
Landlord ↔ Tenant lean methodology
- Overall (STATE)
- 28 Tenant-Leaning
- State Washington
- 28 Tenant-Leaning · D+8
- County
- — inherits STATE
- City
- — inherits STATE
ZIP-level market 98662
- Rents YoY
- -0.2%
- Active inventory
- 219
- Price-to-rent
- 8.8×
Monthly cashflow live
- Estimated rent
- $2,834 high interval (Pro) →
- Mortgage (P&I)
- −$1,573
- Tax from tax record
- −$55 /mo · $656/yr
- Insurance
- −$125
- HOA
- −$0
- Vacancy / Maint / Mgmt
- −$595
- Net cashflow
- $486
Break-even live
UW: 25.0% down · 7.5% · 30yr · 1.5% tax · 5.0% vac · 8.0% maint · 8.0% mgmt
Financing live
Cash to close
- Down payment
- $75,000
- Closing costs
- $9,000
- Reserves months
- —
- Total cash needed
- —
Loan-product check · same deal, 3 products live
Conventional
25% down · 7.5% · 30yr
- Down + closing
- —
- Monthly P&I
- —
- Monthly cashflow
- —
- DSCR
- —
- Eligible?
- —
Personal DTI + credit; lowest rate.
DSCR
20% down · 8.5% · 30yr
- Down + closing
- —
- Monthly P&I
- —
- Monthly cashflow
- —
- DSCR
- —
- Eligible?
- —
No personal income docs; deal must DSCR.
Hard money
10% down · 12.0% · 12mo
- Down + closing
- —
- Monthly P&I
- —
- Monthly cashflow
- —
- DSCR
- —
- Eligible?
- —
Short-term bridge; refi at stabilization.
Rent comps 9 comps
| Address | Beds | Baths | Sqft | Rent | $/sqft | DOM | Units | Dist |
|---|---|---|---|---|---|---|---|---|
| 8609 NE 70th Cir Vancouver, WA | 4.0 | 3.0 | 2123 | $3,190 | $1.50 | 44d | 1 | 0.29mi |
| 6108 NE 84th Ave Vancouver, WA | 3.0 | 3.0 | 2975 | $3,420 | $1.15 | 2d | 1 | 0.38mi |
| 7610 NE 61st Way Vancouver, WA | 3.0 | 2.5 | 1792 | $2,450 | $1.37 | 4d | 1 | 0.38mi |
| 7615 NE 60th Way Vancouver, WA | 4.0 | 2.5 | 1954 | $2,969 | $1.52 | 2d | 1 | 0.42mi |
| 7105 NE 76th Way Vancouver, WA | 3.0 | 2.5 | 1713 | $2,550 | $1.49 | 22d | 9 | 0.57mi |
| 5502 NE 89th Ave Vancouver, WA | 3.0 | 2.5 | 1723 | $2,395 | $1.39 | 2d | 1 | 0.79mi |
| 8907 NE 84th St Vancouver, WA | 5.0 | 2.5 | 2526 | $3,295 | $1.30 | 4d | 1 | 0.89mi |
| 5811 NE 56th Pl Vancouver, WA | 3.0 | 2.5 | 1608 | $2,495 | $1.55 | 23d | 1 | 1.20mi |
| 10300 NE 61st Cir Unit 10404 Vancouver, WA | 3.0 | 2.5 | 1653 | $2,495 | $1.51 | 7d | 1 | 1.23mi |
Listing history 3 events
-
2026-05-05$300,000 Active
Show marketing remark (558 chars)
Opportunity knocks! This property backs directly to Green Meadows Golf Course, offering a prime setting that's hard to find and full of future potential. The existing single-level home is in significant disrepair, creating the perfect canvas for investors, builders, or buyers looking to design something new in an exceptional location. Garage visually appears to be in decent shape. Please write offers subject to interior inspection. No one will be approved to go inside until after an offer has been accepted. Cash offers only, this home will not finance!
-
2026-05-05$300,000 Active 558-char remark
Show marketing remark (558 chars)
Opportunity knocks! This property backs directly to Green Meadows Golf Course, offering a prime setting that's hard to find and full of future potential. The existing single-level home is in significant disrepair, creating the perfect canvas for investors, builders, or buyers looking to design something new in an exceptional location. Garage visually appears to be in decent shape. Please write offers subject to interior inspection. No one will be approved to go inside until after an offer has been accepted. Cash offers only, this home will not finance!
-
1971-07-01soldstatus $40,500
ⓘ Source: listings_history table (triggers on properties + properties_extension) + one-shot
backfill from property_details.listing_events for pre-trigger history.
Tax reassessment forecast WA · Resets to sale price
- Current annual tax
- $656 · $55/mo
- Projected year-2 tax
- $2,940 · $245/mo
- Expected delta
- +$2,284/yr (+$190/mo · 348.3%)
ⓘ Screening estimate from a state-policy table — verify with the county assessor before closing.
Climate risk First Street
- Flood 1/10 Low FEMA zone X (unshaded) · 0% chance over 30 yrs
- Wildfire 3/10 Moderate
- Heat 3/10 Moderate 7 d/yr ≥91°F today · 15 d/yr by 30 yrs out
- Wind 1/10 Low
- Air quality 9/10 Extreme 15 unhealthy d/yr today · 15 by 30 yrs out
Nearby sold comps map
Loading sold comps map…
Walkable amenities ~0.75 mi
Loading nearby amenities…
Taxation est. · year 1
- Rental income
- $34,008
- − Mortgage interest
- −$16,805
- − Property taxes
- −$656
- − Insurance
- −$1,500
- − Repairs & maintenance
- −$2,721
- − Management
- −$2,721
- − Depreciation
- −$8,727
- Taxable income
- $879
- Est. tax owed @ 24.0%
- −$211
- After-tax cash flow
- $5,621/yr
For passive investors: Depreciation is non-cash, so a rental often shows a tax loss while cash-flowing — sheltering income. Rental losses are passive: they offset passive income freely, and up to $25,000/yr can offset ordinary (W-2) income if you actively participate and your MAGI is under $100k (phasing out to $0 by $150k); unused losses carry forward. On sale, claimed depreciation is recaptured at up to 25%, and gains may owe capital-gains tax (a 1031 exchange can defer both). Figures are a year-1 estimate at your 24.0% rate — not tax advice; consult a CPA.
Schools (NCES district)
- District
- Vancouver School District
- NCES district ID
- 5309270
- Math proficiency
- 43% ▬ 0.00%
- Reading proficiency
- 53% ▬ 0.00%
- Median HH income
- $52,562
- Composite
- 43.45/100
- National rank
- #6479
- State rank
- #156 of 291 in WA
Livability — Vancouver
- Score
- 82/100
- State rank
- #62
- US rank
- #1133
Category grades
Schools grade is shown separately in the Schools card above.
Census & demographics
- Census place
- Vancouver, WA
- County
- Clark County · 513,189 people
- City population
- 360,195
- Metro
- Portland-Vancouver-Hillsboro, OR-WA
- Population (ZIP)
- 37,723
- Household income
- $94,303
- Rent vs Own
- Severe rent burden
- 1189.0
Population outlook (Clark County) Hauer SSP2
- Today (2025)
- 529,610 people
- By 2030
- 563,242 · +6.4%
- By 2040
- 625,905 · +18.2%
- By 2050
- 681,558 · +28.7%
- By 2075
- 805,967 · +52.2%
- By 2100
- 877,450 · +65.7%
Race, ethnicity, and origin ACS 2023
- Neighborhood character
- Predominantly White (73%)
- Race & ethnicity
- White 73% Hispanic / Latino 11% Two or more races 10% Asian 6% Black 3%
- Hispanic origin (detail)
- Mexican 9%
- Common ancestry
- Subsaharan African 4% Italian 4% Portuguese 3%
- Foreign-born
- 16% · Canada, Vietnam, China
- Languages at home
- 78% English-only · Russian/Polish/Slavic 8% Spanish 7% Other Indo-European 3%
Political lean MEDSL · Clark
- 2024 margin
- Lean D (+7.0) · D 52.1% · R 45.1% · Other 2.8%
- 2008→2024 swing
- +0.9pp no change · 2008: 6.1pp · 2024: 7.0pp
- All cycles
- 2024: D+7.0 2020: D+5.1 2016: D+0.1 2012: D+0.1 2008: D+6.1
Not yet ingested
- Civics
- —
Market trends
- HPI YoY
- ▼ -322.04%
- Current HPI
- 304.1275
- Rent YoY
- ▼ -0.21%
- Metro
- Portland-Vancouver-Hillsboro, OR-WA
- State GDP YoY
- ▲ 4.65%
- F500 in state
- 22
Industry mix (Fortune 500 HQ in WA)
| Industry | F500 HQs | Revenue |
|---|---|---|
| Retail | 2 | $269B |
|
||
| Technology / Retail | 1 | $638B |
|
||
| Technology | 1 | $245B |
|
||
| Telecommunications | 1 | $38B |
|
||
| Food / Beverage | 1 | $36B |
|
||
| Automotive / Trucks | 1 | $34B |
|
||
Price history
+690.1% since first listed7 events — show timeline
- 2026-06-12 Sold (MLS) $320,000 RMLS
- 2026-06-12 Sold (MLS) $320,000 NWMLS as Distributed by MLS Grid
- 2026-05-21 Pending — NWMLS as Distributed by MLS Grid
- 2026-05-21 Pending — RMLS
- 2026-05-05 Listed $300,000 RMLS
- 2026-05-05 Listed $300,000 NWMLS as Distributed by MLS Grid
- 1971-07-01 Sold (Public Records) $40,500 Public Records
Property tax history
-9.3%/yrLatest (2026): $656 · -0.6% YoY. Source: county tax records.
Cash-flow waterfall
monthlySold comps — $/sqft
last 12 mo · ≤1 miLoading sold comps…