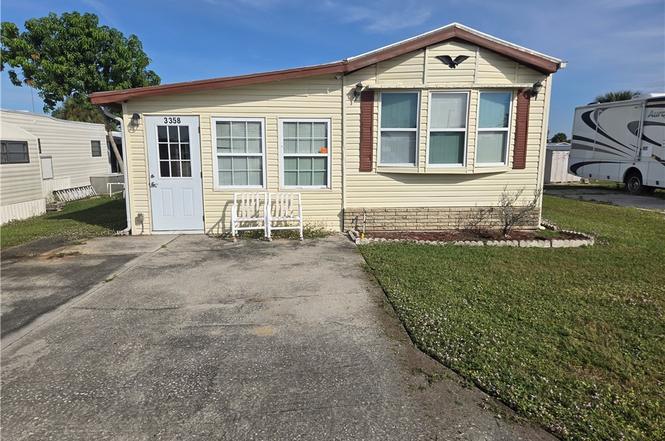
3358 Freddie Way · Avon Park, FL
Flood risk 1/10 · Minimal
- FEMA flood zone
- X (unshaded)
- Chance of flooding over 30 yrs
- 0.0%
- Est. flood insurance / yr
- $507 – $1,088
Fire risk 4/10 · Minor
- Est. fire insurance / yr
- $947 – $1,759
Heat risk 8/10 · Major
- Hot days now (above 107°F)
- 6 days/yr
- Hot days in 30 yrs
- 21 days/yr
Wind risk 9/10 · Severe
- Chance of severe wind over 30 yrs
- 99.0%
Air-quality risk 2/10 · Minimal
- Unhealthy air days now
- 2 days/yr
- Unhealthy air days in 30 yrs
- 2 days/yr
Risk factors via First Street. Map © Google.
Why this score? — see what drove the D grade
The composite is a weighted blend of 9 inputs, each scored 0–100. Each bar is that input's sub-score; the figure is the points it added to the 100-point composite (weight × sub-score).
- Cash flow +15.0/30.0
- ARV discount +7.5/15.0
- 1% rule +5.0/10.0
- DSCR +5.0/10.0
- Schools +3.6/10.0
- Livability +3.6/5.0
- Rent growth +2.5/5.0
- Condition / age +2.5/5.0
- Appreciation +0.0/10.0
$9,900
🖨 Deal sheet 📄 Offer letter ✓ Due diligence
Listing remarks
Cute affordable winter residence in Central Florida. Check this out. .. .can't go wrong on this winter escape. Affordable monthly lot rent includes trash pick-up, use of all recreational facilities and all utilities except electric. This 55+ community is located just West of South Florida State College, is close to many fresh water lakes, golf courses and Sebring International Race Track as well as hospitals, restaurants and shopping. The park model has a spacious Florida room with newer windows and a utility/storage room for laundry. Amenities include Spa/swimming pool, pickleball and shuffleboard courts, fishing dock, horseshoes plus a large clubhouse for organized activities. The park is
Key facts
- Fishing dock
- Large clubhouse
- Pet friendly
Tags
Property features AI
Finance
- HOA & community: Land is leased (monthly land lease: $645); Community clubhouse
Exterior
- Parking: 2 parking spaces
- Utilities: Public water; Public sewer; Sewer available; Cable available
- Home design: Manufactured in park (mobile home); Single-wide; One level; Located in a senior community; Park name: Reflections On Silver Lake; Zoning: MH/RL
- Construction: Aluminum siding and frame construction; Metal/other roof
- Exterior features: Awnings; Enclosed patio/porch; Side porch; Shed(s); Workshop; Community pool
Interior
- Kitchen: Gas range; Microwave; Refrigerator
- Bedrooms: Total rooms: 6
- Flooring: Carpet; Linoleum
- Bathrooms: 1 full bathroom
- Heating & cooling: Central heating (electric); Central air conditioning (electric)
- Interior features: Ceiling fans; Blinds; Furnished
- Laundry & utility: Washer; Dryer
Neighborhood map
What this means for you Summary
Snapshot
- This is a 1-bed/1.0-bath manufactured listed at $10k.
Deal economics
- At list price, monthly cash flow is $695 ($8k/yr) — positive.
- The deal already cash-flows at list — no discount required.
- Meets the 1% rule at list price ($967 rent vs $10k).
- Recommended offer: $9k (12.0% below list) — sets the bar for market timing.
- Cap rate 90.6% vs local median 3.9% in Avon Park — top-decile yield for the area; either an underpriced asset or a hidden risk that comps aren't pricing in. Stress-test before assuming the spread holds.
Location & tenants
- Location reads 71/100 on livability (#407 in FL) — a middle-class / working-renter tenant base. Strengths: cost of living A+, housing A+, health & safety A+; Watch: crime D+, amenities F, commute F.
- Highlands (other): math 45% / reading 43% proficiency, ranked #54 of 73 in FL (top 74%) — families likely to look elsewhere, expect single-tenant / working-renter base with shorter leases; 68% free/reduced lunch — lower-income household profile, screen leases tightly.
- Zoned schools: Avon Park Middle School (math 37% / reading 35%, grade F, #410 of 571 statewide, top 72%, 638 students, 77% FRL); Avon Park High School (math 35% / reading 39%, grade F, #340 of 667 statewide, top 52%, 928 students, 67% FRL) — zoned schools at 72% FRL track the district average.
- Market conditions: 475 active listings in the ZIP; 980 units permitted in Highlands County in 2024 (80 in 5+ unit buildings).
Forward outlook
- Local home prices are declining (-3.0%/yr); year-one equity from $68 of loan paydown is wiped out by about $297 of value loss. Plan a longer hold.
- At projected returns (-3.0% appreciation + 3.0% rent growth), your $3k cash investment doubles in ~1 year — after that, you're playing with house money.
Negotiation context
- It's been on market 219 days — a 12% lower offer ($9k) is reasonable based on typical stale-listing flexibility.
Risks & watch-outs
- Climate carrying-cost: severe wind risk, 99% chance of damaging wind over 30y; extreme-heat days projected 6→21/yr by 2055 (HVAC capex compounding) — expect insurance premiums to compound above CPI over the hold.
Questions for the listing agent
- It's been on market 219 days. Have you received any prior offers? Is the seller open to a 12% concession, seller financing, or rate buy-down credit?
- Why hasn't it sold? Are there any deal-killer items the seller is aware of (foundation, flood, title, zoning, code violations)?
- Is there a deadline driving the sale (1031 exchange, divorce, estate, relocation)? That informs how much negotiation room exists.
- Schools are F-rated, which usually means shorter tenancies and higher turnover. Who's the typical renter profile here, and what's been the actual vacancy rate?
- Crime grade is D in this area — have there been break-ins, vandalism, or insurance claims at this property in the last 3 years? What carrier currently insures it and at what premium?
- The area grade is low — what's the realistic commute time and amenity access for the typical tenant pool here? Any planned neighborhood developments (good or bad) we should know about?
- What's the average days-on-market for RENTAL listings here right now (not sales)? A rising rental-DOM trend means longer vacancies and softer asking-rent achievability than the comps imply.
- What's the recent tenant-quality profile in this submarket — average credit score on applications, eviction rate, late-payment / NSF rate, and stable-employment percentage? A property-management company in the area should have these aggregated.
- How much new for-sale + rental construction is in the pipeline within 1–3 miles? Heavy new supply typically softens prices + rents 12–24 months out; constrained supply supports both.
Investment metrics
- 1% rule
- 9.77% ✓
- Cap rate
- 90.59%
- Cash-on-cash
- 301.07%
- DSCR
- 14.40
- GRM
- 0.9
CMA / ARV
No comps found within radius.
Projected returns pro-forma
-3.0% appreciation · 3.0% rent growth · sell at horizon
- IRR
- —
- Equity multiple
- 16.41×
- Total profit
- $42,705
- Equity at exit
- $1,476
- IRR
- —
- Equity multiple
- 35.01×
- Total profit
- $94,283
- Equity at exit
- $856
Cash invested: $2,772 (down + closing). Projections, not guarantees.
Landlord ↔ Tenant lean methodology
- Overall (STATE)
- 87 Strongly Landlord-Friendly
- State Florida
- 87 Strongly Landlord-Friendly · R+3
- County
- — inherits STATE
- City
- — inherits STATE
ZIP-level market 33825
- Home prices YoY
- -25.9%
- Active inventory
- 475
- Price-to-rent
- 0.9×
Monthly cashflow live
- Estimated rent
- $967 medium interval (Pro) →
- Mortgage (P&I)
- −$52
- Tax est. 1.5%
- −$12 /mo · $148/yr
- Insurance
- −$4
- HOA
- −$0
- Vacancy / Maint / Mgmt
- −$203
- Net cashflow
- $695
Break-even live
UW: 25.0% down · 7.5% · 30yr · 1.5% tax · 5.0% vac · 8.0% maint · 8.0% mgmt
Financing live
Cash to close
- Down payment
- $2,475
- Closing costs
- $297
- Reserves months
- —
- Total cash needed
- —
Loan-product check · same deal, 3 products live
Conventional
25% down · 7.5% · 30yr
- Down + closing
- —
- Monthly P&I
- —
- Monthly cashflow
- —
- DSCR
- —
- Eligible?
- —
Personal DTI + credit; lowest rate.
DSCR
20% down · 8.5% · 30yr
- Down + closing
- —
- Monthly P&I
- —
- Monthly cashflow
- —
- DSCR
- —
- Eligible?
- —
No personal income docs; deal must DSCR.
Hard money
10% down · 12.0% · 12mo
- Down + closing
- —
- Monthly P&I
- —
- Monthly cashflow
- —
- DSCR
- —
- Eligible?
- —
Short-term bridge; refi at stabilization.
Listing history 18 events
-
2026-06-19days on market $9,900 Active 219 DOM
-
2026-06-18days on market $9,900 Active 218 DOM
-
2026-06-17days on market $9,900 Active 217 DOM
-
2026-06-16days on market $9,900 Active 216 DOM
-
2026-06-15days on market $9,900 Active 215 DOM
-
2026-06-14days on market $9,900 Active 213 DOM
-
2026-06-10days on market $9,900 Active 211 DOM
-
2026-06-09days on market $9,900 Active 210 DOM
-
2026-06-08days on market $9,900 Active 209 DOM
-
2026-06-07days on market $9,900 Active 208 DOM
-
2026-06-02days on market $9,900 Active 203 DOM
-
2026-06-01days on market $9,900 Active 202 DOM
-
2026-05-31days on market $9,900 Active 201 DOM
-
2026-05-30days on market $9,900 Active 200 DOM
-
2026-04-21price $9,900
-
2026-02-17price $16,000
-
2026-01-08price $22,000
-
2025-11-08$27,000 Active
ⓘ Source: listings_history table (triggers on properties + properties_extension) + one-shot
backfill from property_details.listing_events for pre-trigger history.
Climate risk First Street
- Flood 1/10 Low FEMA zone X (unshaded) · 0% chance over 30 yrs
- Wildfire 4/10 Moderate
- Heat 8/10 Severe 6 d/yr ≥107°F today · 21 d/yr by 30 yrs out
- Wind 9/10 Extreme 99% chance of damaging wind over 30 yrs
- Air quality 2/10 Low 2 unhealthy d/yr today · 2 by 30 yrs out
Nearby sold comps map
Loading sold comps map…
Walkable amenities ~0.75 mi
Loading nearby amenities…
Taxation est. · year 1
- Rental income
- $11,603
- − Mortgage interest
- −$555
- − Property taxes
- −$148
- − Insurance
- −$50
- − Repairs & maintenance
- −$928
- − Management
- −$928
- − Depreciation
- −$288
- Taxable income
- $8,706
- Est. tax owed @ 24.0%
- −$2,090
- After-tax cash flow
- $6,256/yr
For passive investors: Depreciation is non-cash, so a rental often shows a tax loss while cash-flowing — sheltering income. Rental losses are passive: they offset passive income freely, and up to $25,000/yr can offset ordinary (W-2) income if you actively participate and your MAGI is under $100k (phasing out to $0 by $150k); unused losses carry forward. On sale, claimed depreciation is recaptured at up to 25%, and gains may owe capital-gains tax (a 1031 exchange can defer both). Figures are a year-1 estimate at your 24.0% rate — not tax advice; consult a CPA.
Schools (NCES district)
- District
- Highlands
- NCES district ID
- 1200840
- Math proficiency
- 45% ▼ -7.00%
- Reading proficiency
- 43% ▼ -3.00%
- Median HH income
- $35,276
- Composite
- 36.42/100
- National rank
- #4672
- State rank
- #54 of 73 in FL
Livability — Avon Park
- Score
- 71/100
- State rank
- #407
- US rank
- #7205
Category grades
Schools grade is shown separately in the Schools card above.
Census & demographics
- County
- Highlands County · 98,898 people
- City population
- 25,501
- Metro
- Sebring-Avon Park, FL
- Population (ZIP)
- 25,501
- Household income
- $46,949
- Rent vs Own
- Severe rent burden
- 691.0
Population outlook (Highlands County) Hauer SSP2
- Today (2025)
- 99,674 people
- By 2030
- 99,615 · -0.1%
- By 2040
- 99,342 · -0.3%
- By 2050
- 98,242 · -1.4%
- By 2075
- 93,291 · -6.4%
- By 2100
- 79,894 · -19.8%
Race, ethnicity, and origin ACS 2023
- Neighborhood character
- Diverse neighborhood (Simpson 0.64)
- Race & ethnicity
- White 51% Hispanic / Latino 27% Black 17% Two or more races 11% Asian 1%
- Hispanic origin (detail)
- Mexican 8% Puerto Rican 13% Cuban 2%
- Common ancestry
- Slovak 2% Lithuanian 2% Iranian 1%
- Foreign-born
- 10% · Canada, Vietnam, Guatemala
- Languages at home
- 74% English-only · Spanish 24% Tagalog/Filipino 1%
Political lean MEDSL · Highlands
- 2024 margin
- Solid R (+40.8) · D 29.3% · R 70.1%
- 2008→2024 swing
- -22.7pp toward R · 2008: -18.1pp · 2024: -40.8pp
- All cycles
- 2024: R+40.8 2020: R+34.4 2016: R+32.0 2012: R+23.0 2008: R+18.1
Not yet ingested
- Civics
- —
Market trends
- HPI YoY
- ▼ -98.54%
- Current HPI
- 281.8067
- Rent YoY
- —
- Metro
- Sebring-Avon Park, FL
- State GDP YoY
- ▲ 3.28%
- F500 in state
- 36
Industry mix (Fortune 500 HQ in FL)
| Industry | F500 HQs | Revenue |
|---|---|---|
| Industrial Technology | 2 | $29B |
|
||
| Insurance | 2 | $17B |
|
||
| Retail | 1 | $60B |
|
||
| Technology Distribution | 1 | $58B |
|
||
| Homebuilding | 1 | $35B |
|
||
| Technology Manufacturing | 1 | $35B |
|
||
Price history
-63.3% since first listed4 events — show timeline
- 2026-04-21 Price Changed $9,900 HAOR as distributed by MLS GRID
- 2026-02-17 Price Changed $16,000 HAOR as distributed by MLS GRID
- 2026-01-08 Price Changed $22,000 HAOR as distributed by MLS GRID
- 2025-11-08 Listed $27,000 HAOR as distributed by MLS GRID
Cash-flow waterfall
monthlySold comps — $/sqft
last 12 mo · ≤1 miLoading sold comps…