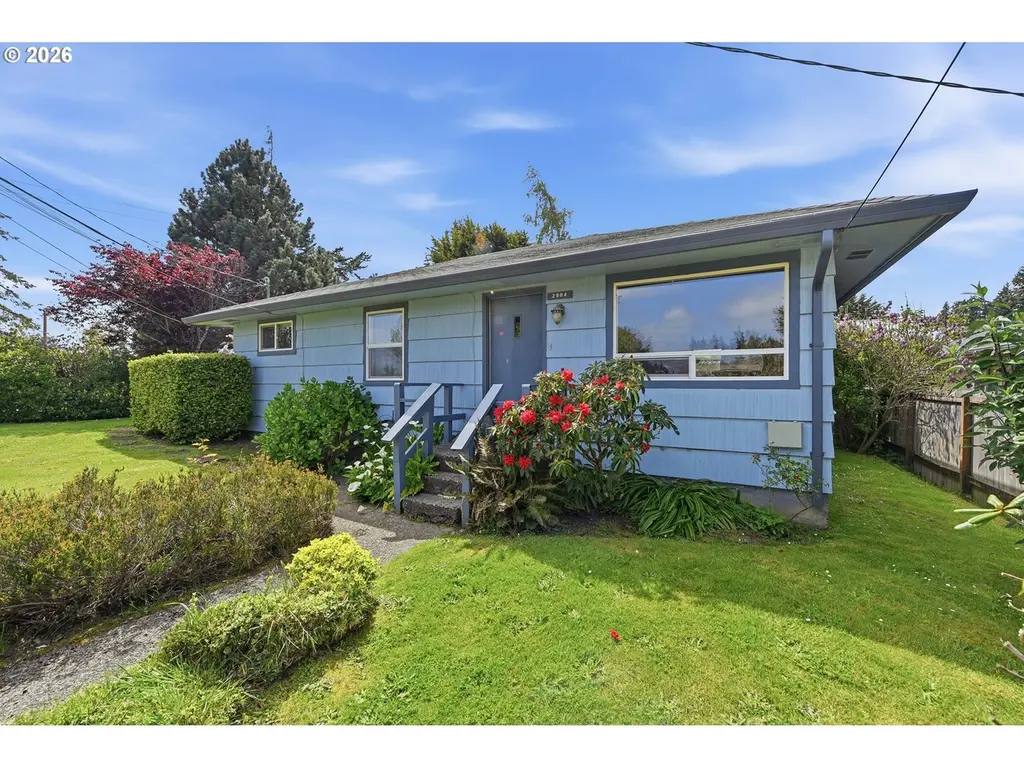
2984 Myrtle St · North Bend, OR
Flood risk 1/10 · Minimal
- FEMA flood zone
- X (unshaded)
- Chance of flooding over 30 yrs
- 0.0%
- Est. flood insurance / yr
- $507 – $1,088
Fire risk 1/10 · Minimal
- Est. fire insurance / yr
- $498 – $926
Heat risk 1/10 · Minimal
- Hot days now (above 76°F)
- 8 days/yr
- Hot days in 30 yrs
- 22 days/yr
Wind risk 1/10 · Minimal
- Chance of severe wind over 30 yrs
- —
Air-quality risk 6/10 · Moderate
- Unhealthy air days now
- 9 days/yr
- Unhealthy air days in 30 yrs
- 9 days/yr
Risk factors via First Street. Map © Google.
Why this score? — see what drove the C- grade
The composite is a weighted blend of 9 inputs, each scored 0–100. Each bar is that input's sub-score; the figure is the points it added to the 100-point composite (weight × sub-score).
- ARV discount +13.2/15.0
- Cash flow +12.1/30.0
- Appreciation +10.0/10.0
- DSCR +3.6/10.0
- Livability +3.6/5.0
- Schools +3.3/10.0
- 1% rule +2.6/10.0
- Rent growth +2.5/5.0
- Condition / age +2.5/5.0
$299,000
🖨 Deal sheet 📄 Offer letter ✓ Due diligence
Listing remarks MLS
GLEAMING HARDWOOD FLOORS, COUNTRY OAK KITCHEN AND ALL NEW VINYL WINDOWS LEAD YOU TO EXTRA LARGE MASTER WITH IT OWN LUXURY SPA BATH~ITALIAN TILE, JACUZZI TUB, DUAL HEAD SHOWER~IT'S A MUST SEE! 2BD/2BTH WITH UNFINISHED FAMILY ROOM(INCLUDED IN SQ. FT.) FOR MORE POTENTIAL SPACE.
Key facts
- 8,276 sq ft lot
- Built 1953
- Listed 6 days
Property features AI
Finance
- Other: Main level area approximately 1,656 (as provided)
Exterior
- Parking: Driveway; Off-street parking
- Utilities: Electricity fuel; Public water; Public sewer
- Home design: Single-family residence; Residential property; Not attached; Main level living (primary bedroom and bathrooms on main level); Built in 1953; Corner, level lot
- Construction: Built in 1953; Cedar exterior; Crawl space foundation
- Exterior features: Deck; Fenced yard; Yard; Cedar exterior
Interior
- Kitchen: Free-standing range; Free-standing refrigerator; Dishwasher; Garbage disposal
- Bedrooms: Primary bedroom on main level with bathtub and wood floors; Second bedroom; Third bedroom
- Flooring: Wood floors
- Bathrooms: Two full bathrooms (both on the main level)
- Heating & cooling: Zoned heating; No cooling specified
- Interior features: Hardwood floors; Jetted tub; Laundry area; Pellet stove fireplace; Minimal steps (accessibility)
- Laundry & utility: Laundry area (in-home)
Neighborhood map
What this means for you Summary
Snapshot
- This is a 3-bed/1.0-bath single-family listed at $299k.
Deal economics
- At list price, monthly cash flow is $-64 ($-764/yr) — negative.
- To cash-flow at today's rent, offer at most $288k (3.8% below list).
- To meet the 1% rule (rent ≥ 1% of price), the offer needs to be $226k (24.3% below list).
- Recommended offer: $226k (24.3% below list) — sets the bar for 1% rule.
- Cap rate 6.0% vs local median 3.6% in North Bend — top-decile yield for the area; either an underpriced asset or a hidden risk that comps aren't pricing in. Stress-test before assuming the spread holds.
Location & tenants
- Location reads 72/100 on livability (#105 in OR) — a middle-class / working-renter tenant base. Strengths: housing A+, health & safety A+, cost of living B+; Watch: employment C-, amenities F, commute F.
- North Bend SD 13 (town): math 30% / reading 47% proficiency, ranked #21 of 58 in OR (top 36%) — families likely to look elsewhere, expect single-tenant / working-renter base with shorter leases.
- Zoned schools: Hillcrest Elementary School (math 47% / reading 57%, grade C-, #93 of 412 statewide, top 23%, 489 students, 68% FRL); North Bend Middle School (math 24% / reading 45%, grade F, #61 of 128 statewide, top 54%, 494 students, 68% FRL); North Bend Senior High School (math 75% / reading 75%, grade A-, #2 of 143 statewide, top 6%, 731 students, 30% FRL) — zoned schools average 55% FRL vs 40% district-wide (15 pts higher); higher-poverty schools than district average — tighter screening recommended.
- Zoned-school proficiency averages 54% at this address vs 38% district-wide (+15 pts) — the actual schools serving this property are materially stronger than the North Bend SD 13 average implies; a family-tenant draw the district grade alone would hide.
- Market conditions: 170 active listings in the ZIP; 4 comparable units currently listed for rent nearby; rentals lingering (median 44d on market — plan ~5-8 weeks vacancy on turnover, expect pricing pressure); 100% of comp listings sitting > 30 days — soft ceiling on asking rent; 122 units permitted in Coos County in 2024 (16 in 5+ unit buildings).
Forward outlook
- In year one you build about $32k of equity ($2k loan paydown + $30k appreciation (10.0% local appreciation)).
- Coos County population projected to shrink 9% by 2050 — rents likely to lag national; underwrite the cash flow, not the appreciation.
- At projected returns (10.0% appreciation + 3.0% rent growth), your $84k cash investment doubles in ~3 years — after that, you're playing with house money.
- By year 2, paydown + projected appreciation supports a ~$51k cash-out refi (75% LTV) — recoverable capital for the next deal without selling this one.
Negotiation context
- Only 6 days on market — expect competitive offers; lowballing is unlikely to land.
- 3 sale attempts since 29y ago with the ask held roughly flat each time — persistent listings suggest the price (not the market) is what's stuck; bring a comps-based counter.
Risks & watch-outs
- Watch-outs: built in 1953 — expect roof / HVAC / electrical / plumbing capex.
Questions for the listing agent
- What do current leases actually rent for vs. the listed asking? Can we see a recent rent roll and the last 12 months of T-12 income?
- Built in 1953 — when were the roof, HVAC, electrical panel, plumbing, and water heater last replaced?
- Is there a deadline driving the sale (1031 exchange, divorce, estate, relocation)? That informs how much negotiation room exists.
- Schools are B-rated — typically a magnet for longer-tenancy family renters. What's the average tenant stay here, and is there a school-zone premium baked into asking?
- What's the average days-on-market for RENTAL listings here right now (not sales)? A rising rental-DOM trend means longer vacancies and softer asking-rent achievability than the comps imply.
- What's the recent tenant-quality profile in this submarket — average credit score on applications, eviction rate, late-payment / NSF rate, and stable-employment percentage? A property-management company in the area should have these aggregated.
- How much new for-sale + rental construction is in the pipeline within 1–3 miles? Heavy new supply typically softens prices + rents 12–24 months out; constrained supply supports both.
Investment metrics
- 1% rule
- 0.76% ✗
- Cap rate
- 6.04%
- Cash-on-cash
- -0.91%
- DSCR
- 0.96
- GRM
- 11.0
CMA / ARV
- ARV (median comp)
- $342,466
- List price
- $299,000
- Delta
- -12.69%
- Verdict
- UNDERPRICED
- Comps
- 20 within 1.0 mi
Show comp detail 12 sales within ~0.75 mi
| Address | Dist | Beds/Ba | Sqft | Sold | Price | $/sf | Match |
|---|---|---|---|---|---|---|---|
| 2984 Myrtle St | 0.00mi | 3/2.0 | 1,656 (0%) | 0mo | $312,500 | $189 | 96 |
| 2160 Lombard St | 0.07mi | 4/2.0 (+1) | 1,619 (-2%) | 3mo | $225,000 | $139 | 82 |
| 1289 Ford Ln | 0.56mi | 3/3.0 | 1,703 (+3%) | 1mo | $475,000 | $279 | 60 |
| 3511 Scott Ct | 0.59mi | 3/2.0 | 1,592 (-4%) | 5mo | $338,500 | $213 | 57 |
| 2292 Clark St | 0.17mi | 4/2.0 (+1) | 1,464 (-12%) | 8mo | $420,000 | $287 | 57 |
| 2238 Marion St | 0.61mi | 4/1.0 (+1) | 1,562 (-6%) | 4mo | $302,000 | $193 | 54 |
| 2143 Ash St | 0.70mi | 3/3.0 | 1,620 (-2%) | 5mo | $390,000 | $241 | 52 |
| 1033 Ohio Ave | 0.66mi | 2/1.0 (-1) | 1,700 (+3%) | 11mo | $345,000 | $203 | 51 |
| 2232 Broadway Ave | 0.57mi | 3/1.0 | 1,416 (-14%) | 2mo | $150,000 | $106 | 48 |
| 2390 Madrona St | 0.47mi | 3/2.0 | 1,466 (-12%) | 9mo | $329,000 | $224 | 47 |
| 2691 14th St | 0.57mi | 3/2.0 | 1,422 (-14%) | 2mo | $330,000 | $232 | 44 |
| 2579 Pony Creek Rd | 0.63mi | 3/3.0 | 1,458 (-12%) | 4mo | $415,000 | $285 | 39 |
Match score weights: distance 35% · size 25% · config 20% · recency 20%. Top-matched comps best support the ARV.
Projected returns pro-forma
10.0% appreciation · 3.0% rent growth · sell at horizon
- IRR
- 23.6%
- Equity multiple
- 2.90×
- Total profit
- $158,690
- Equity at exit
- $269,363
- IRR
- 21.0%
- Equity multiple
- 6.62×
- Total profit
- $470,313
- Equity at exit
- $580,891
Cash invested: $83,720 (down + closing). Projections, not guarantees.
Landlord ↔ Tenant lean methodology
- Overall (STATE)
- 28 Tenant-Leaning
- State Oregon
- 28 Tenant-Leaning · D+6
- County
- — inherits STATE
- City
- — inherits STATE
ZIP-level market 97459
- Home prices YoY
- 1.6%
- Active inventory
- 170
- Price-to-rent
- 11.0×
Monthly cashflow live
- Estimated rent
- $2,264 medium interval (Pro) →
- Mortgage (P&I)
- −$1,568
- Tax from tax record
- −$160 /mo · $1,920/yr
- Insurance
- −$125
- HOA
- −$0
- Vacancy / Maint / Mgmt
- −$476
- Net cashflow
- $-64
Break-even live
UW: 25.0% down · 7.5% · 30yr · 1.5% tax · 5.0% vac · 8.0% maint · 8.0% mgmt
Financing live
Cash to close
- Down payment
- $74,750
- Closing costs
- $8,970
- Reserves months
- —
- Total cash needed
- —
Loan-product check · same deal, 3 products live
Conventional
25% down · 7.5% · 30yr
- Down + closing
- —
- Monthly P&I
- —
- Monthly cashflow
- —
- DSCR
- —
- Eligible?
- —
Personal DTI + credit; lowest rate.
DSCR
20% down · 8.5% · 30yr
- Down + closing
- —
- Monthly P&I
- —
- Monthly cashflow
- —
- DSCR
- —
- Eligible?
- —
No personal income docs; deal must DSCR.
Hard money
10% down · 12.0% · 12mo
- Down + closing
- —
- Monthly P&I
- —
- Monthly cashflow
- —
- DSCR
- —
- Eligible?
- —
Short-term bridge; refi at stabilization.
Rent comps 4 comps
| Address | Beds | Baths | Sqft | Rent | $/sqft | DOM | Units | Dist |
|---|---|---|---|---|---|---|---|---|
| 1886 15th St North Bend, OR | 4.0 | 2.0 | 1680 | $2,400 | $1.43 | 43d | 1 | 0.40mi |
| 2146 Monroe Ave Unit 2146 North Bend, OR | 3.0 | 1.5 | 1456 | $2,100 | $1.44 | 43d | 1 | 0.91mi |
| 510 Lombard St North Bend, OR | 3.0 | 2.0 | 1384 | $2,200 | $1.59 | 43d | 1 | 0.95mi |
| 455 N Cammann St Coos Bay, OR | 3.0 | 1.0 | 1060 | $2,000 | $1.89 | 43d | 1 | 1.45mi |
Listing history 9 events
-
2026-05-05status Pending 482-char remark
-
2026-04-29$299,000 Active 482-char remark
-
2004-12-03soldstatus $144,000 275-char remark
Show marketing remark (275 chars)
GLEAMING HARDWOOD FLOORS, COUNTRY OAK KITCHEN AND ALL NEW VINYL WINDOWS LEAD YOU TO EXTRA LARGE MASTER WITH IT OWN LUXURY SPA BATH~ITALIAN TILE, JACUZZI TUB, DUAL HEAD SHOWER~IT'S A MUST SEE! 2BD/2BTH WITH UNFINISHED FAMILY ROOM(INCLUDED IN SQ. FT.) FOR MORE POTENTIAL SPACE.
-
2004-12-03soldstatus $144,000
Show marketing remark (275 chars)
GLEAMING HARDWOOD FLOORS, COUNTRY OAK KITCHEN AND ALL NEW VINYL WINDOWS LEAD YOU TO EXTRA LARGE MASTER WITH IT OWN LUXURY SPA BATH~ITALIAN TILE, JACUZZI TUB, DUAL HEAD SHOWER~IT'S A MUST SEE! 2BD/2BTH WITH UNFINISHED FAMILY ROOM(INCLUDED IN SQ. FT.) FOR MORE POTENTIAL SPACE.
-
2004-10-01historical 275-char remark
Show marketing remark (275 chars)
GLEAMING HARDWOOD FLOORS, COUNTRY OAK KITCHEN AND ALL NEW VINYL WINDOWS LEAD YOU TO EXTRA LARGE MASTER WITH IT OWN LUXURY SPA BATH~ITALIAN TILE, JACUZZI TUB, DUAL HEAD SHOWER~IT'S A MUST SEE! 2BD/2BTH WITH UNFINISHED FAMILY ROOM(INCLUDED IN SQ. FT.) FOR MORE POTENTIAL SPACE.
-
2004-09-18$148,000 275-char remark
Show marketing remark (275 chars)
GLEAMING HARDWOOD FLOORS, COUNTRY OAK KITCHEN AND ALL NEW VINYL WINDOWS LEAD YOU TO EXTRA LARGE MASTER WITH IT OWN LUXURY SPA BATH~ITALIAN TILE, JACUZZI TUB, DUAL HEAD SHOWER~IT'S A MUST SEE! 2BD/2BTH WITH UNFINISHED FAMILY ROOM(INCLUDED IN SQ. FT.) FOR MORE POTENTIAL SPACE.
-
1997-12-24soldstatus $72,000
-
1997-12-22soldstatus $72,000
-
1997-10-22$69,900
ⓘ Source: listings_history table (triggers on properties + properties_extension) + one-shot
backfill from property_details.listing_events for pre-trigger history.
Tax reassessment forecast OR · Resets to sale price
- Current annual tax
- $1,920 · $160/mo
- Projected year-2 tax
- $2,900 · $242/mo
- Expected delta
- +$980/yr (+$82/mo · 51.0%)
ⓘ Screening estimate from a state-policy table — verify with the county assessor before closing.
Climate risk First Street
- Flood 1/10 Low FEMA zone X (unshaded) · 0% chance over 30 yrs
- Wildfire 1/10 Low
- Heat 1/10 Low 8 d/yr ≥76°F today · 22 d/yr by 30 yrs out
- Wind 1/10 Low
- Air quality 6/10 Major 9 unhealthy d/yr today · 9 by 30 yrs out
Nearby sold comps map
Loading sold comps map…
Walkable amenities ~0.75 mi
Loading nearby amenities…
Taxation est. · year 1
- Rental income
- $27,173
- − Mortgage interest
- −$16,749
- − Property taxes
- −$1,920
- − Insurance
- −$1,495
- − Repairs & maintenance
- −$2,174
- − Management
- −$2,174
- − Depreciation
- −$8,698
- Taxable loss
- −$6,036
- Est. tax savings @ 24.0%
- +$1,449
- After-tax cash flow
- $685/yr
For passive investors: Depreciation is non-cash, so a rental often shows a tax loss while cash-flowing — sheltering income. Rental losses are passive: they offset passive income freely, and up to $25,000/yr can offset ordinary (W-2) income if you actively participate and your MAGI is under $100k (phasing out to $0 by $150k); unused losses carry forward. On sale, claimed depreciation is recaptured at up to 25%, and gains may owe capital-gains tax (a 1031 exchange can defer both). Figures are a year-1 estimate at your 24.0% rate — not tax advice; consult a CPA.
Schools (NCES district)
- District
- North Bend SD 13
- NCES district ID
- 4108820
- Math proficiency
- 30% ▼ -3.00%
- Reading proficiency
- 47% ▼ -6.00%
- Median HH income
- $43,614
- Composite
- 32.57/100
- National rank
- #5681
- State rank
- #21 of 58 in OR
Livability — North Bend
- Score
- 72/100
- State rank
- #105
- US rank
- #5876
Category grades
Schools grade is shown separately in the Schools card above.
Census & demographics
- Census place
- North Bend, OR
- Population (ZIP)
- 15,328
Population outlook (Coos County) Hauer SSP2
- Today (2025)
- 62,222 people
- By 2030
- 61,120 · -1.8%
- By 2040
- 58,478 · -6.0%
- By 2050
- 56,819 · -8.7%
- By 2075
- 54,915 · -11.7%
- By 2100
- 51,403 · -17.4%
Race, ethnicity, and origin ACS 2023
- Neighborhood character
- Predominantly White (82%)
- Race & ethnicity
- White 82% Two or more races 10% Hispanic / Latino 7% Asian 3% Native American 2%
- Hispanic origin (detail)
- Mexican 4%
- Common ancestry
- Italian 7% Portuguese 4% Lithuanian 3%
- Foreign-born
- 5% · Canada, China, Philippines
- Languages at home
- 94% English-only · Spanish 2% Chinese 1% Other Asian/Pacific 1%
Political lean MEDSL · Coos
- 2024 margin
- R (+19.9) · D 38.7% · R 58.5% · Other 2.8%
- 2008→2024 swing
- -16.8pp toward R · 2008: -3.1pp · 2024: -19.9pp
- All cycles
- 2024: R+19.9 2020: R+20.5 2016: R+24.3 2012: R+6.3 2008: R+3.1
Not yet ingested
- Civics
- —
Market trends
- HPI YoY
- ▲ 14.02%
- Current HPI
- 887.7
- Rent YoY
- —
- Metro
- —
- State GDP YoY
- ▲ 2.05%
- F500 in state
- 2
Industry mix (Fortune 500 HQ in OR)
| Industry | F500 HQs | Revenue |
|---|---|---|
| Consumer Goods | 1 | $51B |
|
||
Price history
+347.1% since first listed11 events — show timeline
- 2026-06-08 Sold (Public Records) $312,500 Public Records
- 2026-06-08 Sold (MLS) $312,500 RMLS
- 2026-05-05 Pending — RMLS
- 2026-04-29 Listed $299,000 RMLS
- 2004-12-03 Sold (Public Records) $144,000 Public Records
- 2004-12-03 Sold (MLS) $144,000 RMLS
- 2004-10-01 Delisted — RMLS
- 2004-09-18 Listed $148,000 RMLS
- 1997-12-24 Sold (MLS) $72,000 RMLS
- 1997-12-22 Sold (Public Records) $72,000 Public Records
- 1997-10-22 Listed $69,900 RMLS
Property tax history
+2.3%/yrLatest (2025): $1,920 · -0.9% YoY. Source: county tax records.
Cash-flow waterfall
monthlySold comps — $/sqft
last 12 mo · ≤1 miLoading sold comps…