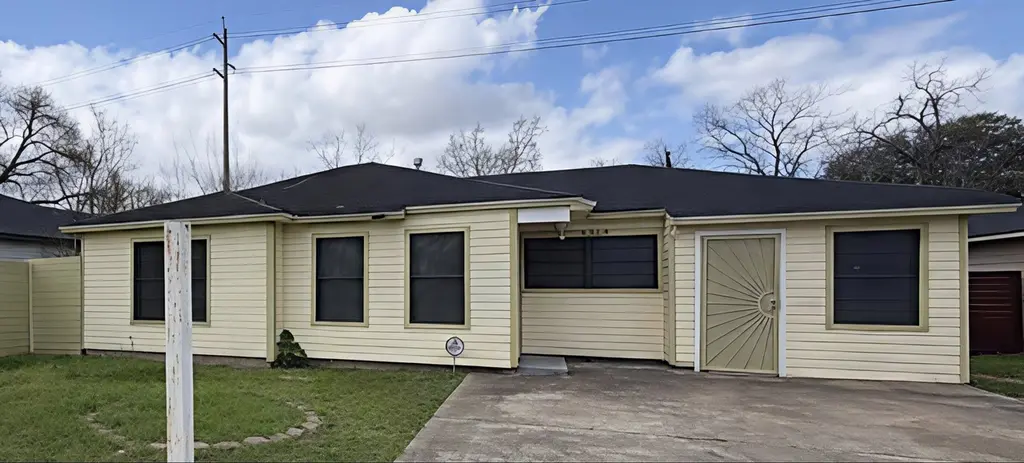
9314 Ashville Dr · Houston, TX
Flood risk 6/10 · Moderate
- FEMA flood zone
- X (unshaded)
- Chance of flooding over 30 yrs
- 0.68%
- Est. flood insurance / yr
- $507 – $1,088
Fire risk 2/10 · Minimal
- Est. fire insurance / yr
- $1,222 – $2,270
Heat risk 9/10 · Severe
- Hot days now (above 109°F)
- 7 days/yr
- Hot days in 30 yrs
- 24 days/yr
Wind risk 9/10 · Severe
- Chance of severe wind over 30 yrs
- 99.0%
Air-quality risk 2/10 · Minimal
- Unhealthy air days now
- 2 days/yr
- Unhealthy air days in 30 yrs
- 2 days/yr
Risk factors via First Street. Map © Google.
Why this score? — see what drove the C- grade
The composite is a weighted blend of 9 inputs, each scored 0–100. Each bar is that input's sub-score; the figure is the points it added to the 100-point composite (weight × sub-score).
- Cash flow +14.5/30.0
- Appreciation +10.0/10.0
- ARV discount +5.8/15.0
- DSCR +4.4/10.0
- 1% rule +3.7/10.0
- Rent growth +3.7/5.0
- Livability +3.7/5.0
- Schools +2.7/10.0
- Condition / age +2.5/5.0
$174,990
🖨 Deal sheet 📄 Offer letter ✓ Due diligence
Listing remarks MLS
Welcome to this updated home in a prime location near the Medical Center, Downtown, and major Houston employment centers. This property boasts a bright open layout with modern finishes, spacious living areas, and a functional design perfect for everyday living and entertaining. The kitchen offers ample cabinetry and prep space, flowing seamlessly into the dining and living areas. The primary bathroom features generous closet space, while the additional bedrooms provide flexibility for guests or a home office. Situated on a nicely sized lot with a private backyard, this home is ideal for outdoor gatherings and future enhancements. Conveniently located near HWs 288, 610, parks, schools, and retail, this move-in ready home offers great value for first-time buyers or investors seeking strong rental potential. **Seller easy terms**
Key facts
- Move-in ready
- Bright open layout
- Ample cabinetry
Tags
Neighborhood map
What this means for you Summary
Snapshot
- This is a 2-bed/1.0-bath single-family listed at $175k.
Deal economics
- At list price, monthly cash flow is $39 ($466/yr) — positive.
- The deal already cash-flows at list — no discount required.
- To meet the 1% rule (rent ≥ 1% of price), the offer needs to be $153k (12.6% below list).
- Recommended offer: $153k (12.6% below list) — sets the bar for 1% rule.
- Cap rate 6.6% vs local median 3.2% in Houston — top-decile yield for the area; either an underpriced asset or a hidden risk that comps aren't pricing in. Stress-test before assuming the spread holds.
Location & tenants
- Location reads 74/100 on livability (#184 in TX, #4,771 nationally) — a middle-class / working-renter tenant base. Strengths: amenities A+, cost of living A+, housing A+; Watch: schools D, crime F.
- Houston ISD (urban): math 27% / reading 35% proficiency, ranked #593 of 826 in TX (top 72%) — families likely to look elsewhere, expect single-tenant / working-renter base with shorter leases; 71% free/reduced lunch — lower-income household profile, screen leases tightly.
- Market conditions: Rents rising fast (+4.8%/yr); 312 active listings in the ZIP; 25 comparable units currently listed for rent nearby; rentals at typical pace (median 18d on market — plan ~3-4 weeks tenant-placement turnaround); lower-income renter base — watch delinquency; 29,883 units permitted in Harris County in 2024 (8,621 in 5+ unit buildings).
- At $1,530/mo this rent would consume 49% of the median local household income ($37k/yr) (locally 1446% of renters already pay >50% of income on rent) — very limited rent-growth headroom before tenants either downsize or default.
Forward outlook
- In year one you build about $19k of equity ($1k loan paydown + $17k appreciation (10.0% local appreciation)).
- Harris County population projected at +47% by 2050 — long-run rental-demand tailwind backs the buy-and-hold thesis.
- At projected returns (10.0% appreciation + 4.8% rent growth), your $49k cash investment doubles in ~3 years — after that, you're playing with house money.
- By year 2, paydown + projected appreciation supports a ~$30k cash-out refi (75% LTV) — recoverable capital for the next deal without selling this one.
Negotiation context
- It's been on market 87 days — a 6% lower offer ($164k) is reasonable based on typical stale-listing flexibility.
Risks & watch-outs
- Climate carrying-cost: major flood risk; severe wind risk, 99% chance of damaging wind over 30y; extreme-heat days projected 7→24/yr by 2055 (HVAC capex compounding) — expect insurance premiums to compound above CPI over the hold.
Questions for the listing agent
- It's been on market 87 days. Have you received any prior offers? Is the seller open to a 13% concession, seller financing, or rate buy-down credit?
- Built in 1960 — when were the roof, HVAC, electrical panel, plumbing, and water heater last replaced?
- Why hasn't it sold? Are there any deal-killer items the seller is aware of (foundation, flood, title, zoning, code violations)?
- Is there a deadline driving the sale (1031 exchange, divorce, estate, relocation)? That informs how much negotiation room exists.
- Schools are D-rated, which usually means shorter tenancies and higher turnover. Who's the typical renter profile here, and what's been the actual vacancy rate?
- Crime grade is F in this area — have there been break-ins, vandalism, or insurance claims at this property in the last 3 years? What carrier currently insures it and at what premium?
- What's the average days-on-market for RENTAL listings here right now (not sales)? A rising rental-DOM trend means longer vacancies and softer asking-rent achievability than the comps imply.
- What's the recent tenant-quality profile in this submarket — average credit score on applications, eviction rate, late-payment / NSF rate, and stable-employment percentage? A property-management company in the area should have these aggregated.
- How much new for-sale + rental construction is in the pipeline within 1–3 miles? Heavy new supply typically softens prices + rents 12–24 months out; constrained supply supports both.
Investment metrics
- 1% rule
- 0.87% ✗
- Cap rate
- 6.56%
- Cash-on-cash
- 0.95%
- DSCR
- 1.04
- GRM
- 9.5
CMA / ARV
- ARV (median comp)
- $168,496
- List price
- $174,990
- Delta
- 3.85%
- Verdict
- FAIR
- Comps
- 20 within 1.0 mi
Show comp detail 12 sales within ~0.75 mi
| Address | Dist | Beds/Ba | Sqft | Sold | Price | $/sf | Match |
|---|---|---|---|---|---|---|---|
| 9321 Cathedral Dr | 0.19mi | 3/1.0 (+1) | 1,204 (+1%) | 4mo | $159,000 | $132 | 81 |
| 9501 Chesterfield Dr | 0.15mi | 3/1.0 (+1) | 1,152 (-3%) | 8mo | $112,000 | $97 | 76 |
| 9329 Chesterfield Dr | 0.04mi | 3/1.0 (+1) | 1,128 (-5%) | 11mo | $150,000 | $133 | 75 |
| 10006 Chesterfield Dr | 0.43mi | 3/1.0 (+1) | 1,170 (-2%) | 3mo | $125,000 | $107 | 70 |
| 9333 Fairland Dr | 0.09mi | 3/1.0 (+1) | 1,080 (-9%) | 8mo | $170,000 | $157 | 69 |
| 10205 Sierra Dr | 0.54mi | 3/1.0 (+1) | 1,151 (-3%) | 3mo | $120,000 | $104 | 62 |
| 10010 Fairland Dr | 0.44mi | 3/1.0 (+1) | 1,148 (-3%) | 10mo | $72,000 | $63 | 61 |
| 10209 Cathedral Dr | 0.56mi | 3/1.5 (+1) | 1,244 (+5%) | 3mo | $180,000 | $145 | 57 |
| 3034 Corksie St | 0.64mi | 3/2.0 (+1) | 1,225 (+3%) | 0mo | $219,900 | $180 | 56 |
| 3030 Corksie St | 0.65mi | 3/1.5 (+1) | 1,214 (+2%) | 7mo | $149,250 | $123 | 53 |
| 3138 Sunbeam St | 0.49mi | 3/1.0 (+1) | 1,091 (-8%) | 7mo | $109,900 | $101 | 53 |
| 4210 Larkspur St | 0.55mi | 3/2.0 (+1) | 1,281 (+8%) | 5mo | $199,000 | $155 | 48 |
Match score weights: distance 35% · size 25% · config 20% · recency 20%. Top-matched comps best support the ARV.
Projected returns pro-forma
10.0% appreciation · 4.77% rent growth · sell at horizon
- IRR
- 25.6%
- Equity multiple
- 3.05×
- Total profit
- $100,549
- Equity at exit
- $157,645
- IRR
- 22.9%
- Equity multiple
- 7.13×
- Total profit
- $300,201
- Equity at exit
- $339,967
Cash invested: $48,997 (down + closing). Projections, not guarantees.
Landlord ↔ Tenant lean methodology
- Overall (STATE)
- 87 Strongly Landlord-Friendly
- State Texas
- 87 Strongly Landlord-Friendly · R+5
- County
- — inherits STATE
- City
- — inherits STATE
ZIP-level market 77051
- Home prices YoY
- 9.7%
- Rents YoY
- 4.8%
- Active inventory
- 312
- Price-to-rent
- 9.5×
Monthly cashflow live
- Estimated rent
- $1,530 high interval (Pro) →
- Mortgage (P&I)
- −$918
- Tax from tax record
- −$179 /mo · $2,153/yr
- Insurance
- −$73
- HOA
- −$0
- Vacancy / Maint / Mgmt
- −$321
- Net cashflow
- $39
Break-even live
UW: 25.0% down · 7.5% · 30yr · 1.5% tax · 5.0% vac · 8.0% maint · 8.0% mgmt
Financing live
Cash to close
- Down payment
- $43,748
- Closing costs
- $5,250
- Reserves months
- —
- Total cash needed
- —
Loan-product check · same deal, 3 products live
Conventional
25% down · 7.5% · 30yr
- Down + closing
- —
- Monthly P&I
- —
- Monthly cashflow
- —
- DSCR
- —
- Eligible?
- —
Personal DTI + credit; lowest rate.
DSCR
20% down · 8.5% · 30yr
- Down + closing
- —
- Monthly P&I
- —
- Monthly cashflow
- —
- DSCR
- —
- Eligible?
- —
No personal income docs; deal must DSCR.
Hard money
10% down · 12.0% · 12mo
- Down + closing
- —
- Monthly P&I
- —
- Monthly cashflow
- —
- DSCR
- —
- Eligible?
- —
Short-term bridge; refi at stabilization.
Rent comps 25 comps
| Address | Beds | Baths | Sqft | Rent | $/sqft | DOM | Units | Dist |
|---|---|---|---|---|---|---|---|---|
| 9414 Heno St Unit 13 Houston, TX | 2.0 | 1.0 | 824 | $900 | $1.09 | 24d | 1 | 0.25mi |
| 4112 Grassmere St Houston, TX | 2.0 | 1.0 | 711 | $700 | $0.98 | 11d | 1 | 0.36mi |
| 4205 Grassmere St Houston, TX | 2.0 | 1.0 | 824 | $900 | $1.09 | 24d | 1 | 0.40mi |
| 4205 Phlox St Unit 2 BEDROOM 6 Houston, TX | 2.0 | 1.0 | 736 | $860 | $1.17 | 18d | 1 | 0.47mi |
| 4207 Phlox St Houston, TX | 2.0 | 1.0 | 736 | $962 | $1.31 | 2d | 1 | 0.49mi |
| 4326 Larkspur St Unit 3 Houston, TX | 2.0 | 1.0 | 800 | $1,200 | $1.50 | 17d | 1 | 0.62mi |
| 2910 Reed Rd Houston, TX | 1.0–3.0 | 1.0–2.0 | 967 | $1,088 | $1.12 | 2d | 5 | 0.62mi |
| 2889 Reed Rd Houston, TX | 1.0–2.0 | 1.0–2.0 | 997 | $1,648 | $1.65 | 3d | 2 | 0.67mi |
| 10510 Cathedral Dr Houston, TX | 3.0 | 1.0 | 887 | $1,300 | $1.47 | 44d | 1 | 0.75mi |
| 2725 Reed Rd Houston, TX | 1.0–3.0 | 1.0–2.5 | 911 | $862 | $0.95 | 44d | 1 | 0.82mi |
| 3137 W Bellfort Ave Houston, TX | 2.0 | 2.0 | 1164 | $1,802 | $1.55 | 44d | 1 | 1.00mi |
| 4526 Knoxville St Unit A Houston, TX | 3.0 | 2.5 | 1474 | $1,775 | $1.20 | 15d | 1 | 1.00mi |
| 8328 Corinth St Unit B Houston, TX | 3.0 | 2.5 | 1500 | $2,800 | $1.87 | 20d | 1 | 1.03mi |
| 4410 Bellfort Ave Unit 4404 8 Houston, TX | 2.0 | 1.0 | 812 | $999 | $1.23 | 8d | 1 | 1.11mi |
| 4723 Mallow St Houston, TX | 3.0 | 2.5 | 1472 | $1,850 | $1.26 | 5d | 1 | 1.12mi |
| 4810 Wilmington St Unit A Houston, TX | 3.0 | 2.0 | 1165 | $1,650 | $1.42 | 44d | 1 | 1.20mi |
| 8521 Dosia St Houston, TX | 3.0 | 2.0 | 1028 | $1,665 | $1.62 | 13d | 1 | 1.20mi |
| 8010 Livingston St Houston, TX | 3.0 | 2.0 | 1400 | $1,800 | $1.29 | 44d | 1 | 1.32mi |
| 4918 Wilmington St Unit A Houston, TX | 3.0 | 3.0 | 1300 | $2,100 | $1.62 | 44d | 1 | 1.33mi |
| 4322 Groton Dr Houston, TX | 3.0 | 1.0 | 858 | $1,395 | $1.63 | 44d | 1 | 1.39mi |
| 7823 Gladstone St Houston, TX | 2.0 | 2.0 | 850 | $1,600 | $1.88 | 44d | 1 | 1.48mi |
| 4609 Bricker St Unit ABC Houston, TX | 3.0 | 2.5 | 1375 | $3,500 | $2.55 | 11d | 1 | 1.48mi |
| 4609 Bricker St Unit C Houston, TX | 2.0 | 1.5 | 1100 | $3,200 | $2.91 | 13d | 1 | 1.48mi |
| 4609 Bricker St Unit B Houston, TX | 3.0 | 2.5 | 1300 | $3,500 | $2.69 | 13d | 1 | 1.48mi |
| 8107 Calhoun Rd Houston, TX | 3.0 | 2.5 | 1304 | $2,250 | $1.73 | 24d | 1 | 1.49mi |
Listing history 16 events
-
2026-06-18days on market $174,990 Active 87 DOM
-
2026-06-17days on market $174,990 Active 86 DOM
-
2026-06-16days on market $174,990 Active 85 DOM
-
2026-06-15days on market $174,990 Active 84 DOM
-
2026-06-13days on market $174,990 Active 82 DOM
-
2026-06-10days on market $174,990 Active 78 DOM
-
2026-06-08days on market $174,990 Active 77 DOM
-
2026-06-07days on market $174,990 Active 76 DOM
-
2026-06-04days on market $174,990 Active 73 DOM
-
2026-06-01days on market $174,990 Active 70 DOM
-
2026-05-31days on market $174,990 Active 69 DOM
-
2026-04-06price $174,990 838-char remark
Show marketing remark (838 chars)
Welcome to this updated home in a prime location near the Medical Center, Downtown, and major Houston employment centers. This property boasts a bright open layout with modern finishes, spacious living areas, and a functional design perfect for everyday living and entertaining. The kitchen offers ample cabinetry and prep space, flowing seamlessly into the dining and living areas. The primary bathroom features generous closet space, while the additional bedrooms provide flexibility for guests or a home office. Situated on a nicely sized lot with a private backyard, this home is ideal for outdoor gatherings and future enhancements. Conveniently located near HWs 288, 610, parks, schools, and retail, this move-in ready home offers great value for first-time buyers or investors seeking strong rental potential. **Seller easy terms**
-
2026-03-31price $179,900 838-char remark
Show marketing remark (838 chars)
Welcome to this updated home in a prime location near the Medical Center, Downtown, and major Houston employment centers. This property boasts a bright open layout with modern finishes, spacious living areas, and a functional design perfect for everyday living and entertaining. The kitchen offers ample cabinetry and prep space, flowing seamlessly into the dining and living areas. The primary bathroom features generous closet space, while the additional bedrooms provide flexibility for guests or a home office. Situated on a nicely sized lot with a private backyard, this home is ideal for outdoor gatherings and future enhancements. Conveniently located near HWs 288, 610, parks, schools, and retail, this move-in ready home offers great value for first-time buyers or investors seeking strong rental potential. **Seller easy terms**
-
2026-03-31price $172,900 838-char remark
Show marketing remark (838 chars)
Welcome to this updated home in a prime location near the Medical Center, Downtown, and major Houston employment centers. This property boasts a bright open layout with modern finishes, spacious living areas, and a functional design perfect for everyday living and entertaining. The kitchen offers ample cabinetry and prep space, flowing seamlessly into the dining and living areas. The primary bathroom features generous closet space, while the additional bedrooms provide flexibility for guests or a home office. Situated on a nicely sized lot with a private backyard, this home is ideal for outdoor gatherings and future enhancements. Conveniently located near HWs 288, 610, parks, schools, and retail, this move-in ready home offers great value for first-time buyers or investors seeking strong rental potential. **Seller easy terms**
-
2026-03-18$179,900 Active 838-char remark
Show marketing remark (838 chars)
Welcome to this updated home in a prime location near the Medical Center, Downtown, and major Houston employment centers. This property boasts a bright open layout with modern finishes, spacious living areas, and a functional design perfect for everyday living and entertaining. The kitchen offers ample cabinetry and prep space, flowing seamlessly into the dining and living areas. The primary bathroom features generous closet space, while the additional bedrooms provide flexibility for guests or a home office. Situated on a nicely sized lot with a private backyard, this home is ideal for outdoor gatherings and future enhancements. Conveniently located near HWs 288, 610, parks, schools, and retail, this move-in ready home offers great value for first-time buyers or investors seeking strong rental potential. **Seller easy terms**
-
1988-01-02soldstatus
ⓘ Source: listings_history table (triggers on properties + properties_extension) + one-shot
backfill from property_details.listing_events for pre-trigger history.
Tax reassessment forecast TX · Resets to sale price
- Current annual tax
- $2,153 · $179/mo
- Projected year-2 tax
- $3,202 · $267/mo
- Expected delta
- +$1,050/yr (+$87/mo · 48.8%)
ⓘ Screening estimate from a state-policy table — verify with the county assessor before closing.
Climate risk First Street
- Flood 6/10 Major FEMA zone X (unshaded) · 68% chance over 30 yrs
- Wildfire 2/10 Low
- Heat 9/10 Extreme 7 d/yr ≥109°F today · 24 d/yr by 30 yrs out
- Wind 9/10 Extreme 99% chance of damaging wind over 30 yrs
- Air quality 2/10 Low 2 unhealthy d/yr today · 2 by 30 yrs out
Nearby sold comps map
Loading sold comps map…
Walkable amenities ~0.75 mi
Loading nearby amenities…
Taxation est. · year 1
- Rental income
- $18,361
- − Mortgage interest
- −$9,802
- − Property taxes
- −$2,153
- − Insurance
- −$875
- − Repairs & maintenance
- −$1,469
- − Management
- −$1,469
- − Depreciation
- −$5,091
- Taxable loss
- −$2,497
- Est. tax savings @ 24.0%
- +$599
- After-tax cash flow
- $1,065/yr
For passive investors: Depreciation is non-cash, so a rental often shows a tax loss while cash-flowing — sheltering income. Rental losses are passive: they offset passive income freely, and up to $25,000/yr can offset ordinary (W-2) income if you actively participate and your MAGI is under $100k (phasing out to $0 by $150k); unused losses carry forward. On sale, claimed depreciation is recaptured at up to 25%, and gains may owe capital-gains tax (a 1031 exchange can defer both). Figures are a year-1 estimate at your 24.0% rate — not tax advice; consult a CPA.
Schools (NCES district)
- District
- Houston ISD
- NCES district ID
- 4823640
- Math proficiency
- 27% ▼ -18.00%
- Reading proficiency
- 35% ▼ -6.00%
- Median HH income
- $46,054
- Composite
- 26.63/100
- National rank
- #7173
- State rank
- #593 of 826 in TX
Livability — Houston
- Score
- 74/100
- State rank
- #184
- US rank
- #4771
Category grades
Schools grade is shown separately in the Schools card above.
Census & demographics
- Census place
- Houston, TX
- County
- Harris County · 4,702,590 people
- City population
- 3,226,434
- Metro
- Houston-The Woodlands-Sugar Land, TX
- Population (ZIP)
- 19,795
- Household income
- $37,415
- Rent vs Own
- Severe rent burden
- 1446.0
Population outlook (Harris County) Hauer SSP2
- Today (2025)
- 5,571,493 people
- By 2030
- 6,089,821 · +9.3%
- By 2040
- 7,142,806 · +28.2%
- By 2050
- 8,185,864 · +46.9%
- By 2075
- 10,574,329 · +89.8%
- By 2100
- 12,109,958 · +117.4%
Race, ethnicity, and origin ACS 2023
- Neighborhood character
- Predominantly Black (77%)
- Race & ethnicity
- Black 77% Hispanic / Latino 16% Two or more races 11% White 3%
- Hispanic origin (detail)
- Mexican 6% Puerto Rican 1%
- Foreign-born
- 8% · Canada, China
- Languages at home
- 88% English-only · Spanish 10%
Political lean MEDSL · Harris
- 2024 margin
- Lean D (+5.5) · D 52.0% · R 46.4% · Other 1.6%
- 2008→2024 swing
- +3.9pp toward D · 2008: 1.6pp · 2024: 5.5pp
- All cycles
- 2024: D+5.5 2020: D+13.3 2016: D+12.4 2012: D+0.1 2008: D+1.6
Not yet ingested
- Civics
- —
Market trends
- HPI YoY
- ▲ 16.02%
- Current HPI
- 180.4283
- Rent YoY
- ▲ 4.77%
- Metro
- Houston-The Woodlands-Sugar Land, TX
- State GDP YoY
- ▲ 3.95%
- F500 in state
- 110
Industry mix (Fortune 500 HQ in TX)
| Industry | F500 HQs | Revenue |
|---|---|---|
| Energy | 16 | $1,198B |
|
||
| Technology | 5 | $198B |
|
||
| Engineering / Construction | 4 | $72B |
|
||
| Energy Services | 3 | $60B |
|
||
| Utilities | 3 | $41B |
|
||
| Healthcare | 2 | $330B |
|
||
Price history
-2.7% since first listed5 events — show timeline
- 2026-04-06 Price Changed $174,990 HARMLS
- 2026-03-31 Price Changed $179,900 HARMLS
- 2026-03-31 Price Changed $172,900 HARMLS
- 2026-03-18 Listed $179,900 HARMLS
- 1988-01-02 Sold (Public Records) — Public Records
Property tax history
+4.5%/yrLatest (2025): $2,153 · +11.7% YoY. Source: county tax records.
Cash-flow waterfall
monthlySold comps — $/sqft
last 12 mo · ≤1 miLoading sold comps…