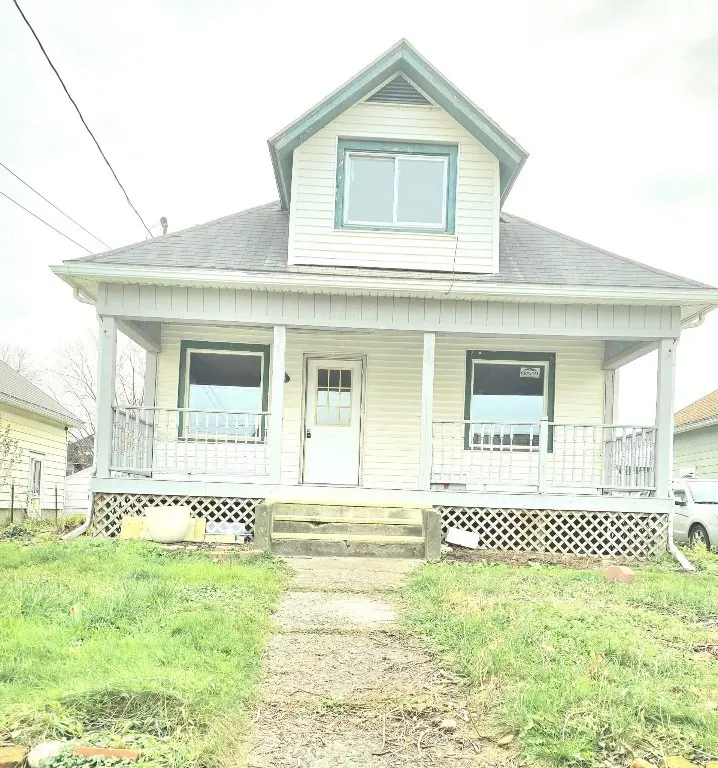
330 Floral Ave · Johnson City, NY
Flood risk 1/10 · Minimal
- FEMA flood zone
- X
- Chance of flooding over 30 yrs
- 0.0%
- Est. flood insurance / yr
- $473 – $860
Fire risk 3/10 · Minor
- Est. fire insurance / yr
- $691 – $1,283
Heat risk 3/10 · Minor
- Hot days now (above 92°F)
- 7 days/yr
- Hot days in 30 yrs
- 16 days/yr
Wind risk 2/10 · Minimal
- Chance of severe wind over 30 yrs
- 1.0%
Air-quality risk 2/10 · Minimal
- Unhealthy air days now
- 0 days/yr
- Unhealthy air days in 30 yrs
- 1 days/yr
Risk factors via First Street. Map © Google.
Why this score? — see what drove the C grade
The composite is a weighted blend of 9 inputs, each scored 0–100. Each bar is that input's sub-score; the figure is the points it added to the 100-point composite (weight × sub-score).
- Cash flow +18.1/30.0
- Appreciation +10.0/10.0
- 1% rule +6.5/10.0
- DSCR +5.7/10.0
- Rent growth +4.9/5.0
- Livability +3.8/5.0
- Schools +3.3/10.0
- ARV discount +2.8/15.0
- Condition / age +2.5/5.0
$160,000
🖨 Deal sheet 📄 Offer letter ✓ Due diligence
Listing remarks MLS
?? PRICE DROPPED TO SELL! Spacious 4-Bedroom Home Near BU & UHS Wilson! Large 4 bedroom home, new vinyl flooring, new SS appliances. Conveniently located near highways, Binghamton University, BU Pharmacy, BU bus line, UHS Wilson and Floral Park.
Key facts
- New ss appliances
- Near bu pharmacy
- Near uhs wilson
Tags
Neighborhood map
What this means for you Summary
Snapshot
- This is a 4-bed/2.0-bath single-family listed at $160k.
Deal economics
- At list price, monthly cash flow is $140 ($2k/yr) — positive.
- The deal already cash-flows at list — no discount required.
- Meets the 1% rule at list price ($2k rent vs $160k).
- Recommended offer: $141k (12.0% below list) — sets the bar for market timing.
Location & tenants
- Location reads 76/100 on livability (#238 in NY, #3,739 nationally) — a middle-class / working-renter tenant base. Strengths: cost of living A+, housing A+, health & safety A+; Watch: crime F, employment D-.
- Johnson City Central School District (suburban): math 38% / reading 41% proficiency, ranked #535 of 590 in NY (top 91%) — families likely to look elsewhere, expect single-tenant / working-renter base with shorter leases.
- Market conditions: Rents rising fast (+9.5%/yr); 99 active listings in the ZIP; 15 comparable units currently listed for rent nearby; rentals at typical pace (median 21d on market — plan ~3-4 weeks tenant-placement turnaround); 47% of comp listings sitting > 30 days — soft ceiling on asking rent; 340 units permitted in Broome County in 2024 (269 in 5+ unit buildings).
- This rent runs 37% of the median local income ($59k/yr) — at the standard rent-burdened threshold; future hikes will face affordability resistance.
Forward outlook
- In year one you build about $17k of equity ($1k loan paydown + $16k appreciation (10.0% local appreciation)).
- Broome County population projected at -13% by 2050 — secular population decline; favor cash flow + early exit over multi-decade hold.
- At projected returns (10.0% appreciation + 8.0% rent growth), your $45k cash investment doubles in ~3 years — after that, you're playing with house money.
- By year 3, paydown + projected appreciation supports a ~$43k cash-out refi (75% LTV) — recoverable capital for the next deal without selling this one.
Negotiation context
- It's been on market 211 days — a 12% lower offer ($141k) is reasonable based on typical stale-listing flexibility.
- 4 sale attempts since 2y ago with the ask held roughly flat each time — persistent listings suggest the price (not the market) is what's stuck; bring a comps-based counter.
- Current owner paid $72k; list at $160k implies a 124% gain — meaningful room to come down on a strong offer.
Risks & watch-outs
- Watch-outs: property tax is 3.1% of price; built in 1930 — expect roof / HVAC / electrical / plumbing capex.
Questions for the listing agent
- It's been on market 211 days. Have you received any prior offers? Is the seller open to a 12% concession, seller financing, or rate buy-down credit?
- Built in 1930 — when were the roof, HVAC, electrical panel, plumbing, and water heater last replaced?
- Property tax is high relative to price — has the assessment been appealed recently, and will the sale trigger a re-assessment?
- Why hasn't it sold? Are there any deal-killer items the seller is aware of (foundation, flood, title, zoning, code violations)?
- Is there a deadline driving the sale (1031 exchange, divorce, estate, relocation)? That informs how much negotiation room exists.
- Crime grade is F in this area — have there been break-ins, vandalism, or insurance claims at this property in the last 3 years? What carrier currently insures it and at what premium?
- What's the average days-on-market for RENTAL listings here right now (not sales)? A rising rental-DOM trend means longer vacancies and softer asking-rent achievability than the comps imply.
- What's the recent tenant-quality profile in this submarket — average credit score on applications, eviction rate, late-payment / NSF rate, and stable-employment percentage? A property-management company in the area should have these aggregated.
- How much new for-sale + rental construction is in the pipeline within 1–3 miles? Heavy new supply typically softens prices + rents 12–24 months out; constrained supply supports both.
Investment metrics
- 1% rule
- 1.15% ✓
- Cap rate
- 7.34%
- Cash-on-cash
- 3.75%
- DSCR
- 1.17
- GRM
- 7.2
CMA / ARV
- ARV (median comp)
- $144,789
- List price
- $160,000
- Delta
- 10.51%
- Verdict
- OVERPRICED
- Comps
- 20 within 1.0 mi
Show comp detail 12 sales within ~0.75 mi
| Address | Dist | Beds/Ba | Sqft | Sold | Price | $/sf | Match |
|---|---|---|---|---|---|---|---|
| 446 Grand Ave | 0.32mi | 3/2.0 (-1) | 1,364 (-1%) | 1mo | $100,000 | $73 | 77 |
| 73 Elizabeth St | 0.10mi | 3/2.5 (-1) | 1,480 (+7%) | 2mo | $190,000 | $128 | 75 |
| 129 Ackley Ave | 0.29mi | 4/1.5 | 1,460 (+6%) | 4mo | $160,000 | $110 | 71 |
| 43 Haynes Ave | 0.43mi | 4/1.5 | 1,360 (-1%) | 5mo | $155,000 | $114 | 71 |
| 41 Elizabeth St | 0.15mi | 3/1.0 (-1) | 1,312 (-5%) | 6mo | $126,000 | $96 | 71 |
| 234 Saint Charles St | 0.14mi | 4/1.0 | 1,512 (+10%) | 7mo | $112,000 | $74 | 68 |
| 3 Banks Ave Ave | 0.21mi | 3/1.5 (-1) | 1,248 (-10%) | 0mo | $190,000 | $152 | 67 |
| 95 Thomas St | 0.33mi | 3/2.0 (-1) | 1,488 (+8%) | 2mo | $131,978 | $89 | 65 |
| 12 Eldridge Ave | 0.25mi | 3/1.5 (-1) | 1,518 (+10%) | 4mo | $132,000 | $87 | 62 |
| 32 Haynes Ave | 0.41mi | 3/1.0 (-1) | 1,518 (+10%) | 5mo | $95,000 | $63 | 51 |
| 119 Lincoln Ave | 0.63mi | 3/1.0 (-1) | 1,248 (-10%) | 5mo | $120,000 | $96 | 42 |
| 9 Endwell St | 0.72mi | 3/1.5 (-1) | 1,200 (-13%) | 6mo | $145,000 | $121 | 32 |
Match score weights: distance 35% · size 25% · config 20% · recency 20%. Top-matched comps best support the ARV.
Projected returns pro-forma
10.0% appreciation · 8.0% rent growth · sell at horizon
- IRR
- 29.3%
- Equity multiple
- 3.37×
- Total profit
- $105,953
- Equity at exit
- $144,141
- IRR
- 27.2%
- Equity multiple
- 8.35×
- Total profit
- $329,436
- Equity at exit
- $310,845
Cash invested: $44,800 (down + closing). Projections, not guarantees.
Landlord ↔ Tenant lean methodology
- Overall (STATE)
- 15 Strongly Tenant-Friendly
- State New York
- 15 Strongly Tenant-Friendly · D+10
- County
- — inherits STATE
- City
- — inherits STATE
ZIP-level market 13790
- Home prices YoY
- 6.8%
- Rents YoY
- 9.5%
- Active inventory
- 99
- Price-to-rent
- 7.2×
Monthly cashflow live
- Estimated rent
- $1,843 high interval (Pro) →
- Mortgage (P&I)
- −$839
- Tax from tax record
- −$410 /mo · $4,918/yr
- Insurance
- −$67
- HOA
- −$0
- Vacancy / Maint / Mgmt
- −$387
- Net cashflow
- $140
Break-even live
UW: 25.0% down · 7.5% · 30yr · 1.5% tax · 5.0% vac · 8.0% maint · 8.0% mgmt
Financing live
Cash to close
- Down payment
- $40,000
- Closing costs
- $4,800
- Reserves months
- —
- Total cash needed
- —
Loan-product check · same deal, 3 products live
Conventional
25% down · 7.5% · 30yr
- Down + closing
- —
- Monthly P&I
- —
- Monthly cashflow
- —
- DSCR
- —
- Eligible?
- —
Personal DTI + credit; lowest rate.
DSCR
20% down · 8.5% · 30yr
- Down + closing
- —
- Monthly P&I
- —
- Monthly cashflow
- —
- DSCR
- —
- Eligible?
- —
No personal income docs; deal must DSCR.
Hard money
10% down · 12.0% · 12mo
- Down + closing
- —
- Monthly P&I
- —
- Monthly cashflow
- —
- DSCR
- —
- Eligible?
- —
Short-term bridge; refi at stabilization.
Rent comps 15 comps
| Address | Beds | Baths | Sqft | Rent | $/sqft | DOM | Units | Dist |
|---|---|---|---|---|---|---|---|---|
| 400 Riverside Dr Unit 15 Johnson City, NY | 3.0 | 1.0 | 1000 | $2,425 | $2.42 | 13d | 1 | 0.44mi |
| 400 Riverside Dr Unit 212 Johnson City, NY | 3.0 | 1.0 | 1100 | $2,500 | $2.27 | 13d | 1 | 0.44mi |
| 145 Floral Ave Unit 4 Johnson City, NY | 3.0 | 1.0 | 1095 | $1,250 | $1.14 | 21d | 1 | 0.47mi |
| 50 Crocker Ave Johnson City, NY | 4.0 | 2.0 | 1411 | $2,000 | $1.42 | 21d | 1 | 0.47mi |
| 51 Allen St Unit 1 Johnson City, NY | 3.0 | 1.0 | 1170 | $1,575 | $1.35 | 21d | 1 | 0.49mi |
| 10 Bidwell St Johnson City, NY | 3.0 | 2.0 | 1200 | $1,850 | $1.54 | 43d | 1 | 1.02mi |
| 133 Crestmont Rd Unit 2 Binghamton, NY | 3.0 | 1.0 | 1300 | $1,900 | $1.46 | 43d | 1 | 1.12mi |
| 296 Main St Unit 6 Binghamton, NY | 3.0 | 1.0 | 1200 | $1,250 | $1.04 | 13d | 1 | 1.15mi |
| 129 Helen St Unit 1 Binghamton, NY | 4.0 | 2.0 | 1850 | $2,200 | $1.19 | 43d | 1 | 1.16mi |
| 99 Helen St Unit 2 Binghamton, NY | 3.0 | 1.0 | 1220 | $1,600 | $1.31 | 43d | 1 | 1.22mi |
| 3613 Vestal Rd Vestal, NY | 3.0 | 2.0 | 1590 | $2,000 | $1.26 | 13d | 1 | 1.27mi |
| 4 Baxter St Unit Left Binghamton, NY | 4.0 | 2.5 | 1800 | $1,500 | $0.83 | 13d | 1 | 1.31mi |
| 16 Highland Ave Unit 1 Binghamton, NY | 3.0 | 1.0 | 1400 | $1,650 | $1.18 | 43d | 1 | 1.41mi |
| 36 Haendel St Unit 1 Binghamton, NY | 3.0 | 1.0 | 1600 | $1,650 | $1.03 | 43d | 1 | 1.47mi |
| 36 Haendel St Unit Second Floor Binghamton, NY | 3.0 | 1.0 | 1200 | $1,450 | $1.21 | 43d | 1 | 1.47mi |
Listing history 17 events
-
2026-06-10days on market $160,000 Active 211 DOM
-
2026-06-09days on market $160,000 Active 210 DOM
-
2026-06-08days on market $160,000 Active 209 DOM
-
2026-06-07days on market $160,000 Active 208 DOM
-
2026-06-05days on market $160,000 Active 205 DOM
-
2026-06-03days on market $160,000 Active 204 DOM
-
2026-06-02days on market $160,000 Active 203 DOM
-
2026-06-01days on market $160,000 Active 202 DOM
-
2026-05-31days on market $160,000 Active 201 DOM
-
2026-05-30days on market $160,000 Active 200 DOM
-
2025-11-11$160,000 Active 251-char remark
Show marketing remark (251 chars)
?? PRICE DROPPED TO SELL! Spacious 4-Bedroom Home Near BU & UHS Wilson! Large 4 bedroom home, new vinyl flooring, new SS appliances. Conveniently located near highways, Binghamton University, BU Pharmacy, BU bus line, UHS Wilson and Floral Park.
-
2025-09-16price $157,000
-
2025-06-29$159,000 Active
-
2024-11-15$159,000 Active
-
2024-06-12soldstatus $71,500 Closed
-
2024-04-06status Pending
-
2024-04-02$59,900 Active
ⓘ Source: listings_history table (triggers on properties + properties_extension) + one-shot
backfill from property_details.listing_events for pre-trigger history.
Tax reassessment forecast NY · Partial reset (capped growth)
- Current annual tax
- $4,918 · $410/mo
- Projected year-2 tax
- $4,918 · $410/mo
- Expected delta
- $0/yr ($0/mo · 0.0%)
ⓘ Screening estimate from a state-policy table — verify with the county assessor before closing.
Climate risk First Street
- Flood 1/10 Low FEMA zone X · 0% chance over 30 yrs
- Wildfire 3/10 Moderate
- Heat 3/10 Moderate 7 d/yr ≥92°F today · 16 d/yr by 30 yrs out
- Wind 2/10 Low 100% chance of damaging wind over 30 yrs
- Air quality 2/10 Low 0 unhealthy d/yr today · 1 by 30 yrs out
Nearby sold comps map
Loading sold comps map…
Walkable amenities ~0.75 mi
Loading nearby amenities…
Taxation est. · year 1
- Rental income
- $22,110
- − Mortgage interest
- −$8,962
- − Property taxes
- −$4,918
- − Insurance
- −$800
- − Repairs & maintenance
- −$1,769
- − Management
- −$1,769
- − Depreciation
- −$4,655
- Taxable loss
- −$762
- Est. tax savings @ 24.0%
- +$183
- After-tax cash flow
- $1,863/yr
For passive investors: Depreciation is non-cash, so a rental often shows a tax loss while cash-flowing — sheltering income. Rental losses are passive: they offset passive income freely, and up to $25,000/yr can offset ordinary (W-2) income if you actively participate and your MAGI is under $100k (phasing out to $0 by $150k); unused losses carry forward. On sale, claimed depreciation is recaptured at up to 25%, and gains may owe capital-gains tax (a 1031 exchange can defer both). Figures are a year-1 estimate at your 24.0% rate — not tax advice; consult a CPA.
Schools (NCES district)
- District
- Johnson City Central School District
- NCES district ID
- 3615900
- Math proficiency
- 38% ▼ -8.00%
- Reading proficiency
- 41% ▲ 2.00%
- Median HH income
- $40,514
- Composite
- 33.17/100
- National rank
- #5545
- State rank
- #535 of 590 in NY
Livability — Johnson City
- Score
- 76/100
- State rank
- #238
- US rank
- #3739
Category grades
Schools grade is shown separately in the Schools card above.
Census & demographics
- Census place
- Johnson City, NY
- County
- Broome County · 126,805 people
- City population
- 18,739
- Metro
- Binghamton, NY
- Population (ZIP)
- 18,739
- Household income
- $59,045
- Rent vs Own
- Severe rent burden
- 1233.0
Population outlook (Broome County) Hauer SSP2
- Today (2025)
- 187,989 people
- By 2030
- 183,066 · -2.6%
- By 2040
- 172,228 · -8.4%
- By 2050
- 163,161 · -13.2%
- By 2075
- 153,641 · -18.3%
- By 2100
- 140,851 · -25.1%
Race, ethnicity, and origin ACS 2023
- Neighborhood character
- Predominantly White (75%)
- Race & ethnicity
- White 75% Two or more races 9% Asian 8% Black 6% Hispanic / Latino 4%
- Common ancestry
- Romanian 6% Lithuanian 3% Scotch-Irish 2%
- Foreign-born
- 9% · Canada, China, Vietnam
- Languages at home
- 88% English-only · Other Indo-European 4% French/Haitian/Cajun 2% Spanish 2%
Political lean MEDSL · Broome
- 2024 margin
- Toss-up / Even · D 50.2% · R 49.8%
- 2008→2024 swing
- -7.6pp toward R · 2008: 8.0pp · 2024: 0.4pp
- All cycles
- 2024: D+0.4 2020: D+3.5 2016: R+3.7 2012: D+4.6 2008: D+8.0
Not yet ingested
- Civics
- —
Market trends
- HPI YoY
- ▲ 18.06%
- Current HPI
- 285.3668
- Rent YoY
- ▲ 9.47%
- Metro
- Binghamton, NY
- State GDP YoY
- ▲ 2.60%
- F500 in state
- 92
Industry mix (Fortune 500 HQ in NY)
| Industry | F500 HQs | Revenue |
|---|---|---|
| Financial Services | 10 | $950B |
|
||
| Consumer Goods | 9 | $162B |
|
||
| Insurance | 4 | $225B |
|
||
| Telecommunications | 2 | $144B |
|
||
| Pharmaceuticals | 2 | $112B |
|
||
| Media / Entertainment | 2 | $69B |
|
||
Price history
+167.1% since first listed7 events — show timeline
- 2025-11-11 Listed $160,000 GBAOR
- 2025-09-16 Price Changed $157,000 GBAOR
- 2025-06-29 Listed $159,000 GBAOR
- 2024-11-15 Listed $159,000 GBAOR
- 2024-06-12 Sold (MLS) $71,500 GBAOR
- 2024-04-06 Pending — GBAOR
- 2024-04-02 Listed $59,900 GBAOR
Property tax history
+2.2%/yrLatest (2025): $4,918 · +1.7% YoY. Source: county tax records.
Cash-flow waterfall
monthlySold comps — $/sqft
last 12 mo · ≤1 miLoading sold comps…