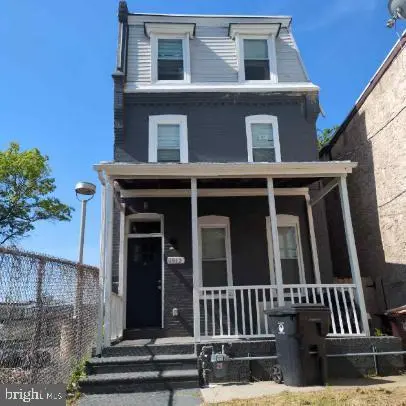
1812 W 2nd St · Wilmington, DE
Flood risk 1/10 · Minimal
- FEMA flood zone
- X (unshaded)
- Chance of flooding over 30 yrs
- 0.0%
- Est. flood insurance / yr
- $473 – $860
Fire risk 1/10 · Minimal
- Est. fire insurance / yr
- $476 – $884
Heat risk 8/10 · Major
- Hot days now (above 103°F)
- 7 days/yr
- Hot days in 30 yrs
- 16 days/yr
Wind risk 6/10 · Moderate
- Chance of severe wind over 30 yrs
- 27.0%
Air-quality risk 3/10 · Minor
- Unhealthy air days now
- 3 days/yr
- Unhealthy air days in 30 yrs
- 4 days/yr
Risk factors via First Street. Map © Google.
Why this score? — see what drove the C- grade
The composite is a weighted blend of 9 inputs, each scored 0–100. Each bar is that input's sub-score; the figure is the points it added to the 100-point composite (weight × sub-score).
- Cash flow +21.6/30.0
- ARV discount +7.5/15.0
- DSCR +6.9/10.0
- 1% rule +4.4/10.0
- Rent growth +4.1/5.0
- Livability +3.2/5.0
- Schools +3.1/10.0
- Condition / age +2.5/5.0
- Appreciation +0.0/10.0
$200,000
🖨 Deal sheet 📄 Offer letter ✓ Due diligence
Listing remarks MLS
Single Family City Home. Convenient To All Locations. Property To Be Sold In "As Is" Condition. Easy To Show!
Key facts
- Built 1929
- Listed 6 days
Property features AI
Finance
- Financial info: Total actual rent reported: $26,400
Exterior
- Parking: On-street parking
- Utilities: Public water; Public sewer; Natural gas
- Home design: End-of-row townhouse; Fee simple ownership; Property in good condition; Year built: estimated
- Construction: Brick and vinyl siding construction; Other foundation
- Exterior features: Sidewalks; Street lights; Ground rent paid annually
Interior
- Kitchen: Eat-in kitchen
- Bedrooms: Four bedrooms on the main level
- Flooring: Luxury vinyl tile; Ceramic tile
- Bathrooms: Two full bathrooms; One half bathroom
- Heating & cooling: Forced air heating; Natural gas heating and hot water; Circuit breaker electrical; Cooling: Other
- Interior features: Eat-in kitchen; Full unfinished basement
- Laundry & utility: Laundry in basement/lower level
Neighborhood map
What this means for you Summary
Snapshot
- This is a 5-bed/1.0-bath townhouse listed at $200k.
Deal economics
- At list price, monthly cash flow is $305 ($4k/yr) — positive.
- The deal already cash-flows at list — no discount required.
- To meet the 1% rule (rent ≥ 1% of price), the offer needs to be $189k (5.6% below list).
- Recommended offer: $189k (5.6% below list) — sets the bar for 1% rule.
- Cap rate 8.1% vs local median 5.6% in Wilmington — top-decile yield for the area; either an underpriced asset or a hidden risk that comps aren't pricing in. Stress-test before assuming the spread holds.
Location & tenants
- Location reads 64/100 on livability (#52 in DE) — a middle-class / working-renter tenant base. Strengths: cost of living A+, housing A; Watch: employment D+, commute D, crime F.
- Red Clay Consolidated School District (suburban): math 27% / reading 42% proficiency, ranked #12 of 26 in DE (top 46%) — families likely to look elsewhere, expect single-tenant / working-renter base with shorter leases.
- Zoned schools: Warner Elementary School (math 2% / reading 2%, grade F, #104 of 105 statewide, top 100%, 360 students, 0% FRL); Mckean (Thomas) High School (math 2% / reading 17%, grade F, #38 of 40 statewide, top 100%, 927 students, 0% FRL) — zoned schools average 0% FRL vs 44% district-wide (44 pts lower); this property's tenant base skews higher-income than the district average.
- Zoned-school proficiency averages 6% at this address vs 34% district-wide (-28 pts) — the specific schools serving this property underperform the Red Clay Consolidated School District average; the district grade overstates school quality for this exact location.
- Market conditions: Rents rising fast (+6.3%/yr); 167 active listings in the ZIP; 1,367 units permitted in New Castle County in 2024 (201 in 5+ unit buildings).
Forward outlook
- Local home prices are declining (-3.0%/yr); year-one equity from $1k of loan paydown is wiped out by about $6k of value loss. Plan a longer hold.
- New Castle County population projected at +9% by 2050 — modest demand growth; plan on rents tracking national, not racing it.
- At projected returns (-3.0% appreciation + 6.3% rent growth), your $56k cash investment doubles in ~10 years — after that, you're playing with house money.
Negotiation context
- Only 7 days on market — expect competitive offers; lowballing is unlikely to land.
- Current owner paid $20k; list at $200k implies a 905% gain — meaningful room to come down on a strong offer.
Risks & watch-outs
- Watch-outs: built in 1929 — expect roof / HVAC / electrical / plumbing capex.
- Climate carrying-cost: major wind risk, 27% chance of damaging wind over 30y; extreme-heat days projected 7→16/yr by 2055 (HVAC capex compounding) — expect insurance premiums to compound above CPI over the hold.
Questions for the listing agent
- Built in 1929 — when were the roof, HVAC, electrical panel, plumbing, and water heater last replaced?
- Is there a deadline driving the sale (1031 exchange, divorce, estate, relocation)? That informs how much negotiation room exists.
- Schools are D-rated, which usually means shorter tenancies and higher turnover. Who's the typical renter profile here, and what's been the actual vacancy rate?
- Crime grade is F in this area — have there been break-ins, vandalism, or insurance claims at this property in the last 3 years? What carrier currently insures it and at what premium?
- What's the average days-on-market for RENTAL listings here right now (not sales)? A rising rental-DOM trend means longer vacancies and softer asking-rent achievability than the comps imply.
- What's the recent tenant-quality profile in this submarket — average credit score on applications, eviction rate, late-payment / NSF rate, and stable-employment percentage? A property-management company in the area should have these aggregated.
- How much new for-sale + rental construction is in the pipeline within 1–3 miles? Heavy new supply typically softens prices + rents 12–24 months out; constrained supply supports both.
Investment metrics
- 1% rule
- 0.94% ✗
- Cap rate
- 8.12%
- Cash-on-cash
- 6.53%
- DSCR
- 1.29
- GRM
- 8.8
CMA / ARV
No comps found within radius.
Projected returns pro-forma
-3.0% appreciation · 6.35% rent growth · sell at horizon
- IRR
- -3.0%
- Equity multiple
- 0.88×
- Total profit
- $-6,519
- Equity at exit
- $29,821
- IRR
- 9.7%
- Equity multiple
- 1.85×
- Total profit
- $47,852
- Equity at exit
- $17,292
Cash invested: $56,000 (down + closing). Projections, not guarantees.
Landlord ↔ Tenant lean methodology
- Overall (STATE)
- 70 Landlord-Friendly
- State Delaware
- 70 Landlord-Friendly · D+7
- County
- — inherits STATE
- City
- — inherits STATE
ZIP-level market 19805
- Rents YoY
- 6.3%
- Active inventory
- 167
- Price-to-rent
- 8.8×
Monthly cashflow live
- Estimated rent
- $1,888 medium interval (Pro) →
- Mortgage (P&I)
- −$1,049
- Tax from tax record
- −$55 /mo · $655/yr
- Insurance
- −$83
- HOA
- −$0
- Vacancy / Maint / Mgmt
- −$396
- Net cashflow
- $305
Break-even live
UW: 25.0% down · 7.5% · 30yr · 1.5% tax · 5.0% vac · 8.0% maint · 8.0% mgmt
Financing live
Cash to close
- Down payment
- $50,000
- Closing costs
- $6,000
- Reserves months
- —
- Total cash needed
- —
Loan-product check · same deal, 3 products live
Conventional
25% down · 7.5% · 30yr
- Down + closing
- —
- Monthly P&I
- —
- Monthly cashflow
- —
- DSCR
- —
- Eligible?
- —
Personal DTI + credit; lowest rate.
DSCR
20% down · 8.5% · 30yr
- Down + closing
- —
- Monthly P&I
- —
- Monthly cashflow
- —
- DSCR
- —
- Eligible?
- —
No personal income docs; deal must DSCR.
Hard money
10% down · 12.0% · 12mo
- Down + closing
- —
- Monthly P&I
- —
- Monthly cashflow
- —
- DSCR
- —
- Eligible?
- —
Short-term bridge; refi at stabilization.
Listing history 10 events
-
2026-06-18days on market $200,000 Active 7 DOM
-
2026-06-17days on market $200,000 Active 6 DOM
-
2026-06-16days on market $200,000 Active 5 DOM
-
2026-06-15days on market $200,000 Active 4 DOM
-
2026-06-13days on market $200,000 Active 2 DOM
-
2026-06-13statusdays on market $200,000 Active 1 DOM
-
2026-06-09days on market $200,000 Coming Soon 4 DOM
-
2026-06-08days on market $200,000 Coming Soon 3 DOM
-
2026-06-07remarks 699-char remark
-
2026-06-07$200,000 Coming Soon 2 DOM
ⓘ Source: listings_history table (triggers on properties + properties_extension) + one-shot
backfill from property_details.listing_events for pre-trigger history.
Tax reassessment forecast DE · Partial reset (capped growth)
- Current annual tax
- $655 · $55/mo
- Projected year-2 tax
- $908 · $76/mo
- Expected delta
- +$252/yr (+$21/mo · 38.5%)
ⓘ Screening estimate from a state-policy table — verify with the county assessor before closing.
Climate risk First Street
- Flood 1/10 Low FEMA zone X (unshaded) · 0% chance over 30 yrs
- Wildfire 1/10 Low
- Heat 8/10 Severe 7 d/yr ≥103°F today · 16 d/yr by 30 yrs out
- Wind 6/10 Major 27% chance of damaging wind over 30 yrs
- Air quality 3/10 Moderate 3 unhealthy d/yr today · 4 by 30 yrs out
Nearby sold comps map
Loading sold comps map…
Walkable amenities ~0.75 mi
Loading nearby amenities…
Taxation est. · year 1
- Rental income
- $22,655
- − Mortgage interest
- −$11,203
- − Property taxes
- −$655
- − Insurance
- −$1,000
- − Repairs & maintenance
- −$1,812
- − Management
- −$1,812
- − Depreciation
- −$5,818
- Taxable income
- $353
- Est. tax owed @ 24.0%
- −$85
- After-tax cash flow
- $3,571/yr
For passive investors: Depreciation is non-cash, so a rental often shows a tax loss while cash-flowing — sheltering income. Rental losses are passive: they offset passive income freely, and up to $25,000/yr can offset ordinary (W-2) income if you actively participate and your MAGI is under $100k (phasing out to $0 by $150k); unused losses carry forward. On sale, claimed depreciation is recaptured at up to 25%, and gains may owe capital-gains tax (a 1031 exchange can defer both). Figures are a year-1 estimate at your 24.0% rate — not tax advice; consult a CPA.
Schools (NCES district)
- District
- Red Clay Consolidated School District
- NCES district ID
- 1001300
- Math proficiency
- 27% ▼ -11.00%
- Reading proficiency
- 42% ▼ -7.00%
- Median HH income
- $64,298
- Composite
- 31.25/100
- National rank
- #6027
- State rank
- #12 of 26 in DE
Livability — Wilmington
- Score
- 64/100
- State rank
- #52
- US rank
- #14251
Category grades
Schools grade is shown separately in the Schools card above.
Census & demographics
- Census place
- Wilmington, DE
- County
- New Castle County · 483,412 people
- City population
- 173,480
- Metro
- Philadelphia-Camden-Wilmington, PA-NJ-DE-MD
- Population (ZIP)
- 41,402
- Household income
- $60,221
- Rent vs Own
- Severe rent burden
- 1730.0
Population outlook (New Castle County) Hauer SSP2
- Today (2025)
- 594,686 people
- By 2030
- 609,164 · +2.4%
- By 2040
- 632,154 · +6.3%
- By 2050
- 649,068 · +9.1%
- By 2075
- 687,771 · +15.7%
- By 2100
- 694,961 · +16.9%
Race, ethnicity, and origin ACS 2023
- Neighborhood character
- Diverse neighborhood (Simpson 0.70)
- Race & ethnicity
- White 37% Black 32% Hispanic / Latino 25% Two or more races 10%
- Hispanic origin (detail)
- Mexican 10% Puerto Rican 10% Dominican 2%
- Common ancestry
- Romanian 4% Slovak 1% Italian 1%
- Foreign-born
- 9% · Canada
- Languages at home
- 79% English-only · Spanish 18% French/Haitian/Cajun 1% Arabic 1%
Political lean MEDSL · New Castle
- 2024 margin
- Solid D (+32.6) · D 65.5% · R 32.9% · Other 1.6%
- 2008→2024 swing
- -8.1pp toward R · 2008: 40.6pp · 2024: 32.6pp
- All cycles
- 2024: D+32.6 2020: D+37.1 2016: D+29.6 2012: D+34.1 2008: D+40.6
Not yet ingested
- Civics
- —
Market trends
- HPI YoY
- ▼ -291.16%
- Current HPI
- 259.1455
- Rent YoY
- ▲ 6.35%
- Metro
- Philadelphia-Camden-Wilmington, PA-NJ-DE-MD
- State GDP YoY
- —
- F500 in state
- 0
Price history
+239.0% since first listed5 events — show timeline
- 2026-06-05 Coming Soon $200,000 BRIGHT MLS
- 2000-05-30 Sold (MLS) $19,900 BRIGHT MLS
- 2000-03-18 Listing Removed — BRIGHT MLS
- 1999-07-28 Listed $19,900 BRIGHT MLS
- 1999-05-03 Sold (Public Records) $59,000 Public Records
Property tax history
+4.8%/yrLatest (2024): $655 · +15.1% YoY. Source: county tax records.
Cash-flow waterfall
monthlySold comps — $/sqft
last 12 mo · ≤1 miLoading sold comps…