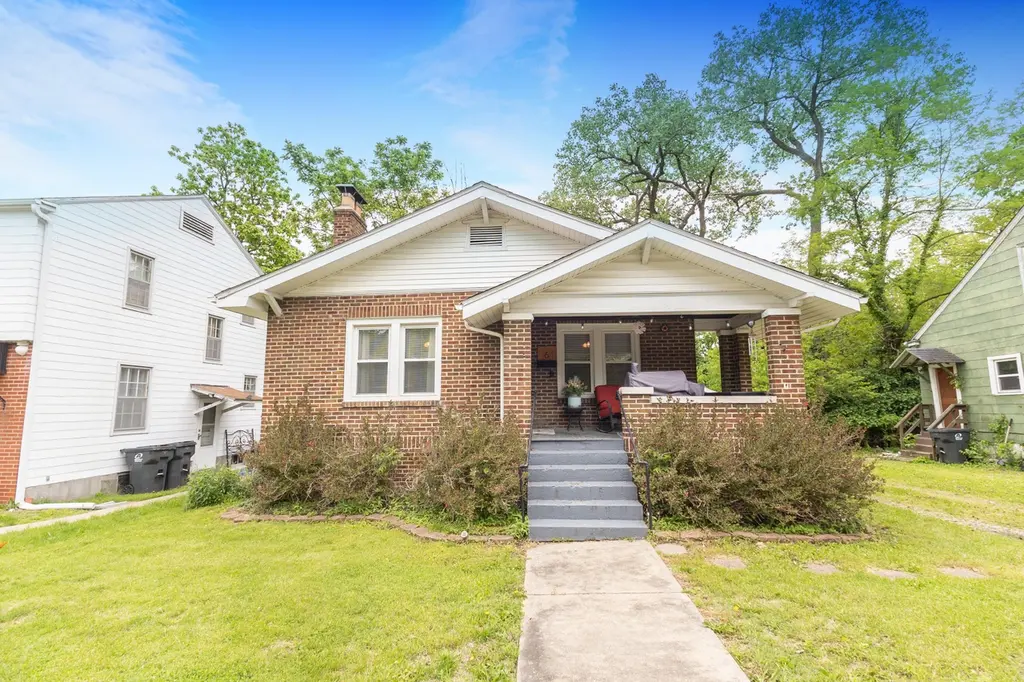
6 Windsor Pl · Moberly, MO
Flood risk 1/10 · Minimal
- FEMA flood zone
- X (unshaded)
- Chance of flooding over 30 yrs
- 0.0%
- Est. flood insurance / yr
- $507 – $1,088
Fire risk 4/10 · Minor
- Est. fire insurance / yr
- $1,054 – $1,958
Heat risk 3/10 · Minor
- Hot days now (above 106°F)
- 7 days/yr
- Hot days in 30 yrs
- 17 days/yr
Wind risk 2/10 · Minimal
- Chance of severe wind over 30 yrs
- —
Air-quality risk 1/10 · Minimal
- Unhealthy air days now
- 0 days/yr
- Unhealthy air days in 30 yrs
- 0 days/yr
Risk factors via First Street. Map © Google.
Why this score? — see what drove the D grade
The composite is a weighted blend of 9 inputs, each scored 0–100. Each bar is that input's sub-score; the figure is the points it added to the 100-point composite (weight × sub-score).
- Cash flow +15.8/30.0
- ARV discount +6.9/15.0
- DSCR +4.9/10.0
- Livability +3.9/5.0
- 1% rule +3.7/10.0
- Schools +2.7/10.0
- Rent growth +2.5/5.0
- Condition / age +2.5/5.0
- Appreciation +0.0/10.0
$124,900
🖨 Deal sheet 📄 Offer letter ✓ Due diligence
Listing remarks MLS
Charming 2 bedroom bungalow on dead-end street with refinished hardwood floors & several original built-ins! New kitchen & bathroom remodeling, new roof & new detached garage. Full, unfinished basement great for extra storage. Small patio in back with wooded backdrop. Wood-burning fireplace not recently used. Home comes fully applianced with full offer. Quick possession possible!
Key facts
- Covered front porch
- Brick bungalow
- Unfinished basement
Tags
Property features AI
Exterior
- Parking: Detached garage with garage door opener (1 car)
- Utilities: Public water; Public sewer
- Home design: Single-family residence; Residential property
- Construction: Brick construction; Shingle roof
- Exterior features: Covered patio; Chain link fencing
Interior
- Kitchen: Disposal; Electric range; Refrigerator
- Heating & cooling: Forced air heating (natural gas); Central air conditioning; Ceiling fans
- Interior features: Insulated windows; Wood-burning fireplace; Full unfinished basement
- Laundry & utility: Washer; Dryer
Neighborhood map
What this means for you Summary
Snapshot
- This is a 2-bed/1.0-bath single-family listed at $125k.
Deal economics
- At list price, monthly cash flow is $56 ($675/yr) — positive.
- The deal already cash-flows at list — no discount required.
- To meet the 1% rule (rent ≥ 1% of price), the offer needs to be $109k (12.7% below list).
- Recommended offer: $109k (12.7% below list) — sets the bar for 1% rule.
- Cap rate 6.8% vs local median 4.5% in Moberly — top-decile yield for the area; either an underpriced asset or a hidden risk that comps aren't pricing in. Stress-test before assuming the spread holds.
Location & tenants
- Location reads 77/100 on livability (#32 in MO, #3,045 nationally) — a middle-class / working-renter tenant base. Strengths: cost of living A+, housing A+, health & safety A+; Watch: employment D, schools D-, amenities F.
- Moberly (town): math 30% / reading 36% proficiency, ranked #246 of 324 in MO (top 76%) — families likely to look elsewhere, expect single-tenant / working-renter base with shorter leases.
- Market conditions: 134 active listings in the ZIP; 1 comparable units currently listed for rent nearby; 25 units permitted in Randolph County in 2024 (0 in 5+ unit buildings).
Forward outlook
- Local home prices are declining (-3.0%/yr); year-one equity from $864 of loan paydown is wiped out by about $4k of value loss. Plan a longer hold.
- Randolph County population projected at -10% by 2050 — secular population decline; favor cash flow + early exit over multi-decade hold.
Negotiation context
- It's been on market 19 days — a 2% lower offer ($123k) is reasonable based on typical stale-listing flexibility.
- 5 sale attempts since 11y ago with the ask held roughly flat each time — persistent listings suggest the price (not the market) is what's stuck; bring a comps-based counter.
- Current owner paid $75k; list at $125k implies a 67% gain — meaningful room to come down on a strong offer.
Risks & watch-outs
- Watch-outs: built in 1920 — expect roof / HVAC / electrical / plumbing capex.
Questions for the listing agent
- Built in 1920 — when were the roof, HVAC, electrical panel, plumbing, and water heater last replaced?
- Is there a deadline driving the sale (1031 exchange, divorce, estate, relocation)? That informs how much negotiation room exists.
- Schools are D-rated, which usually means shorter tenancies and higher turnover. Who's the typical renter profile here, and what's been the actual vacancy rate?
- The area grade is low — what's the realistic commute time and amenity access for the typical tenant pool here? Any planned neighborhood developments (good or bad) we should know about?
- What's the average days-on-market for RENTAL listings here right now (not sales)? A rising rental-DOM trend means longer vacancies and softer asking-rent achievability than the comps imply.
- What's the recent tenant-quality profile in this submarket — average credit score on applications, eviction rate, late-payment / NSF rate, and stable-employment percentage? A property-management company in the area should have these aggregated.
- How much new for-sale + rental construction is in the pipeline within 1–3 miles? Heavy new supply typically softens prices + rents 12–24 months out; constrained supply supports both.
Investment metrics
- 1% rule
- 0.87% ✗
- Cap rate
- 6.83%
- Cash-on-cash
- 1.93%
- DSCR
- 1.09
- GRM
- 9.5
CMA / ARV
- ARV (median comp)
- $123,325
- List price
- $124,900
- Delta
- 1.28%
- Verdict
- FAIR
- Comps
- 20 within 1.0 mi
Show comp detail 12 sales within ~0.75 mi
| Address | Dist | Beds/Ba | Sqft | Sold | Price | $/sf | Match |
|---|---|---|---|---|---|---|---|
| 612 S 4th St | 0.44mi | 2/1.0 | 1,066 (-1%) | 1mo | $35,000 | $33 | 78 |
| 319 S 6th St | 0.23mi | 2/1.0 | 966 (-10%) | 7mo | $89,900 | $93 | 66 |
| 809 S 4th St | 0.52mi | 2/1.0 | 1,100 (+3%) | 7mo | $135,000 | $123 | 65 |
| 707 S 5th St | 0.41mi | 3/2.0 (+1) | 1,150 (+7%) | 2mo | $179,900 | $156 | 58 |
| 620 Burkholder St | 0.56mi | 2/1.0 | 1,150 (+7%) | 6mo | $159,500 | $139 | 57 |
| 1126 Fisk Ave | 0.38mi | 2/2.0 | 1,219 (+14%) | 5mo | $135,000 | $111 | 52 |
| 411 Shumate Ave | 0.69mi | 3/1.5 (+1) | 1,008 (-6%) | 1mo | $162,000 | $161 | 50 |
| 1123 Concannon St | 0.65mi | 3/1.0 (+1) | 968 (-10%) | 1mo | $148,000 | $153 | 48 |
| 837 Myra St | 0.65mi | 3/2.0 (+1) | 1,130 (+5%) | 7mo | $149,500 | $132 | 46 |
| 1029 Concannon St | 0.62mi | 3/2.0 (+1) | 960 (-10%) | 2mo | $165,000 | $172 | 43 |
| 1201 Bond St | 0.65mi | 2/1.0 | 1,210 (+13%) | 6mo | $120,000 | $99 | 43 |
| 517 S Clark St | 0.49mi | 3/2.0 (+1) | 1,229 (+15%) | 6mo | $209,900 | $171 | 38 |
Match score weights: distance 35% · size 25% · config 20% · recency 20%. Top-matched comps best support the ARV.
Projected returns pro-forma
-3.0% appreciation · 3.0% rent growth · sell at horizon
- IRR
- -13.3%
- Equity multiple
- 0.52×
- Total profit
- $-16,678
- Equity at exit
- $18,623
- IRR
- -4.3%
- Equity multiple
- 0.71×
- Total profit
- $-9,991
- Equity at exit
- $10,799
Cash invested: $34,972 (down + closing). Projections, not guarantees.
Landlord ↔ Tenant lean methodology
- Overall (STATE)
- 81 Strongly Landlord-Friendly
- State Missouri
- 81 Strongly Landlord-Friendly · R+10
- County
- — inherits STATE
- City
- — inherits STATE
ZIP-level market 65270
- Home prices YoY
- -30.6%
- Active inventory
- 134
- Price-to-rent
- 9.5×
Monthly cashflow live
- Estimated rent
- $1,090 medium interval (Pro) →
- Mortgage (P&I)
- −$655
- Tax from tax record
- −$98 /mo · $1,174/yr
- Insurance
- −$52
- HOA
- −$0
- Vacancy / Maint / Mgmt
- −$229
- Net cashflow
- $56
Break-even live
UW: 25.0% down · 7.5% · 30yr · 1.5% tax · 5.0% vac · 8.0% maint · 8.0% mgmt
Financing live
Cash to close
- Down payment
- $31,225
- Closing costs
- $3,747
- Reserves months
- —
- Total cash needed
- —
Loan-product check · same deal, 3 products live
Conventional
25% down · 7.5% · 30yr
- Down + closing
- —
- Monthly P&I
- —
- Monthly cashflow
- —
- DSCR
- —
- Eligible?
- —
Personal DTI + credit; lowest rate.
DSCR
20% down · 8.5% · 30yr
- Down + closing
- —
- Monthly P&I
- —
- Monthly cashflow
- —
- DSCR
- —
- Eligible?
- —
No personal income docs; deal must DSCR.
Hard money
10% down · 12.0% · 12mo
- Down + closing
- —
- Monthly P&I
- —
- Monthly cashflow
- —
- DSCR
- —
- Eligible?
- —
Short-term bridge; refi at stabilization.
Rent comps 1 comps
| Address | Beds | Baths | Sqft | Rent | $/sqft | DOM | Units | Dist |
|---|---|---|---|---|---|---|---|---|
| 204 Cockrell Dr Moberly, MO | 2.0 | 2.0 | 1150 | $1,090 | $0.95 | 43d | 1 | 0.77mi |
Listing history 15 events
-
2026-05-07$124,900 Active 495-char remark
-
2024-06-13historical 400-char remark
Show marketing remark (400 chars)
Charming 2 bedroom bungalow on dead-end street with refinished hardwood floors & several original built-ins! New kitchen & bathroom remodeling, new roof & new detached garage. Full, unfinished basement great for extra storage. Small patio in back with wooded backdrop. Wood-burning fireplace not recently used. Home comes fully applianced with full offer. Quick possession possible!
-
2023-07-10historical
Show marketing remark (252 chars)
Great bungalow style home with lots of charm! This 2 bed 1 bath home has beautiful hardwood floors, new windows, a fireplace, 1 car detached garage, and sits on a dead end street! The basement is dry and has tons of storage! Don't miss out, call today!
-
2020-09-22soldstatus $74,900
-
2020-08-04$74,900
Show marketing remark (252 chars)
Great bungalow style home with lots of charm! This 2 bed 1 bath home has beautiful hardwood floors, new windows, a fireplace, 1 car detached garage, and sits on a dead end street! The basement is dry and has tons of storage! Don't miss out, call today!
-
2017-07-10$69,900
-
2015-12-04soldstatus
-
2015-12-04soldstatus $62,000
-
2015-09-29$65,000 400-char remark
Show marketing remark (400 chars)
Charming 2 bedroom bungalow on dead-end street with refinished hardwood floors & several original built-ins! New kitchen & bathroom remodeling, new roof & new detached garage. Full, unfinished basement great for extra storage. Small patio in back with wooded backdrop. Wood-burning fireplace not recently used. Home comes fully applianced with full offer. Quick possession possible!
-
2015-09-28$65,000
-
2012-09-17soldstatus $56,000
-
2011-08-18soldstatus $29,000
-
2006-09-29soldstatus
-
2005-08-31soldstatus $58,000
-
1986-01-21soldstatus
ⓘ Source: listings_history table (triggers on properties + properties_extension) + one-shot
backfill from property_details.listing_events for pre-trigger history.
Tax reassessment forecast MO · Resets to sale price
- Current annual tax
- $1,174 · $98/mo
- Projected year-2 tax
- $1,212 · $101/mo
- Expected delta
- +$37/yr (+$3/mo · 3.2%)
ⓘ Screening estimate from a state-policy table — verify with the county assessor before closing.
Climate risk First Street
- Flood 1/10 Low FEMA zone X (unshaded) · 0% chance over 30 yrs
- Wildfire 4/10 Moderate
- Heat 3/10 Moderate 7 d/yr ≥106°F today · 17 d/yr by 30 yrs out
- Wind 2/10 Low
- Air quality 1/10 Low 0 unhealthy d/yr today · 0 by 30 yrs out
Nearby sold comps map
Loading sold comps map…
Walkable amenities ~0.75 mi
Loading nearby amenities…
Taxation est. · year 1
- Rental income
- $13,080
- − Mortgage interest
- −$6,996
- − Property taxes
- −$1,174
- − Insurance
- −$624
- − Repairs & maintenance
- −$1,046
- − Management
- −$1,046
- − Depreciation
- −$3,633
- Taxable loss
- −$1,441
- Est. tax savings @ 24.0%
- +$346
- After-tax cash flow
- $1,021/yr
For passive investors: Depreciation is non-cash, so a rental often shows a tax loss while cash-flowing — sheltering income. Rental losses are passive: they offset passive income freely, and up to $25,000/yr can offset ordinary (W-2) income if you actively participate and your MAGI is under $100k (phasing out to $0 by $150k); unused losses carry forward. On sale, claimed depreciation is recaptured at up to 25%, and gains may owe capital-gains tax (a 1031 exchange can defer both). Figures are a year-1 estimate at your 24.0% rate — not tax advice; consult a CPA.
Schools (NCES district)
- District
- Moberly
- NCES district ID
- 2921100
- Math proficiency
- 30% ▼ -1.00%
- Reading proficiency
- 36% ▼ -3.00%
- Median HH income
- $36,160
- Composite
- 27.35/100
- National rank
- #6984
- State rank
- #246 of 324 in MO
Livability — Moberly
- Score
- 77/100
- State rank
- #32
- US rank
- #3045
Category grades
Schools grade is shown separately in the Schools card above.
Census & demographics
- Census place
- Moberly, MO
- Population (ZIP)
- 16,762
Population outlook (Randolph County) Hauer SSP2
- Today (2025)
- 24,596 people
- By 2030
- 24,213 · -1.6%
- By 2040
- 23,184 · -5.7%
- By 2050
- 22,081 · -10.2%
- By 2075
- 18,994 · -22.8%
- By 2100
- 15,070 · -38.7%
Race, ethnicity, and origin ACS 2023
- Neighborhood character
- Predominantly White (84%)
- Race & ethnicity
- White 84% Black 7% Two or more races 6% Hispanic / Latino 3%
- Common ancestry
- Italian 2% Lithuanian 2% Iranian 1%
- Foreign-born
- 1% · Canada
- Languages at home
- 98% English-only · Spanish 1%
Political lean MEDSL · Randolph
- 2024 margin
- Solid R (+52.2) · D 23.3% · R 75.5% · Other 1.2%
- 2008→2024 swing
- -28.9pp toward R · 2008: -23.3pp · 2024: -52.2pp
- All cycles
- 2024: R+52.2 2020: R+51.5 2016: R+50.9 2012: R+36.6 2008: R+23.3
Not yet ingested
- Civics
- —
Market trends
- HPI YoY
- ▼ -88.15%
- Current HPI
- 199.9743
- Rent YoY
- —
- Metro
- —
- State GDP YoY
- ▲ 1.84%
- F500 in state
- 20
Industry mix (Fortune 500 HQ in MO)
| Industry | F500 HQs | Revenue |
|---|---|---|
| Healthcare | 1 | $163B |
|
||
| Insurance | 1 | $21B |
|
||
| Industrial Technology | 1 | $17B |
|
||
| Retail | 1 | $16B |
|
||
| Industrial Distribution | 1 | $10B |
|
||
| Utilities | 1 | $9B |
|
||
Price history
+115.3% since first listed17 events — show timeline
- 2026-06-08 Sold (MLS) — RCBR
- 2026-05-26 Pending — RCBR
- 2026-05-07 Listed $124,900 RCBR
- 2024-06-13 Delisted — RCBR
- 2023-07-10 Delisted — RCBR
- 2020-09-22 Sold (Public Records) $74,900 Public Records
- 2020-08-04 Listed $74,900 RCBR
- 2017-07-10 Listed $69,900 CBORMLS
- 2015-12-04 Sold (Public Records) $62,000 Public Records
- 2015-12-04 Sold (MLS) — CBORMLS
- 2015-09-29 Listed $65,000 RCBR
- 2015-09-28 Listed $65,000 CBORMLS
- 2012-09-17 Sold (Public Records) $56,000 Public Records
- 2011-08-18 Sold (Public Records) $29,000 Public Records
- 2006-09-29 Sold (Public Records) — Public Records
- 2005-08-31 Sold (Public Records) $58,000 Public Records
- 1986-01-21 Sold (Public Records) — Public Records
Property tax history
+4.4%/yrLatest (2025): $1,174 · +9.1% YoY. Source: county tax records.
Cash-flow waterfall
monthlySold comps — $/sqft
last 12 mo · ≤1 miLoading sold comps…