 🏗️ New Construction
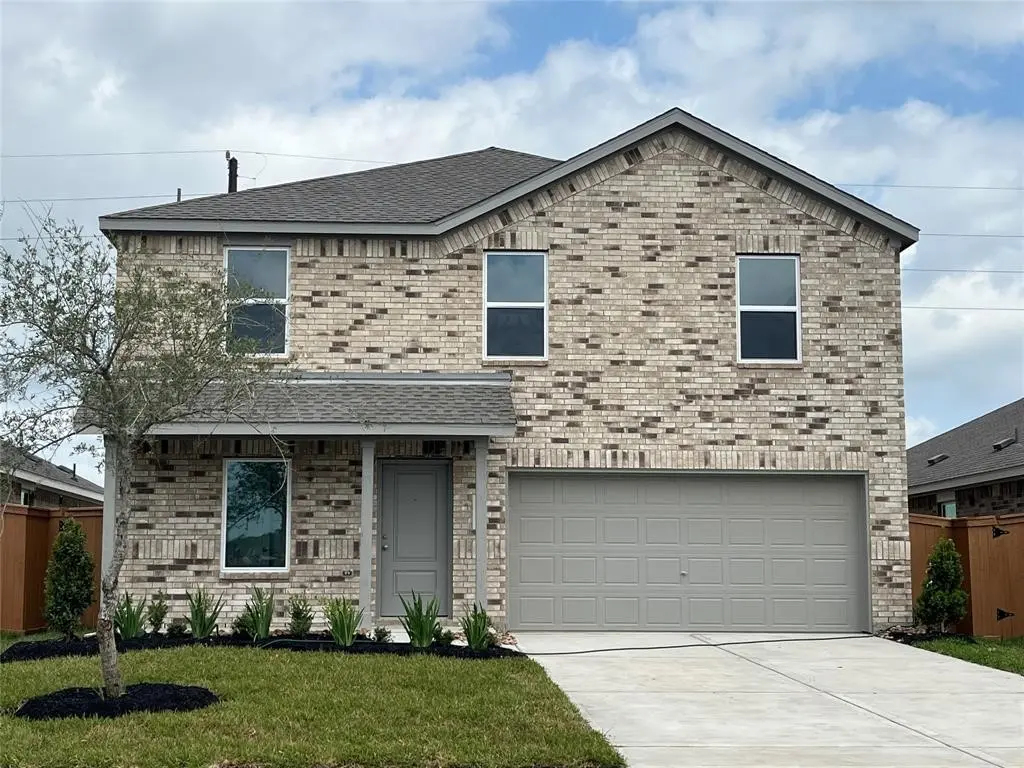
604 Monarch Trl · Huntsville, TX
Flood risk No data
- FEMA flood zone
- —
- Chance of flooding over 30 yrs
- —
- Est. flood insurance / yr
- —
Fire risk No data
- Est. fire insurance / yr
- —
Heat risk No data
- Hot days now (above threshold)
- —
- Hot days in 30 yrs
- —
Wind risk No data
- Chance of severe wind over 30 yrs
- —
Air-quality risk No data
- Unhealthy air days now
- —
- Unhealthy air days in 30 yrs
- —
Risk factors via First Street. Map © Google.
Why this score? — see what drove the F grade
The composite is a weighted blend of 9 inputs, each scored 0–100. Each bar is that input's sub-score; the figure is the points it added to the 100-point composite (weight × sub-score).
- Cash flow +8.9/30.0
- ARV discount +7.5/15.0
- Condition / age +4.0/5.0
- Rent growth +3.2/5.0
- Livability +3.2/5.0
- 1% rule +2.9/10.0
- Schools +2.6/10.0
- DSCR +2.5/10.0
- Appreciation +0.0/10.0
$239,990
🖨 Deal sheet 📄 Offer letter ✓ Due diligence
Listing remarks
The Littleton Floor Plan - On the first floor of this spacious two-story home is a convenient and modern layout seamlessly connecting the kitchen, dining room and family room together. In a private corner is the tranquil owner’s suite with an attached bathroom and walk-in closet. Upstairs is a sprawling central game room made for gatherings of all sizes, along with three secondary bedrooms to provide sleeping accommodations to family members and guests. The completion date, prices and features may vary and are subject to change. Please verify with Lennar directly. Photos are for illustrative purposes only.
Key facts
- Central game room
- Attached bathroom
- Walk-in closet
Tags
Property features AI
Finance
- HOA & community: Community association managed by CH&P Management; Annual association fee of $400
Exterior
- Parking: Attached 2-car garage
- Utilities: Public water; Public sewer
- Home design: Residential property; Under construction (new construction); Slab foundation
- Construction: Built in 2026; Brick construction; Composition roof
- Exterior features: Back yard fence
Interior
- Kitchen: Dishwasher; Electric oven; Electric range; Gas oven; Gas range
- Bedrooms: Primary bedroom on first floor (13 x 15); Bedroom on second floor (10 x 11); Bedroom on second floor (10 x 10); Bedroom on second floor (10 x 10); Game room on second floor (12 x 20); Family room on first floor (15 x 16)
- Flooring: Carpet; Vinyl
- Bathrooms: 2 full bathrooms; 1 half bathroom
- Heating & cooling: Central heating (electric and gas); Central air (electric and gas)
- Interior features: Breakfast bar; Kitchen/family room combo; Kitchen/dining combo; Primary bedroom with private bath; Separate shower; Tub/shower
- Laundry & utility: Washer hookup; Electric dryer hookup; Gas dryer hookup
Neighborhood map
What this means for you Summary
Snapshot
- This is a 4-bed/2.5-bath single-family listed at $240k. Condition is rated good.
Deal economics
- At list price, monthly cash flow is $-209 ($-3k/yr) — negative.
- To cash-flow at today's rent, offer at most $231k (3.7% below list).
- To meet the 1% rule (rent ≥ 1% of price), the offer needs to be $206k (14.0% below list).
- Recommended offer: $206k (14.0% below list) — sets the bar for 1% rule.
- Cap rate 5.3% vs local median 2.6% in Huntsville — top-decile yield for the area; either an underpriced asset or a hidden risk that comps aren't pricing in. Stress-test before assuming the spread holds.
Location & tenants
- Location reads 63/100 on livability (#825 in TX) — a middle-class / working-renter tenant base. Strengths: cost of living A+; Watch: amenities C-, crime D-, commute F.
- Huntsville ISD (town): math 25% / reading 37% proficiency, ranked #621 of 826 in TX (top 75%) — families likely to look elsewhere, expect single-tenant / working-renter base with shorter leases.
- Zoned schools: Samuel Houston El (math 17% / reading 17%, grade F, #3,836 of 4,322 statewide, top 91%, 437 students, 79% FRL); Mance Park Middle (math 26% / reading 25%, grade F, #1,236 of 1,662 statewide, top 76%, 904 students, 74% FRL); Huntsville H S (math 13% / reading 25%, grade F, #1,431 of 1,632 statewide, top 88%, 1,797 students, 68% FRL) — zoned schools average 74% FRL vs 42% district-wide (32 pts higher); higher-poverty schools than district average — tighter screening recommended.
- Market conditions: Rents rising (+2.9%/yr); 518 active listings in the ZIP; 2 comparable units currently listed for rent nearby; 527 units permitted in Walker County in 2024 (0 in 5+ unit buildings).
- This rent runs 44% of the median local income ($56k/yr) — at the standard rent-burdened threshold; future hikes will face affordability resistance.
Forward outlook
- Local home prices are declining (-3.0%/yr); year-one equity from $2k of loan paydown is wiped out by about $8k of value loss. Plan a longer hold.
- Walker County population projected at +29% by 2050 — long-run rental-demand tailwind backs the buy-and-hold thesis.
Negotiation context
- It's been on market 17 days — a 2% lower offer ($236k) is reasonable based on typical stale-listing flexibility.
- 3 sale attempts; this cycle's ask has dropped $44k (15%) from the opening price — seller is motivated, your offer sets the floor, not the list.
Questions for the listing agent
- What do current leases actually rent for vs. the listed asking? Can we see a recent rent roll and the last 12 months of T-12 income?
- What does the HOA fee cover, when was the last increase, and are there any pending special assessments or reserve-fund shortfalls?
- Is there a deadline driving the sale (1031 exchange, divorce, estate, relocation)? That informs how much negotiation room exists.
- Schools are D-rated, which usually means shorter tenancies and higher turnover. Who's the typical renter profile here, and what's been the actual vacancy rate?
- Crime grade is D in this area — have there been break-ins, vandalism, or insurance claims at this property in the last 3 years? What carrier currently insures it and at what premium?
- The area grade is low — what's the realistic commute time and amenity access for the typical tenant pool here? Any planned neighborhood developments (good or bad) we should know about?
- What's the average days-on-market for RENTAL listings here right now (not sales)? A rising rental-DOM trend means longer vacancies and softer asking-rent achievability than the comps imply.
- What's the recent tenant-quality profile in this submarket — average credit score on applications, eviction rate, late-payment / NSF rate, and stable-employment percentage? A property-management company in the area should have these aggregated.
- How much new for-sale + rental construction is in the pipeline within 1–3 miles? Heavy new supply typically softens prices + rents 12–24 months out; constrained supply supports both.
Investment metrics
- 1% rule
- 0.79% ✗
- Cap rate
- 5.33%
- Cash-on-cash
- -3.43%
- DSCR
- 0.85
- GRM
- 10.6
CMA / ARV
- ARV (on-the-fly)
- $261,392
- Comps found
- 12
Show comp detail 12 sales within ~0.75 mi
| Address | Dist | Beds/Ba | Sqft | Sold | Price | $/sf | Match |
|---|---|---|---|---|---|---|---|
| 220 Lantana Ln | 0.08mi | 4/2.5 | 1,922 (0%) | 1mo | $285,990 | $149 | 96 |
| 606 Monarch Trl | 0.01mi | 4/2.0 | 1,716 (-11%) | 1mo | $263,990 | $154 | 79 |
| 406 Monarch Trl | 0.17mi | 4/3.0 | 2,060 (+7%) | 1mo | $266,630 | $129 | 78 |
| 518 Monarch Trl | 0.04mi | 4/2.0 | 1,749 (-9%) | 5mo | $234,999 | $134 | 77 |
| 102 Lantana Ln | 0.11mi | 4/2.0 | 1,751 (-9%) | 1mo | $239,999 | $137 | 77 |
| 511 Monarch Trl | 0.06mi | 4/2.0 | 1,751 (-9%) | 5mo | $237,330 | $136 | 76 |
| 417 Monarch Trl | 0.11mi | 4/2.0 | 1,749 (-9%) | 3mo | $249,080 | $142 | 76 |
| 432 Monarch Trl | 0.10mi | 4/2.0 | 1,749 (-9%) | 5mo | $235,840 | $135 | 74 |
| 410 Monarch Trl | 0.16mi | 4/2.0 | 1,751 (-9%) | 3mo | $239,000 | $136 | 73 |
| 218 Lantana Ln | 0.07mi | 4/2.0 | 1,676 (-13%) | 1mo | $261,990 | $156 | 73 |
| 513 Monarch Trl | 0.05mi | 4/3.0 | 2,192 (+14%) | 5mo | $268,960 | $123 | 68 |
| 422 Monarch Trl | 0.10mi | 4/3.0 | 2,192 (+14%) | 5mo | $249,540 | $114 | 66 |
Match score weights: distance 35% · size 25% · config 20% · recency 20%. Top-matched comps best support the ARV.
Projected returns pro-forma
-3.0% appreciation · 2.89% rent growth · sell at horizon
- IRR
- -22.1%
- Equity multiple
- 0.24×
- Total profit
- $-55,843
- Equity at exit
- $38,974
- IRR
- -16.4%
- Equity multiple
- 0.09×
- Total profit
- $-66,491
- Equity at exit
- $22,600
Cash invested: $73,190 (down + closing). Projections, not guarantees.
Landlord ↔ Tenant lean methodology
- Overall (STATE)
- 87 Strongly Landlord-Friendly
- State Texas
- 87 Strongly Landlord-Friendly · R+5
- County
- — inherits STATE
- City
- — inherits STATE
ZIP-level market 77320
- Home prices YoY
- -33.0%
- Rents YoY
- 2.9%
- Active inventory
- 518
- Price-to-rent
- 9.7×
Monthly cashflow live
- Estimated rent
- $2,064 medium interval (Pro) →
- Mortgage (P&I)
- −$1,371
- Tax est. 1.5%
- −$327 /mo · $3,921/yr
- Insurance
- −$109
- HOA
- −$33
- Vacancy / Maint / Mgmt
- −$433
- Net cashflow
- $-209
Break-even live
UW: 25.0% down · 7.5% · 30yr · 1.5% tax · 5.0% vac · 8.0% maint · 8.0% mgmt
Financing live
Cash to close
- Down payment
- $65,348
- Closing costs
- $7,842
- Reserves months
- —
- Total cash needed
- —
Loan-product check · same deal, 3 products live
Conventional
25% down · 7.5% · 30yr
- Down + closing
- —
- Monthly P&I
- —
- Monthly cashflow
- —
- DSCR
- —
- Eligible?
- —
Personal DTI + credit; lowest rate.
DSCR
20% down · 8.5% · 30yr
- Down + closing
- —
- Monthly P&I
- —
- Monthly cashflow
- —
- DSCR
- —
- Eligible?
- —
No personal income docs; deal must DSCR.
Hard money
10% down · 12.0% · 12mo
- Down + closing
- —
- Monthly P&I
- —
- Monthly cashflow
- —
- DSCR
- —
- Eligible?
- —
Short-term bridge; refi at stabilization.
Rent comps 2 comps
| Address | Beds | Baths | Sqft | Rent | $/sqft | DOM | Units | Dist |
|---|---|---|---|---|---|---|---|---|
| 3272 State Highway 30 Huntsville, TX | 1.0–3.0 | 1.0–2.0 | 1070 | $2,085 | $1.95 | 43d | 20 | 0.33mi |
| 149 Col Etheredge Blvd Huntsville, TX | 1.0–3.0 | 1.0–3.0 | 993 | $1,710 | $1.72 | 43d | 9 | 0.85mi |
HOA detail
- Monthly dues
- $33 · $396/yr
Listing history 22 events
-
2026-06-19days on market $239,990 Active 17 DOM
-
2026-06-18days on market $239,990 Active 16 DOM
-
2026-06-17days on market $239,990 Active 15 DOM
-
2026-06-16days on market $239,990 Active 14 DOM
-
2026-06-15days on market $239,990 Active 13 DOM
-
2026-06-14days on market $239,990 Active 11 DOM
-
2026-06-13days on market $239,990 Active 10 DOM
-
2026-06-10days on market $239,990 Active 8 DOM
-
2026-06-09days on market $239,990 Active 7 DOM
-
2026-06-08days on market $239,990 Active 6 DOM
-
2026-06-07days on market $239,990 Active 5 DOM
-
2026-06-05days on market $239,990 Active 2 DOM
-
2026-06-03remarks 613-char remark
-
2026-06-03days on market $239,990 Active 1 DOM
-
2026-06-02days on market $239,990 Active 26 DOM
-
2026-06-01days on market $239,990 Active 25 DOM
-
2026-05-31days on market $239,990 Active 24 DOM
-
2026-05-30days on market $239,990 Active 23 DOM
-
2026-05-15historical
-
2026-05-07$239,990 Active 430-char remark
-
2026-05-04price $239,990
-
2026-04-29$223,640 Active
ⓘ Source: listings_history table (triggers on properties + properties_extension) + one-shot
backfill from property_details.listing_events for pre-trigger history.
Nearby sold comps map
Loading sold comps map…
Walkable amenities ~0.75 mi
Loading nearby amenities…
Taxation est. · year 1
- Rental income
- $24,766
- − Mortgage interest
- −$14,642
- − Property taxes
- −$3,921
- − Insurance
- −$1,307
- − Repairs & maintenance
- −$1,981
- − Management
- −$1,981
- − HOA
- −$396
- − Depreciation
- −$7,604
- Taxable loss
- −$7,066
- Est. tax savings @ 24.0%
- +$1,696
- After-tax cash flow
- $-812/yr
For passive investors: Depreciation is non-cash, so a rental often shows a tax loss while cash-flowing — sheltering income. Rental losses are passive: they offset passive income freely, and up to $25,000/yr can offset ordinary (W-2) income if you actively participate and your MAGI is under $100k (phasing out to $0 by $150k); unused losses carry forward. On sale, claimed depreciation is recaptured at up to 25%, and gains may owe capital-gains tax (a 1031 exchange can defer both). Figures are a year-1 estimate at your 24.0% rate — not tax advice; consult a CPA.
Condition & rehab AI · 12 photos
This two-story home features a modern kitchen, spacious living areas, and a well-maintained exterior. It is in good condition with minor cosmetic improvements needed to maximize its value.
Value-add opportunities
- Both Paint exterior trim — Enhances curb appeal and can increase both resale and rental value.
- Both Clean gutters — Keeps the home looking well-maintained and can prevent water damage
Renovation cost estimate screening
Value-add ROI direction
- Both Paint exterior trim — Enhances curb appeal and can increase both resale and rental value. ↑
- Both Clean gutters — Keeps the home looking well-maintained and can prevent water damage ↑
ⓘ Cost ranges are severity-bucket heuristics (US national rule-of-thumb). Get contractor quotes + a written scope before underwriting a rehab budget.
Schools (NCES district)
- District
- Huntsville ISD
- NCES district ID
- 4824030
- Math proficiency
- 25% ▼ -6.00%
- Reading proficiency
- 37% ▼ -2.00%
- Median HH income
- $36,597
- Composite
- 25.71/100
- National rank
- #7383
- State rank
- #621 of 826 in TX
Livability — Huntsville
- Score
- 63/100
- State rank
- #825
- US rank
- #14909
Category grades
Schools grade is shown separately in the Schools card above.
Census & demographics
- Census place
- Huntsville, TX
- County
- Walker County · 75,669 people
- City population
- 75,669
- Metro
- Huntsville, TX
- Population (ZIP)
- 38,152
- Household income
- $55,663
- Rent vs Own
- Severe rent burden
- 1030.0
Population outlook (Walker County) Hauer SSP2
- Today (2025)
- 77,602 people
- By 2030
- 82,007 · +5.7%
- By 2040
- 90,436 · +16.5%
- By 2050
- 100,240 · +29.2%
- By 2075
- 123,667 · +59.4%
- By 2100
- 135,073 · +74.1%
Race, ethnicity, and origin ACS 2023
- Neighborhood character
- Diverse neighborhood (Simpson 0.64)
- Race & ethnicity
- White 50% Hispanic / Latino 26% Black 21% Two or more races 15%
- Hispanic origin (detail)
- Mexican 20%
- Common ancestry
- Lithuanian 2% Italian 2% Slovak 2%
- Foreign-born
- 9% · Canada, Vietnam
- Languages at home
- 79% English-only · Spanish 19%
Political lean MEDSL · Walker
- 2024 margin
- Solid R (+40.0) · D 29.6% · R 69.6%
- 2008→2024 swing
- -17.6pp toward R · 2008: -22.4pp · 2024: -40.0pp
- All cycles
- 2024: R+40.0 2020: R+31.7 2016: R+34.5 2012: R+28.4 2008: R+22.4
Not yet ingested
- Civics
- —
Market trends
- HPI YoY
- ▼ -93.48%
- Current HPI
- 190.199
- Rent YoY
- ▲ 2.89%
- Metro
- Huntsville, TX
- State GDP YoY
- ▲ 3.95%
- F500 in state
- 110
Industry mix (Fortune 500 HQ in TX)
| Industry | F500 HQs | Revenue |
|---|---|---|
| Energy | 16 | $1,198B |
|
||
| Technology | 5 | $198B |
|
||
| Engineering / Construction | 4 | $72B |
|
||
| Energy Services | 3 | $60B |
|
||
| Utilities | 3 | $41B |
|
||
| Healthcare | 2 | $330B |
|
||
Price history
+27.0% since first listed6 events — show timeline
- 2026-06-02 Listed $283,990 HARMLS
- 2026-06-02 Listing Removed — HARMLS
- 2026-06-02 Listed $239,990 HARMLS
- 2026-05-15 Listing Removed — HARMLS
- 2026-05-04 Price Changed $239,990 HARMLS
- 2026-04-29 Listed $223,640 HARMLS
Cash-flow waterfall
monthlySold comps — $/sqft
last 12 mo · ≤1 miLoading sold comps…