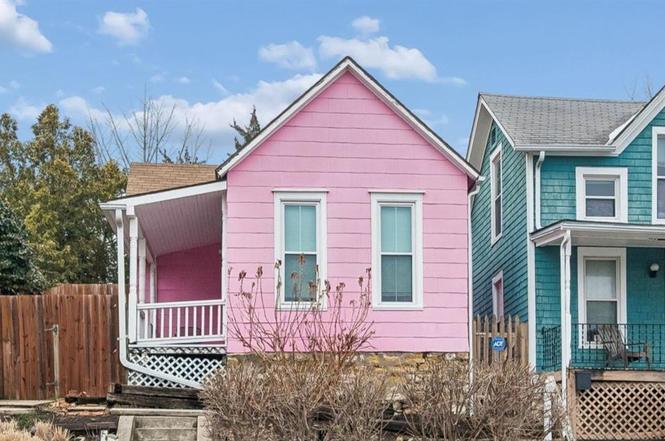
2518 Charlotte St · Kansas City, MO
Flood risk 1/10 · Minimal
- FEMA flood zone
- X (unshaded)
- Chance of flooding over 30 yrs
- 0.0%
- Est. flood insurance / yr
- $507 – $1,088
Fire risk 1/10 · Minimal
- Est. fire insurance / yr
- $1,054 – $1,958
Heat risk 4/10 · Minor
- Hot days now (above 106°F)
- 7 days/yr
- Hot days in 30 yrs
- 17 days/yr
Wind risk 2/10 · Minimal
- Chance of severe wind over 30 yrs
- —
Air-quality risk 3/10 · Minor
- Unhealthy air days now
- 2 days/yr
- Unhealthy air days in 30 yrs
- 3 days/yr
Risk factors via First Street. Map © Google.
Why this score? — see what drove the D+ grade
The composite is a weighted blend of 9 inputs, each scored 0–100. Each bar is that input's sub-score; the figure is the points it added to the 100-point composite (weight × sub-score).
- Cash flow +19.0/30.0
- ARV discount +7.5/15.0
- DSCR +6.0/10.0
- 1% rule +4.3/10.0
- Livability +3.9/5.0
- Rent growth +2.6/5.0
- Condition / age +2.5/5.0
- Schools +1.5/10.0
- Appreciation +0.0/10.0
$161,500
🖨 Deal sheet (PDF) 📄 Offer letter ✓ Due diligence
Listing remarks
Looking for an investment opportunity in the heart of Kansas City's Hospital Hill area? This charming 2-bedroom, 1-bath home offers the convenience of single-floor living and incredible potential just minutes from the UMKC School of Medicine and a short distance from the proposed new downtown professional baseball stadium. Inside, you'll find a spacious living room filled with natural light, while outside a large deck provides the perfect space for relaxing or entertaining. Conveniently located near hospitals, shopping, restaurants, and entertainment, this property is ideal as a primary residence, rental investment, or housing for medical students and professionals. Don't miss this opportun
Key facts
- Large deck
- Near hospitals
- Near shopping
Tags
Property features AI
Exterior
- Parking: Other parking
- Utilities: Public water; Public sewer
- Home design: Single-family residence; Residential property; Ranch style; Living area reported as 784
- Construction: Frame construction with shingle siding; Composition roof
- Exterior features: Deck; Porch; Partial fencing; Not in a flood plain
Interior
- Kitchen: Gas range; Microwave; Refrigerator; Dishwasher
- Bedrooms: 2 bedrooms (both on the first level)
- Flooring: Laminate
- Bathrooms: 1 full bathroom with shower-over-tub (first level)
- Heating & cooling: Natural gas heating; Electric cooling (has cooling)
- Interior features: Ceiling fan(s); 6 total rooms; Ranch floor plan
- Laundry & utility: Washer and dryer included; Laundry located off the kitchen on the bedroom level
Neighborhood map
What this means for you Summary
Snapshot
- This is a 2-bed/1.0-bath single-family listed at $162k.
Deal economics
- At list price, monthly cash flow is $169 ($2k/yr) — positive.
- The deal already cash-flows at list — no discount required.
- To meet the 1% rule (rent ≥ 1% of price), the offer needs to be $149k (7.5% below list).
- Recommended offer: $149k (7.5% below list) — sets the bar for 1% rule.
- Cap rate 7.5% vs local median 3.9% in Kansas City — top-decile yield for the area; either an underpriced asset or a hidden risk that comps aren't pricing in. Stress-test before assuming the spread holds.
Location & tenants
- Location reads 78/100 on livability (#28 in MO, #2,671 nationally) — a middle-class / working-renter tenant base. Strengths: amenities A+, commute A+, cost of living A+; Watch: crime F.
- Kansas City 33 (urban): math 12% / reading 24% proficiency, ranked #308 of 324 in MO (top 95%) — low school quality limits family demand, transient renter base, plan for 1-2y turnover; 75% free/reduced lunch — lower-income household profile, screen leases tightly.
- Zoned schools: Ac Prep Elementary (math 12% / reading 27%, grade F, #941 of 1,115 statewide, top 86%, 341 students, 99% FRL); Central Middle School (math 0% / reading 9%, grade F, #388 of 391 statewide, top 99%, 428 students, 99% FRL); Northeast High (math 2% / reading 22%, grade F, #497 of 521 statewide, top 96%, 657 students, 100% FRL) — zoned schools average 99% FRL vs 75% district-wide (24 pts higher); higher-poverty schools than district average — tighter screening recommended.
- Market conditions: Rents flat; 98 active listings in the ZIP; 40 comparable units currently listed for rent nearby; rentals at typical pace (median 19d on market — plan ~3-4 weeks tenant-placement turnaround); solid renter incomes; 4,002 units permitted in Jackson County in 2024 (2,271 in 5+ unit buildings).
Forward outlook
- Local home prices are declining (-3.0%/yr); year-one equity from $1k of loan paydown is wiped out by about $5k of value loss. Plan a longer hold.
- Jackson County population projected at +4% by 2050 — modest demand growth; plan on rents tracking national, not racing it.
Negotiation context
- Only 2 days on market — expect competitive offers; lowballing is unlikely to land.
Risks & watch-outs
- Watch-outs: built in 1880 — expect roof / HVAC / electrical / plumbing capex.
Questions for the listing agent
- Built in 1880 — when were the roof, HVAC, electrical panel, plumbing, and water heater last replaced?
- Is there a deadline driving the sale (1031 exchange, divorce, estate, relocation)? That informs how much negotiation room exists.
- Crime grade is F in this area — have there been break-ins, vandalism, or insurance claims at this property in the last 3 years? What carrier currently insures it and at what premium?
- The area grade is low — what's the realistic commute time and amenity access for the typical tenant pool here? Any planned neighborhood developments (good or bad) we should know about?
- What's the average days-on-market for RENTAL listings here right now (not sales)? A rising rental-DOM trend means longer vacancies and softer asking-rent achievability than the comps imply.
- What's the recent tenant-quality profile in this submarket — average credit score on applications, eviction rate, late-payment / NSF rate, and stable-employment percentage? A property-management company in the area should have these aggregated.
- How much new for-sale + rental construction is in the pipeline within 1–3 miles? Heavy new supply typically softens prices + rents 12–24 months out; constrained supply supports both.
Investment metrics
- 1% rule
- 0.93% ✗
- Cap rate
- 7.55%
- Cash-on-cash
- 4.48%
- DSCR
- 1.20
- GRM
- 9.0
CMA / ARV
- ARV (on-the-fly)
- $37,632
- Comps found
- 1
Show comp detail 1 sale within ~0.75 mi
| Address | Dist | Beds/Ba | Sqft | Sold | Price | $/sf | Match |
|---|---|---|---|---|---|---|---|
| 2524 Woodland Ave | 0.72mi | 2/1.0 | 764 (-3%) | 20mo | $36,500 | $48 | 45 |
Match score weights: distance 35% · size 25% · config 20% · recency 20%. Top-matched comps best support the ARV.
Projected returns pro-forma
-3.0% appreciation · 0.44% rent growth · sell at horizon
- IRR
- -12.0%
- Equity multiple
- 0.58×
- Total profit
- $-19,208
- Equity at exit
- $24,080
- IRR
- -6.9%
- Equity multiple
- 0.61×
- Total profit
- $-17,675
- Equity at exit
- $13,964
Cash invested: $45,220 (down + closing). Projections, not guarantees.
Landlord ↔ Tenant lean methodology
- Overall (STATE)
- 81 Strongly Landlord-Friendly
- State Missouri
- 81 Strongly Landlord-Friendly · R+10
- County
- — inherits STATE
- City
- — inherits STATE
ZIP-level market 64108
- Home prices YoY
- -25.2%
- Rents YoY
- 0.4%
- Active inventory
- 98
- Price-to-rent
- 9.0×
Monthly cashflow live
- Estimated rent
- $1,494 high interval (Pro) →
- Mortgage (P&I)
- −$847
- Tax from tax record
- −$97 /mo · $1,168/yr
- Insurance
- −$67
- HOA
- −$0
- Lot rent
- −$0
- Vacancy / Maint / Mgmt
- −$314
- Net cashflow
- $169
Break-even live
Sensitivity live
| Price | -10% $260 | -5% $215 | +0% $169 | +5% $123 | +10% $77 |
|---|---|---|---|---|---|
| Rent | -10% $51 | -5% $110 | +0% $169 | +5% $228 | +10% $287 |
| Rate | -1.0pp $250 | -0.5pp $210 | base $169 | +0.5pp $127 | +1.0pp $84 |
UW: 25.0% down · 7.5% · 30yr · 1.5% tax · 5.0% vac · 8.0% maint · 8.0% mgmt
Financing live
Cash to close
- Down payment
- $40,375
- Closing costs
- $4,845
- Reserves months
- —
- Total cash needed
- —
Loan-product check · same deal, 3 products live
Conventional
25% down · 7.5% · 30yr
- Down + closing
- —
- Monthly P&I
- —
- Monthly cashflow
- —
- DSCR
- —
- Eligible?
- —
Personal DTI + credit; lowest rate.
DSCR
20% down · 8.5% · 30yr
- Down + closing
- —
- Monthly P&I
- —
- Monthly cashflow
- —
- DSCR
- —
- Eligible?
- —
No personal income docs; deal must DSCR.
Hard money
10% down · 12.0% · 12mo
- Down + closing
- —
- Monthly P&I
- —
- Monthly cashflow
- —
- DSCR
- —
- Eligible?
- —
Short-term bridge; refi at stabilization.
Rent comps 40 comps
| Address | Beds | Baths | Sqft | Rent | $/sqft | DOM | Units | Dist |
|---|---|---|---|---|---|---|---|---|
| 2543 Cherry St Unit 1 Kansas City, MO | 2.0 | 1.0 | 975 | $1,302 | $1.34 | 0d | 1 | 0.13mi |
| 2543 Cherry St Apt 3 Kansas City, MO | 2.0 | 1.0 | 975 | $1,402 | $1.44 | 46d | 1 | 0.13mi |
| 2501 Troost Ave Kansas City, MO | 2.0 | 1.0–2.0 | 984 | $2,679 | $2.72 | 46d | 15 | 0.24mi |
| 2710 Holmes St Unit 3S Kansas City, MO | 1.0 | 1.0 | 670 | $1,095 | $1.63 | 10d | 1 | 0.25mi |
| 2727 Campbell St Unit 2727-1SW Kansas City, MO | 2.0 | 1.0 | 1000 | $1,250 | $1.25 | 10d | 1 | 0.29mi |
| 2725 Campbell St Unit 2725-1 NE Kansas City, MO | 2.0 | 1.0 | 1000 | $1,250 | $1.25 | 46d | 1 | 0.30mi |
| 2732 Charlotte St Kansas City, MO | 1.0 | 1.0 | 600 | $950 | $1.58 | 5d | 1 | 0.32mi |
| 2732 Charlotte St Kansas City, MO | 1.0 | 1.0 | 600 | $950 | $1.58 | 46d | 1 | 0.32mi |
| 2705 McGee Trfy Kansas City, MO | 3.0 | 1.0–2.0 | 1000 | $2,339 | $2.34 | 0d | 15 | 0.38mi |
| 901 E 28th St Kansas City, MO | 1.0 | 1.0 | 900 | $947 | $1.05 | 18d | 1 | 0.38mi |
| 2821 Charlotte St Unit 2n Kansas City, MO | 2.0 | 1.0 | 935 | $1,195 | $1.28 | 46d | 1 | 0.44mi |
| 2525 Main St #704 Kansas City, MO | 1.0 | 1.0 | 631 | $1,350 | $2.14 | 13d | 1 | 0.47mi |
| 2903 Cherry St Kansas City, MO | 1.0 | 1.0 | 743 | $1,500 | $2.02 | 10d | 2 | 0.50mi |
| 2903 Cherry St Unit 607 Kansas City, MO | 1.0 | 1.0 | 743 | $1,500 | $2.02 | 14d | 1 | 0.50mi |
| 2903 Cherry St Unit 611 Kansas City, MO | 1.0 | 1.0 | 743 | $1,500 | $2.02 | 22d | 1 | 0.50mi |
| 2911 Cherry St Kansas City, MO | 1.0 | 1.0 | 743 | $1,255 | $1.69 | 46d | 1 | 0.51mi |
| 2915 Cherry St Kansas City, MO | 1.0–2.0 | 1.0–2.0 | 995 | $1,625 | $1.63 | 46d | 7 | 0.51mi |
| 2107 Grand Blvd Kansas City, MO | 1.0 | 1.0 | 616 | $1,590 | $2.58 | 46d | 1 | 0.57mi |
| 2107 Grand Blvd #903 Kansas City, MO | 1.0 | 1.0 | 920 | $1,500 | $1.63 | 23d | 1 | 0.57mi |
| 2107 Grand Blvd #1207 Kansas City, MO | 1.0 | 1.5 | 900 | $2,250 | $2.50 | 10d | 1 | 0.57mi |
| 2029 Grand Blvd Kansas City, MO | 1.0 | 1.0 | 706 | $1,400 | $1.98 | 46d | 1 | 0.58mi |
| 104 E 28 Ter Kansas City, MO | 1.0–2.0 | 1.0–2.5 | 1087 | $2,699 | $2.48 | 0d | 11 | 0.59mi |
| 103 E 28 Ter Kansas City, MO | 1.0 | 1.0 | 1050 | $1,886 | $1.80 | 0d | 1 | 0.61mi |
| 103 E 28 Ter Kansas City, MO | 2.0 | 2.0 | 980 | $1,979 | $2.02 | 46d | 1 | 0.61mi |
| 1108 E 30th St Unit St301 Kansas City, MO | 1.0 | 1.0 | 830 | $1,095 | $1.32 | 46d | 1 | 0.62mi |
| 1918 Locust St Kansas City, MO | 2.0 | 1.0–2.0 | 734 | $1,943 | $2.65 | 0d | 28 | 0.62mi |
| 217 W Pershing Rd Kansas City, MO | 1.0 | 1.0 | 743 | $1,841 | $2.48 | 0d | 1 | 0.66mi |
| 217 W Pershing Rd Kansas City, MO | 1.0 | 1.0 | 662 | $1,764 | $2.66 | 26d | 1 | 0.66mi |
| 3035 Harrison St Kansas City, MO | 1.0–2.0 | 1.0 | 725 | $1,250 | $1.72 | 5d | 1 | 0.70mi |
| 2538 Woodland Ave Unit 2B Kansas City, MO | 2.0 | 1.0 | 850 | $950 | $1.12 | 23d | 1 | 0.71mi |
| 1500 E 29th St Kansas City, MO | 1.0 | 1.0 | 650 | $895 | $1.38 | 10d | 1 | 0.72mi |
| 3022 McGee St Kansas City, MO | 1.0 | 1.0 | 700 | $945 | $1.35 | 46d | 1 | 0.74mi |
| 2101 Vine St Kansas City, MO | 1.0–2.0 | 1.0 | 942 | $1,499 | $1.59 | 18d | 1 | 0.74mi |
| 1989 Main St Kansas City, MO | 2.0 | 1.0–2.0 | 770 | $2,465 | $3.20 | 0d | 16 | 0.74mi |
| 105 E 30th St Unit 1C Kansas City, MO | 1.0 | 1.0 | 700 | $850 | $1.21 | 19d | 1 | 0.75mi |
| 3100 Gillham Plz Kansas City, MO | 1.0 | 1.0 | 568 | $1,125 | $1.98 | 22d | 1 | 0.75mi |
| 311 W 22nd St Kansas City, MO | 3.0 | 1.0–2.0 | 1009 | $3,319 | $3.29 | 0d | 59 | 0.75mi |
| 3014 Grand Ave Unit 3S Kansas City, MO | 1.0 | 1.0 | 900 | $1,150 | $1.28 | 46d | 1 | 0.76mi |
| 2938 Flora Ave Unit 1s Kansas City, MO | 2.0 | 1.0 | 795 | $875 | $1.10 | 0d | 1 | 0.77mi |
| 2938 Flora Ave Unit 1s Kansas City, MO | 2.0 | 1.0 | 795 | $875 | $1.10 | 6d | 1 | 0.77mi |
Listing history 3 events
-
2026-06-22days on market $161,500 Coming Soon 2 DOM
-
2026-06-21remarks 699-char remark
-
2026-06-21$161,500 Coming Soon 1 DOM
ⓘ Source: listings_history table (triggers on properties + properties_extension) + one-shot
backfill from property_details.listing_events for pre-trigger history.
Tax reassessment forecast MO · Resets to sale price
- Current annual tax
- $1,168 · $97/mo
- Projected year-2 tax
- $1,567 · $131/mo
- Expected delta
- +$399/yr (+$33/mo · 34.2%)
ⓘ Screening estimate from a state-policy table — verify with the county assessor before closing.
Climate risk First Street
- Flood 1/10 Low FEMA zone X (unshaded) · 0% chance over 30 yrs
- Wildfire 1/10 Low
- Heat 4/10 Moderate 7 d/yr ≥106°F today · 17 d/yr by 30 yrs out
- Wind 2/10 Low
- Air quality 3/10 Moderate 2 unhealthy d/yr today · 3 by 30 yrs out
Nearby sold comps map
Loading sold comps map…
Walkable amenities ~0.75 mi
Loading nearby amenities…
Taxation est. · year 1
- Rental income
- $17,930
- − Mortgage interest
- −$9,047
- − Property taxes
- −$1,168
- − Insurance
- −$808
- − Repairs & maintenance
- −$1,434
- − Management
- −$1,434
- − Depreciation
- −$4,698
- Taxable loss
- −$659
- Est. tax savings @ 24.0%
- +$158
- After-tax cash flow
- $2,185/yr
For passive investors: Depreciation is non-cash, so a rental often shows a tax loss while cash-flowing — sheltering income. Rental losses are passive: they offset passive income freely, and up to $25,000/yr can offset ordinary (W-2) income if you actively participate and your MAGI is under $100k (phasing out to $0 by $150k); unused losses carry forward. On sale, claimed depreciation is recaptured at up to 25%, and gains may owe capital-gains tax (a 1031 exchange can defer both). Figures are a year-1 estimate at your 24.0% rate — not tax advice; consult a CPA.
Schools (NCES district)
- District
- Kansas City 33
- NCES district ID
- 2916400
- Math proficiency
- 12% ▼ -8.00%
- Reading proficiency
- 24% ▬ 0.00%
- Median HH income
- $35,227
- Composite
- 14.8/100
- National rank
- #9387
- State rank
- #308 of 324 in MO
Livability — Kansas City
- Score
- 78/100
- State rank
- #28
- US rank
- #2671
Category grades
Schools grade is shown separately in the Schools card above.
Census & demographics
- Census place
- Kansas City, MO
- County
- Jackson County · 687,798 people
- City population
- 439,467
- Metro
- Kansas City, MO-KS
- Population (ZIP)
- 10,495
- Household income
- $80,551
- Rent vs Own
- Severe rent burden
- 864.0
Population outlook (Jackson County) Hauer SSP2
- Today (2025)
- 719,589 people
- By 2030
- 731,456 · +1.6%
- By 2040
- 746,689 · +3.8%
- By 2050
- 749,289 · +4.1%
- By 2075
- 736,227 · +2.3%
- By 2100
- 668,210 · -7.1%
Race, ethnicity, and origin ACS 2023
- Neighborhood character
- Diverse neighborhood (Simpson 0.65)
- Race & ethnicity
- White 50% Black 26% Hispanic / Latino 17% Two or more races 12% Asian 3%
- Hispanic origin (detail)
- Mexican 15%
- Common ancestry
- Italian 2% Lithuanian 2% Slovak 1%
- Foreign-born
- 6% · Canada
- Languages at home
- 88% English-only · Spanish 9% Arabic 1% French/Haitian/Cajun 1%
Political lean MEDSL · Jackson
- 2024 margin
- D (+19.3) · D 58.9% · R 39.5% · Other 1.6%
- 2008→2024 swing
- -6.1pp toward R · 2008: 25.4pp · 2024: 19.3pp
- All cycles
- 2024: D+19.3 2020: D+22.0 2016: D+16.6 2012: D+19.0 2008: D+25.4
Not yet ingested
- Civics
- —
Market trends
- HPI YoY
- ▼ -91.93%
- Current HPI
- 273.3599
- Rent YoY
- ▲ 0.44%
- Metro
- Kansas City, MO-KS
- State GDP YoY
- ▲ 1.84%
- F500 in state
- 20
Industry mix (Fortune 500 HQ in MO)
| Industry | F500 HQs | Revenue |
|---|---|---|
| Healthcare | 1 | $163B |
|
||
| Insurance | 1 | $21B |
|
||
| Industrial Technology | 1 | $17B |
|
||
| Retail | 1 | $16B |
|
||
| Industrial Distribution | 1 | $10B |
|
||
| Utilities | 1 | $9B |
|
||
Price history
2 events — show timeline
- 2026-06-21 Coming Soon $161,500 Heartland MLS as Distributed by MLS Grid
- 1995-12-18 Sold (Public Records) — Public Records
Property tax history
+0.6%/yrLatest (2017): $1,168 · +2.1% YoY. Source: county tax records.
Cash-flow waterfall
monthlySold comps — $/sqft
last 12 mo · ≤1 miLoading sold comps…