3411 S Camino Seco -- #351 · Tucson, AZ
Flood risk 1/10 · Minimal
- FEMA flood zone
- X (unshaded)
- Chance of flooding over 30 yrs
- 0.0%
- Est. flood insurance / yr
- $507 – $1,088
Fire risk 5/10 · Moderate
- Est. fire insurance / yr
- $610 – $1,132
Heat risk 7/10 · Major
- Hot days now (above 104°F)
- 6 days/yr
- Hot days in 30 yrs
- 15 days/yr
Wind risk 1/10 · Minimal
- Chance of severe wind over 30 yrs
- —
Air-quality risk 1/10 · Minimal
- Unhealthy air days now
- 0 days/yr
- Unhealthy air days in 30 yrs
- 0 days/yr
Risk factors via First Street. Map © Google.
Why this score? — see what drove the D grade
The composite is a weighted blend of 9 inputs, each scored 0–100. Each bar is that input's sub-score; the figure is the points it added to the 100-point composite (weight × sub-score).
- Cash flow +15.0/30.0
- ARV discount +7.5/15.0
- 1% rule +5.0/10.0
- DSCR +5.0/10.0
- Livability +3.7/5.0
- Rent growth +2.5/5.0
- Condition / age +2.5/5.0
- Schools +1.6/10.0
- Appreciation +0.0/10.0
$25,000
🖨 Deal sheet 📄 Offer letter ✓ Due diligence
Listing remarks MLS
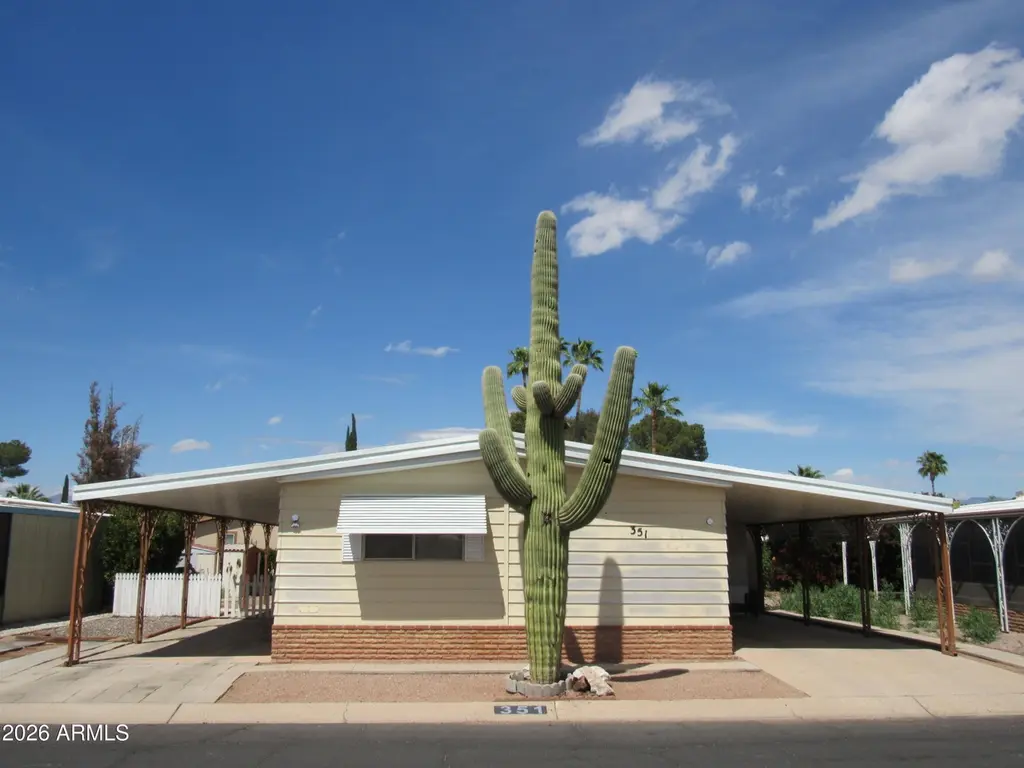
The iconic saguaro stands guard outside of this large three-bedroom, double-wide home on the main boulevard of the park. It has a large living space between bedrooms which are situated at either end of home. Warm laminate floors and large windows let in beautiful light from all angles. Finished walls. Screened porch off kitchen and three sheds, one with electricity. 2 linen closets outside the two bedrooms at northern end of home. 3 vents available for portable air conditioning. Charming white fencing on large lot. Large kitchen with ample storage along with large pantry.
Key facts
- Linen closets
- Large kitchen
- Screened porch
Tags
Neighborhood map
What this means for you Summary
Snapshot
- This is a 3-bed/2.0-bath manufactured listed at $25k.
Deal economics
- At list price, monthly cash flow is $578 ($7k/yr) — positive.
- The deal already cash-flows at list — no discount required.
- Meets the 1% rule at list price ($2k rent vs $25k).
- Recommended offer: $24k (3.0% below list) — sets the bar for market timing.
- Cap rate 34.0% vs local median 3.7% in Tucson — top-decile yield for the area; either an underpriced asset or a hidden risk that comps aren't pricing in. Stress-test before assuming the spread holds.
Location & tenants
- Location reads 74/100 on livability (#17 in AZ, #4,502 nationally) — a middle-class / working-renter tenant base. Strengths: commute A+, cost of living A+, housing A+; Watch: health & safety C-, schools D+, crime F.
- Tucson Unified District (4403) (urban): math 14% / reading 23% proficiency, ranked #190 of 249 in AZ (top 76%) — low school quality limits family demand, transient renter base, plan for 1-2y turnover.
- Market conditions: Rents soft (-0.2%/yr); 194 active listings in the ZIP; 40 comparable units currently listed for rent nearby; rentals at typical pace (median 24d on market — plan ~3-4 weeks tenant-placement turnaround); 5,268 units permitted in Pima County in 2024 (996 in 5+ unit buildings).
- This rent runs 37% of the median local income ($62k/yr) — at the standard rent-burdened threshold; future hikes will face affordability resistance.
Forward outlook
- Local home prices are declining (-3.0%/yr); year-one equity from $173 of loan paydown is wiped out by about $750 of value loss. Plan a longer hold.
- Pima County population projected at +8% by 2050 — modest demand growth; plan on rents tracking national, not racing it.
- At projected returns (-3.0% appreciation + 0.0% rent growth), your $7k cash investment doubles in ~2 years — after that, you're playing with house money.
Negotiation context
- It's been on market 50 days — a 3% lower offer ($24k) is reasonable based on typical stale-listing flexibility.
Risks & watch-outs
- Watch-outs: HOA is 39% of rent.
- Climate carrying-cost: moderate wildfire risk; extreme-heat days projected 6→15/yr by 2055 (HVAC capex compounding) — expect insurance premiums to compound above CPI over the hold.
Questions for the listing agent
- It's been on market 50 days. Have you received any prior offers? Is the seller open to a 3% concession, seller financing, or rate buy-down credit?
- Built in 1972 — when were the roof, HVAC, electrical panel, plumbing, and water heater last replaced?
- What does the HOA fee cover, when was the last increase, and are there any pending special assessments or reserve-fund shortfalls?
- Is there a deadline driving the sale (1031 exchange, divorce, estate, relocation)? That informs how much negotiation room exists.
- Schools are D-rated, which usually means shorter tenancies and higher turnover. Who's the typical renter profile here, and what's been the actual vacancy rate?
- Crime grade is F in this area — have there been break-ins, vandalism, or insurance claims at this property in the last 3 years? What carrier currently insures it and at what premium?
- The area grade is low — what's the realistic commute time and amenity access for the typical tenant pool here? Any planned neighborhood developments (good or bad) we should know about?
- What's the average days-on-market for RENTAL listings here right now (not sales)? A rising rental-DOM trend means longer vacancies and softer asking-rent achievability than the comps imply.
- What's the recent tenant-quality profile in this submarket — average credit score on applications, eviction rate, late-payment / NSF rate, and stable-employment percentage? A property-management company in the area should have these aggregated.
- How much new for-sale + rental construction is in the pipeline within 1–3 miles? Heavy new supply typically softens prices + rents 12–24 months out; constrained supply supports both.
Investment metrics
- 1% rule
- 7.59% ✓
- Cap rate
- 34.03%
- Cash-on-cash
- 99.07%
- DSCR
- 5.41
- GRM
- 1.1
CMA / ARV
- ARV (median comp)
- $136,820
- List price
- $25,000
- Delta
- -81.73%
- Verdict
- UNDERPRICED
- Comps
- 2 within 1.0 mi
Projected returns pro-forma
-3.0% appreciation · 0.0% rent growth · sell at horizon
- IRR
- 93.7%
- Equity multiple
- 4.95×
- Total profit
- $27,684
- Equity at exit
- $3,728
- IRR
- 95.4%
- Equity multiple
- 8.43×
- Total profit
- $51,990
- Equity at exit
- $2,162
Cash invested: $7,000 (down + closing). Projections, not guarantees.
Landlord ↔ Tenant lean methodology
- Overall (STATE)
- 87 Strongly Landlord-Friendly
- State Arizona
- 87 Strongly Landlord-Friendly · R+3
- County
- — inherits STATE
- City
- — inherits STATE
ZIP-level market 85730
- Home prices YoY
- -30.9%
- Rents YoY
- -0.2%
- Active inventory
- 194
- Price-to-rent
- 1.1×
Monthly cashflow live
- Estimated rent
- $1,898 high interval (Pro) →
- Mortgage (P&I)
- −$131
- Tax est. 1.5%
- −$31 /mo · $375/yr
- Insurance
- −$10
- HOA
- −$749
- Vacancy / Maint / Mgmt
- −$399
- Net cashflow
- $578
Break-even live
UW: 25.0% down · 7.5% · 30yr · 1.5% tax · 5.0% vac · 8.0% maint · 8.0% mgmt
Financing live
Cash to close
- Down payment
- $6,250
- Closing costs
- $750
- Reserves months
- —
- Total cash needed
- —
Loan-product check · same deal, 3 products live
Conventional
25% down · 7.5% · 30yr
- Down + closing
- —
- Monthly P&I
- —
- Monthly cashflow
- —
- DSCR
- —
- Eligible?
- —
Personal DTI + credit; lowest rate.
DSCR
20% down · 8.5% · 30yr
- Down + closing
- —
- Monthly P&I
- —
- Monthly cashflow
- —
- DSCR
- —
- Eligible?
- —
No personal income docs; deal must DSCR.
Hard money
10% down · 12.0% · 12mo
- Down + closing
- —
- Monthly P&I
- —
- Monthly cashflow
- —
- DSCR
- —
- Eligible?
- —
Short-term bridge; refi at stabilization.
Rent comps 40 comps
| Address | Beds | Baths | Sqft | Rent | $/sqft | DOM | Units | Dist |
|---|---|---|---|---|---|---|---|---|
| 3455 S Magda Ave Tucson, AZ | 3.0 | 2.0 | 1500 | $2,000 | $1.33 | 43d | 1 | 0.21mi |
| 3292 S Kristina Park Loop Tucson, AZ | 3.0 | 2.0 | 1650 | $2,000 | $1.21 | 23d | 1 | 0.42mi |
| 8467 E Shasta Dr Tucson, AZ | 3.0 | 2.0 | 1618 | $1,725 | $1.07 | 11d | 1 | 0.57mi |
| 4052 S Ferris Dr Tucson, AZ | 4.0 | 2.0 | 1672 | $2,125 | $1.27 | 14d | 1 | 0.57mi |
| 2650 S Brandywine Ln Tucson, AZ | 3.0 | 2.5 | 1340 | $1,500 | $1.12 | 43d | 1 | 0.62mi |
| 9202 E 39th St Tucson, AZ | 3.0 | 2.0 | 1728 | $1,650 | $0.95 | 23d | 1 | 0.65mi |
| 8829 E Eagle Creek Dr Tucson, AZ | 3.0 | 2.0 | 1280 | $1,830 | $1.43 | 15d | 1 | 0.70mi |
| 2618 S Camino Seco Tucson, AZ | 2.0 | 1.5 | 1442 | $1,299 | $0.90 | 23d | 1 | 0.78mi |
| 8905 E Pantano Bluff Dr Tucson, AZ | 3.0 | 2.0 | 2013 | $1,950 | $0.97 | 3d | 1 | 0.78mi |
| 4275 S Mayberry Pl Tucson, AZ | 4.0 | 2.0 | 1672 | $1,850 | $1.11 | 43d | 1 | 0.79mi |
| 4289 S Goodall Pl Tucson, AZ | 3.0 | 2.0 | 1372 | $1,950 | $1.42 | 43d | 1 | 0.82mi |
| 8737 E Pebble Stone Ln Tucson, AZ | 3.0 | 2.0 | 1383 | $2,095 | $1.51 | 43d | 1 | 0.88mi |
| 9172 E Corte Arroyo Oeste Tucson, AZ | 3.0 | 2.0 | 1350 | $1,900 | $1.41 | 3d | 1 | 0.92mi |
| 2342 S Via de Dos Arroyos Tucson, AZ | 3.0 | 2.0 | 1618 | $1,795 | $1.11 | 43d | 1 | 0.92mi |
| 3715 S Escalante Oasis Pl Tucson, AZ | 4.0 | 2.0 | 1601 | $1,900 | $1.19 | 23d | 1 | 0.93mi |
| 4433 S Sunrise Bluff Way Tucson, AZ | 3.0 | 2.0 | 1465 | $1,895 | $1.29 | 23d | 1 | 0.93mi |
| 8250 E Golf Links Rd Tucson, AZ | 1.0–3.0 | 1.0–2.0 | 865 | $1,899 | $2.20 | 1d | 22 | 0.94mi |
| 2217 S Oak Park Dr Tucson, AZ | 3.0 | 2.0 | 1631 | $3,200 | $1.96 | 43d | 1 | 0.95mi |
| 8763 E Pebble Stone Ln Tucson, AZ | 3.0 | 2.0 | 1262 | $1,995 | $1.58 | 3d | 1 | 0.96mi |
| 8315 E Golf Links Rd Tucson, AZ | 3.0 | 2.0 | 1537 | $2,095 | $1.36 | 43d | 2 | 0.97mi |
| 2494 S Clovis Pl Tucson, AZ | 3.0 | 2.0 | 1537 | $2,095 | $1.36 | 43d | 1 | 0.97mi |
| 2461 S Clovis Pl Tucson, AZ | 3.0 | 2.0 | 1537 | $2,095 | $1.36 | 43d | 1 | 0.98mi |
| 8024 E Victoria Dr Tucson, AZ | 3.0 | 2.0 | 1127 | $1,500 | $1.33 | 23d | 1 | 1.00mi |
| 9009 E Kinross Dr Tucson, AZ | 3.0 | 2.0 | 1304 | $1,715 | $1.32 | 21d | 1 | 1.02mi |
| 8755 E Stone Meadow Cir Tucson, AZ | 3.0 | 2.0 | 1465 | $1,925 | $1.31 | 17d | 1 | 1.02mi |
| 8164 E Cricket Song Trl Tucson, AZ | 3.0 | 2.5 | 1704 | $1,750 | $1.03 | 43d | 1 | 1.08mi |
| 3410 S Lakeside Pl Tucson, AZ | 3.0 | 2.0 | 1271 | $1,800 | $1.42 | 23d | 1 | 1.12mi |
| 8061 E Senate St Tucson, AZ | 2.0 | 2.5 | 1298 | $1,700 | $1.31 | 21d | 1 | 1.13mi |
| 2024 S Birdie Cir Tucson, AZ | 3.0 | 2.0 | 1479 | $1,675 | $1.13 | 3d | 1 | 1.16mi |
| 4775 S Wild Rose Dr Tucson, AZ | 3.0 | 2.0 | 1165 | $1,645 | $1.41 | 23d | 1 | 1.17mi |
| 4775 S Wild Rose Dr Tucson, AZ | 3.0 | 2.0 | 1165 | $1,695 | $1.45 | 3d | 1 | 1.17mi |
| 9055 E Alderpoint Way Tucson, AZ | 3.0 | 2.0 | 1165 | $1,695 | $1.45 | 21d | 1 | 1.21mi |
| 3246 S Winona Cir Tucson, AZ | 4.0 | 2.0 | 1655 | $1,830 | $1.11 | 43d | 1 | 1.22mi |
| 9802 E Stella Rd Tucson, AZ | 4.0 | 2.0 | 1416 | $1,945 | $1.37 | 11d | 1 | 1.22mi |
| 9801 E Domenic Ln Tucson, AZ | 3.0 | 2.0 | 1428 | $1,791 | $1.25 | 11d | 1 | 1.24mi |
| 9699 E Vendela St Tucson, AZ | 3.0 | 2.0 | 1165 | $1,800 | $1.55 | 43d | 1 | 1.34mi |
| 7701 E 45th St Tucson, AZ | 3.0 | 2.0 | 1127 | $1,395 | $1.24 | 11d | 1 | 1.38mi |
| 1633 S Augusta Pl Tucson, AZ | 3.0 | 2.0 | 1550 | $2,000 | $1.29 | 2d | 1 | 1.40mi |
| 10002 E Stella Rd Tucson, AZ | 4.0 | 2.0 | 1706 | $2,000 | $1.17 | 23d | 1 | 1.47mi |
| 9960 E Banister Dr Tucson, AZ | 3.0 | 2.0 | 1252 | $1,575 | $1.26 | 43d | 1 | 1.49mi |
HOA detail
- Monthly dues
- $749 · $8,988/yr
- Likely covers
- electric
Listing history 2 events
-
2026-05-02price $25,000 583-char remark
Show marketing remark (583 chars)
The iconic saguaro stands guard outside of this large three-bedroom, double-wide home on the main boulevard of the park. It has a large living space between bedrooms which are situated at either end of home. Warm laminate floors and large windows let in beautiful light from all angles. Finished walls. Screened porch off kitchen and three sheds, one with electricity. 2 linen closets outside the two bedrooms at northern end of home. 3 vents available for portable air conditioning. Charming white fencing on large lot. Large kitchen with ample storage along with large pantry.
-
2026-04-06$25,500 Active 583-char remark
Show marketing remark (583 chars)
The iconic saguaro stands guard outside of this large three-bedroom, double-wide home on the main boulevard of the park. It has a large living space between bedrooms which are situated at either end of home. Warm laminate floors and large windows let in beautiful light from all angles. Finished walls. Screened porch off kitchen and three sheds, one with electricity. 2 linen closets outside the two bedrooms at northern end of home. 3 vents available for portable air conditioning. Charming white fencing on large lot. Large kitchen with ample storage along with large pantry.
ⓘ Source: listings_history table (triggers on properties + properties_extension) + one-shot
backfill from property_details.listing_events for pre-trigger history.
Climate risk First Street
- Flood 1/10 Low FEMA zone X (unshaded) · 0% chance over 30 yrs
- Wildfire 5/10 Major
- Heat 7/10 Severe 6 d/yr ≥104°F today · 15 d/yr by 30 yrs out
- Wind 1/10 Low
- Air quality 1/10 Low 0 unhealthy d/yr today · 0 by 30 yrs out
Nearby sold comps map
Loading sold comps map…
Walkable amenities ~0.75 mi
Loading nearby amenities…
Taxation est. · year 1
- Rental income
- $22,780
- − Mortgage interest
- −$1,400
- − Property taxes
- −$375
- − Insurance
- −$125
- − Repairs & maintenance
- −$1,822
- − Management
- −$1,822
- − HOA
- −$8,988
- − Depreciation
- −$727
- Taxable income
- $7,520
- Est. tax owed @ 24.0%
- −$1,805
- After-tax cash flow
- $5,130/yr
For passive investors: Depreciation is non-cash, so a rental often shows a tax loss while cash-flowing — sheltering income. Rental losses are passive: they offset passive income freely, and up to $25,000/yr can offset ordinary (W-2) income if you actively participate and your MAGI is under $100k (phasing out to $0 by $150k); unused losses carry forward. On sale, claimed depreciation is recaptured at up to 25%, and gains may owe capital-gains tax (a 1031 exchange can defer both). Figures are a year-1 estimate at your 24.0% rate — not tax advice; consult a CPA.
Schools (NCES district)
- District
- Tucson Unified District (4403)
- NCES district ID
- 0408800
- Math proficiency
- 14% ▼ -17.00%
- Reading proficiency
- 23% ▼ -11.00%
- Median HH income
- $40,962
- Composite
- 15.78/100
- National rank
- #9270
- State rank
- #190 of 249 in AZ
Livability — Tucson
- Score
- 74/100
- State rank
- #17
- US rank
- #4502
Category grades
Schools grade is shown separately in the Schools card above.
Census & demographics
- Census place
- Tucson, AZ
- County
- Pima County · 1,012,107 people
- City population
- 839,336
- Metro
- Tucson, AZ
- Population (ZIP)
- 39,399
- Household income
- $62,090
- Rent vs Own
- Severe rent burden
- 1364.0
Population outlook (Pima County) Hauer SSP2
- Today (2025)
- 1,066,056 people
- By 2030
- 1,086,684 · +1.9%
- By 2040
- 1,117,160 · +4.8%
- By 2050
- 1,149,778 · +7.9%
- By 2075
- 1,271,480 · +19.3%
- By 2100
- 1,321,160 · +23.9%
Race, ethnicity, and origin ACS 2023
- Neighborhood character
- Diverse neighborhood (Simpson 0.62)
- Race & ethnicity
- White 53% Hispanic / Latino 31% Two or more races 16% Black 8% Asian 3% Native American 1%
- Hispanic origin (detail)
- Mexican 28%
- Common ancestry
- Romanian 2% Lithuanian 2% Slovak 2%
- Foreign-born
- 8% · Canada, Vietnam
- Languages at home
- 84% English-only · Spanish 13% Vietnamese 1%
Political lean MEDSL · Pima
- 2024 margin
- D (+15.2) · D 57.0% · R 41.8% · Other 1.2%
- 2008→2024 swing
- +9.1pp toward D · 2008: 6.1pp · 2024: 15.2pp
- All cycles
- 2024: D+15.2 2020: D+18.7 2016: D+13.5 2012: D+5.8 2008: D+6.1
Not yet ingested
- Civics
- —
Market trends
- HPI YoY
- ▼ -136.41%
- Current HPI
- 304.999
- Rent YoY
- ▼ -0.16%
- Metro
- Tucson, AZ
- State GDP YoY
- ▲ 4.54%
- F500 in state
- 20
Industry mix (Fortune 500 HQ in AZ)
| Industry | F500 HQs | Revenue |
|---|---|---|
| Technology | 2 | $13B |
|
||
| Mining / Metals | 1 | $23B |
|
||
| Environmental Services | 1 | $16B |
|
||
| Metals / Steel | 1 | $14B |
|
||
| Technology Distribution | 1 | $9B |
|
||
| Homebuilding | 1 | $8B |
|
||
Price history
-2.0% since first listed2 events — show timeline
- 2026-05-02 Price Changed $25,000 ARMLS
- 2026-04-06 Listed $25,500 ARMLS
Cash-flow waterfall
monthlySold comps — $/sqft
last 12 mo · ≤1 miLoading sold comps…