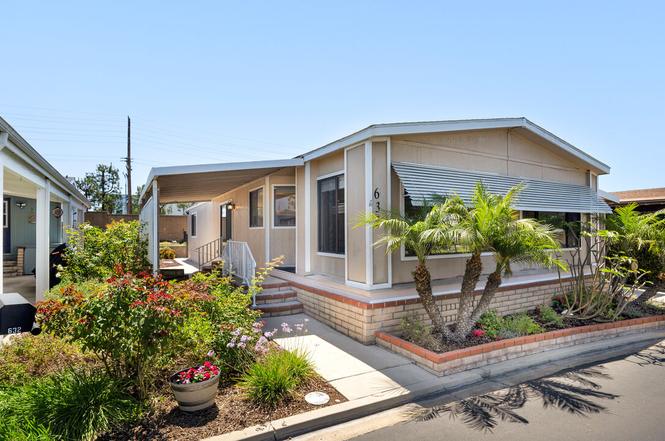
632 Wood Lake Dr · Brea, CA
Flood risk 4/10 · Minor
- FEMA flood zone
- X (unshaded)
- Chance of flooding over 30 yrs
- 0.22%
- Est. flood insurance / yr
- $507 – $1,088
Fire risk 3/10 · Minor
- Est. fire insurance / yr
- $659 – $1,223
Heat risk 6/10 · Moderate
- Hot days now (above 96°F)
- 7 days/yr
- Hot days in 30 yrs
- 22 days/yr
Wind risk 1/10 · Minimal
- Chance of severe wind over 30 yrs
- —
Air-quality risk 5/10 · Moderate
- Unhealthy air days now
- 7 days/yr
- Unhealthy air days in 30 yrs
- 9 days/yr
Risk factors via First Street. Map © Google.
Why this score? — see what drove the B+ grade
The composite is a weighted blend of 9 inputs, each scored 0–100. Each bar is that input's sub-score; the figure is the points it added to the 100-point composite (weight × sub-score).
- Cash flow +30.0/30.0
- ARV discount +14.4/15.0
- DSCR +10.0/10.0
- 1% rule +9.0/10.0
- Schools +5.1/10.0
- Livability +3.8/5.0
- Rent growth +2.9/5.0
- Condition / age +2.5/5.0
- Appreciation +0.0/10.0
$223,000
🖨 Deal sheet 📄 Offer letter ✓ Due diligence
Listing remarks
There's a special kind of calm that settles over Lake Park in the early morning; it could look like savoring a cup of coffee on your porch, enjoying the views of the lake, or exploring the lovingly maintained greenbelt before the day has the chance to ask a single thing of you. That's the life that comes with 632 Wood Lake Drive. This 2-bedroom, 2-bathroom home sits in one of Brea's most beloved 55+ communities, just steps from the lake and tucked into a spot that's equal parts peaceful and convenient before you even step inside. You're close to guest parking, close to the water, and have access to everything that makes Lake Park feel like a treasured community. Inside, beamed ceilings give
Key facts
- Lake views
- Beamed ceilings
- Soaking tub
Tags
Property features AI
Finance
- Other: Community contains 342 units; Park entry directions: Enter the park from Puente St and turn left at first stop sign; property will be on the left
- Financial info: Annual land lease applies
- HOA & community: Community amenities include clubhouse, fitness center/exercise room, billiard room, pool, spa, tennis courts, pickleball, guest parking, and a lake/pond; Pets permitted per association rules
Exterior
- Parking: Carport (attached); Covered parking for 2 vehicles; Tandem parking; Onsite guest parking
- Utilities: Property is leased (land lease); Manager approval required for lease
- Home design: Residential mobile home (doublewide); Single-story; Faces west; Located in a senior park (Lake Park Brea)
- Construction: Mobile home construction
- Exterior features: Community in-ground pool (fenced); Community spa (heated, in-ground, indoor); Lake or pond on site; Tennis courts; Pickleball courts; Clubhouse; Exercise / fitness room; Billiard room; Guest parking
Interior
- Kitchen: Range/oven; Dishwasher; Garbage disposal; Water line to refrigerator; Pantry; Breakfast bar
- Bedrooms: Den (additional flexible room — not listed as a bedroom)
- Flooring: Laminate floors; Carpeted floors
- Bathrooms: 2 full bathrooms
- Heating & cooling: Central heating; Central cooling; Ceiling fan
- Interior features: Ground-level entry with steps; Den; Dining area; Living room; Breakfast bar; Pantry; Covered patio; Open patio
- Laundry & utility: Laundry in unit (inside); Gas dryer hookup
Neighborhood map
What this means for you Summary
Snapshot
- This is a 2-bed/2.0-bath manufactured listed at $223k.
Deal economics
- At list price, monthly cash flow is $929 ($11k/yr) — positive.
- The deal already cash-flows at list — no discount required.
- Meets the 1% rule at list price ($3k rent vs $223k).
- Cap rate 11.3% vs local median 2.1% in Brea — top-decile yield for the area; either an underpriced asset or a hidden risk that comps aren't pricing in. Stress-test before assuming the spread holds.
Location & tenants
- Location reads 76/100 on livability (#100 in CA, #3,570 nationally) — a middle-class / working-renter tenant base. Strengths: amenities A+, employment A+, schools A-; Watch: health & safety C-, cost of living F.
- Fullerton Joint Union High (suburban): math 51% / reading 66% proficiency, ranked #82 of 517 in CA (top 16%) — acceptable for families but not a draw, mixed tenant base, ~2y average lease.
- Market conditions: Rents rising (+1.8%/yr); 63 active listings in the ZIP; 33 comparable units currently listed for rent nearby; rentals leasing fast (median 5d on market — plan ~1-2 weeks tenant-placement turnaround); high-income renter base; 6,974 units permitted in Orange County in 2024 (3,839 in 5+ unit buildings).
- This rent runs 30% of the median local income ($124k/yr) — at the standard rent-burdened threshold; future hikes will face affordability resistance.
Forward outlook
- Local home prices are declining (-3.0%/yr); year-one equity from $2k of loan paydown is wiped out by about $7k of value loss. Plan a longer hold.
- Orange County population projected at +14% by 2050 — modest demand growth; plan on rents tracking national, not racing it.
- At projected returns (-3.0% appreciation + 1.8% rent growth), your $62k cash investment doubles in ~8 years — after that, you're playing with house money.
Negotiation context
- Only 2 days on market — expect competitive offers; lowballing is unlikely to land.
Risks & watch-outs
- Climate carrying-cost: extreme-heat days projected 7→22/yr by 2055 (HVAC capex compounding) — expect insurance premiums to compound above CPI over the hold.
Questions for the listing agent
- Is there a deadline driving the sale (1031 exchange, divorce, estate, relocation)? That informs how much negotiation room exists.
- Schools are A-rated — typically a magnet for longer-tenancy family renters. What's the average tenant stay here, and is there a school-zone premium baked into asking?
- What's the average days-on-market for RENTAL listings here right now (not sales)? A rising rental-DOM trend means longer vacancies and softer asking-rent achievability than the comps imply.
- What's the recent tenant-quality profile in this submarket — average credit score on applications, eviction rate, late-payment / NSF rate, and stable-employment percentage? A property-management company in the area should have these aggregated.
- How much new for-sale + rental construction is in the pipeline within 1–3 miles? Heavy new supply typically softens prices + rents 12–24 months out; constrained supply supports both.
Investment metrics
- 1% rule
- 1.40% ✓
- Cap rate
- 11.29%
- Cash-on-cash
- 17.85%
- DSCR
- 1.79
- GRM
- 5.9
CMA / ARV
- ARV (on-the-fly)
- $263,520
- Comps found
- 12
Show comp detail 12 sales within ~0.75 mi
| Address | Dist | Beds/Ba | Sqft | Sold | Price | $/sf | Match |
|---|---|---|---|---|---|---|---|
| 1235 Harbor Lk #13 | 0.10mi | 2/2.0 | 1,440 (0%) | 1mo | $228,000 | $158 | 95 |
| 686 Wood Lake Dr #8 | 0.06mi | 2/2.0 | 1,440 (0%) | 7mo | $264,000 | $183 | 91 |
| 2201 Lake Vw #20 | 0.31mi | 2/2.0 | 1,440 (0%) | 1mo | $220,000 | $153 | 85 |
| 1414 W Central #69 | 0.21mi | 3/2.0 (+1) | 1,344 (-7%) | 0mo | $265,000 | $197 | 74 |
| 755 Village Lake Mall #337 | 0.11mi | 2/2.0 | 1,296 (-10%) | 6mo | $150,000 | $116 | 74 |
| 1341 Harbor Lake Ave #24 | 0.16mi | 2/2.0 | 1,296 (-10%) | 5mo | $215,000 | $166 | 72 |
| 726 Knoll Lake Dr #264 | 0.15mi | 2/2.0 | 1,296 (-10%) | 8mo | $210,000 | $162 | 70 |
| 1414 W Central Ave #88 | 0.21mi | 3/2.0 (+1) | 1,344 (-7%) | 5mo | $255,000 | $190 | 70 |
| 1261 Glen Lake Ave #279 | 0.21mi | 2/2.0 | 1,296 (-10%) | 6mo | $149,000 | $115 | 69 |
| 685 View Lake Dr #161 | 0.09mi | 2/2.0 | 1,640 (+14%) | 8mo | $385,000 | $235 | 66 |
| 1414 W Central Ave #81 | 0.21mi | 3/2.0 (+1) | 1,248 (-13%) | 0mo | $289,000 | $232 | 63 |
| 2240 Lake Glen Dr #56 | 0.34mi | 2/2.0 | 1,248 (-13%) | 7mo | $338,000 | $271 | 56 |
Match score weights: distance 35% · size 25% · config 20% · recency 20%. Top-matched comps best support the ARV.
Projected returns pro-forma
-3.0% appreciation · 1.78% rent growth · sell at horizon
- IRR
- 8.0%
- Equity multiple
- 1.31×
- Total profit
- $19,283
- Equity at exit
- $33,250
- IRR
- 16.2%
- Equity multiple
- 2.25×
- Total profit
- $77,983
- Equity at exit
- $19,281
Cash invested: $62,440 (down + closing). Projections, not guarantees.
Landlord ↔ Tenant lean methodology
- Overall (STATE)
- 18 Strongly Tenant-Friendly
- State California
- 18 Strongly Tenant-Friendly · D+13
- County
- — inherits STATE
- City
- — inherits STATE
ZIP-level market 92821
- Rents YoY
- 1.8%
- Active inventory
- 63
- Price-to-rent
- 5.9×
Monthly cashflow live
- Estimated rent
- $3,127 high interval (Pro) →
- Mortgage (P&I)
- −$1,169
- Tax est. 1.5%
- −$279 /mo · $3,345/yr
- Insurance
- −$93
- HOA
- −$0
- Vacancy / Maint / Mgmt
- −$657
- Net cashflow
- $929
Break-even live
UW: 25.0% down · 7.5% · 30yr · 1.5% tax · 5.0% vac · 8.0% maint · 8.0% mgmt
Financing live
Cash to close
- Down payment
- $55,750
- Closing costs
- $6,690
- Reserves months
- —
- Total cash needed
- —
Loan-product check · same deal, 3 products live
Conventional
25% down · 7.5% · 30yr
- Down + closing
- —
- Monthly P&I
- —
- Monthly cashflow
- —
- DSCR
- —
- Eligible?
- —
Personal DTI + credit; lowest rate.
DSCR
20% down · 8.5% · 30yr
- Down + closing
- —
- Monthly P&I
- —
- Monthly cashflow
- —
- DSCR
- —
- Eligible?
- —
No personal income docs; deal must DSCR.
Hard money
10% down · 12.0% · 12mo
- Down + closing
- —
- Monthly P&I
- —
- Monthly cashflow
- —
- DSCR
- —
- Eligible?
- —
Short-term bridge; refi at stabilization.
Rent comps 33 comps
| Address | Beds | Baths | Sqft | Rent | $/sqft | DOM | Units | Dist |
|---|---|---|---|---|---|---|---|---|
| 1511 Kinsler Ct Brea, CA | 3.0 | 2.5 | 1605 | $4,095 | $2.55 | 15d | 1 | 0.21mi |
| 209 S Fonda St La Habra, CA | 2.0 | 2.0 | 1200 | $3,500 | $2.92 | 1d | 1 | 0.72mi |
| 160 N Fonda St La Habra, CA | 2.0 | 2.0 | 1000 | $2,500 | $2.50 | 1d | 1 | 0.73mi |
| 160 N Fonda St Unit 2 La Habra, CA | 2.0 | 1.5 | 1000 | $2,500 | $2.50 | 1d | 1 | 0.73mi |
| 141 N Fonda St Unit 1 La Habra, CA | 3.0 | 2.5 | 1300 | $3,400 | $2.62 | 10d | 1 | 0.75mi |
| 1500 Eastpark Dr Unit 3 La Habra, CA | 2.0 | 1.5 | 1286 | $2,500 | $1.94 | 1d | 1 | 0.78mi |
| 160 Greentree Ln La Habra, CA | 2.0 | 1.5 | 1050 | $2,800 | $2.67 | 1d | 1 | 0.84mi |
| 730 Brooklyn Dr Brea, CA | 2.0 | 2.5 | 1210 | $3,400 | $2.81 | 24d | 1 | 0.95mi |
| 350 W Central Ave Brea, CA | 1.0–3.0 | 1.0–2.5 | 1024 | $3,538 | $3.45 | 1d | 8 | 0.95mi |
| 825 Tamarack Ave Brea, CA | 1.0–2.0 | 1.0–2.0 | 837 | $2,640 | $3.15 | 1d | 5 | 0.98mi |
| 650 Tamarack Ave Brea, CA | 2.0 | 1.0–2.0 | 750 | $2,850 | $3.80 | 1d | 18 | 1.02mi |
| 319 W Lambert Rd Brea, CA | 2.0 | 2.0 | 1120 | $3,333 | $2.98 | 4d | 9 | 1.08mi |
| 171 S Valencia St Unit 3 La Habra, CA | 2.0 | 2.0 | 1000 | $2,450 | $2.45 | 1d | 1 | 1.10mi |
| 250 W Central Ave Brea, CA | 2.0 | 2.0 | 1100 | $2,930 | $2.66 | 16d | 2 | 1.10mi |
| 2598 Associated Rd Fullerton, CA | 2.0 | 2.0 | 988 | $3,535 | $3.58 | 20d | 1 | 1.16mi |
| 2598 Associated Rd Fullerton, CA | 1.0 | 1.0 | 885 | $3,030 | $3.42 | 16d | 1 | 1.16mi |
| 2598 Associated Rd Fullerton, CA | 1.0 | 1.0 | 896 | $3,215 | $3.59 | 3d | 1 | 1.16mi |
| 2598 Associated Rd Fullerton, CA | 1.0 | 1.0 | 885 | $3,280 | $3.71 | 15d | 1 | 1.16mi |
| 640 Ward St Unit 2 La Habra, CA | 2.0 | 1.0 | 950 | $2,195 | $2.31 | 16d | 1 | 1.18mi |
| 655 N Brea Blvd Brea, CA | 1.0–2.0 | 1.0–2.0 | 830 | $2,745 | $3.31 | 1d | 1 | 1.23mi |
| 1301 Las Riendas Dr La Habra, CA | 1.0–2.0 | 1.0–1.5 | 900 | $2,970 | $3.30 | 1d | 1 | 1.23mi |
| 334 S Walnut Ave Unit F Brea, CA | 2.0 | 1.5 | 904 | $2,995 | $3.31 | 16d | 1 | 1.26mi |
| 137 N Orange Ave Brea, CA | 2.0 | 2.0 | 975 | $2,585 | $2.65 | 43d | 1 | 1.27mi |
| 703 E Stearns Ave Unit 707-C La Habra, CA | 2.0 | 1.0 | 950 | $2,695 | $2.84 | 1d | 1 | 1.27mi |
| 1001 N Harbor Blvd La Habra, CA | 1.0–2.0 | 1.0–1.5 | 880 | $2,750 | $3.12 | 1d | 2 | 1.29mi |
| 108 E Date St Unit 108 Brea, CA | 2.0 | 1.0 | 950 | $3,095 | $3.26 | 43d | 1 | 1.36mi |
| 1401 S Harbor Blvd La Habra, CA | 1.0–2.0 | 1.0–2.0 | 875 | $2,550 | $2.91 | 1d | 2 | 1.42mi |
| 410 S Orange Ave Unit B Brea, CA | 2.0 | 1.0 | 950 | $2,550 | $2.68 | 43d | 1 | 1.43mi |
| 203 E Elm St Brea, CA | 3.0 | 2.0 | 1142 | $3,800 | $3.33 | 24d | 1 | 1.45mi |
| 308 Mountain Ct Brea, CA | 3.0 | 2.0 | 1730 | $3,550 | $2.05 | 43d | 1 | 1.47mi |
| 715 S Walnut Ave Apt 3 Brea, CA | 2.0 | 2.5 | 1300 | $3,400 | $2.62 | 4d | 1 | 1.47mi |
| 719 S Walnut Ave Brea, CA | 3.0 | 2.0 | 1339 | $3,800 | $2.84 | 43d | 1 | 1.49mi |
| 1236 Devonshire Ln La Habra, CA | 3.0 | 2.5 | 1175 | $3,895 | $3.31 | 1d | 1 | 1.49mi |
Listing history 3 events
-
2026-06-18days on market $223,000 Active 2 DOM
-
2026-06-17remarks 699-char remark
-
2026-06-17$223,000 Active 1 DOM
ⓘ Source: listings_history table (triggers on properties + properties_extension) + one-shot
backfill from property_details.listing_events for pre-trigger history.
Climate risk First Street
- Flood 4/10 Moderate FEMA zone X (unshaded) · 22% chance over 30 yrs
- Wildfire 3/10 Moderate
- Heat 6/10 Major 7 d/yr ≥96°F today · 22 d/yr by 30 yrs out
- Wind 1/10 Low
- Air quality 5/10 Major 7 unhealthy d/yr today · 9 by 30 yrs out
Nearby sold comps map
Loading sold comps map…
Walkable amenities ~0.75 mi
Loading nearby amenities…
Taxation est. · year 1
- Rental income
- $37,519
- − Mortgage interest
- −$12,491
- − Property taxes
- −$3,345
- − Insurance
- −$1,115
- − Repairs & maintenance
- −$3,002
- − Management
- −$3,002
- − Depreciation
- −$6,487
- Taxable income
- $8,078
- Est. tax owed @ 24.0%
- −$1,939
- After-tax cash flow
- $9,209/yr
For passive investors: Depreciation is non-cash, so a rental often shows a tax loss while cash-flowing — sheltering income. Rental losses are passive: they offset passive income freely, and up to $25,000/yr can offset ordinary (W-2) income if you actively participate and your MAGI is under $100k (phasing out to $0 by $150k); unused losses carry forward. On sale, claimed depreciation is recaptured at up to 25%, and gains may owe capital-gains tax (a 1031 exchange can defer both). Figures are a year-1 estimate at your 24.0% rate — not tax advice; consult a CPA.
Schools (NCES district)
- District
- Fullerton Joint Union High
- NCES district ID
- 0614760
- Math proficiency
- 51% ▲ 7.00%
- Reading proficiency
- 66% ▲ 1.00%
- Median HH income
- $66,666
- Composite
- 51.37/100
- National rank
- #1735
- State rank
- #82 of 517 in CA
Livability — Brea
- Score
- 76/100
- State rank
- #100
- US rank
- #3570
Category grades
Schools grade is shown separately in the Schools card above.
Census & demographics
- Census place
- Brea, CA
- County
- Orange County · 3,096,323 people
- City population
- 41,623
- Metro
- Los Angeles-Long Beach-Anaheim, CA
- Population (ZIP)
- 41,623
- Household income
- $123,629
- Rent vs Own
- Severe rent burden
- 1655.0
Population outlook (Orange County) Hauer SSP2
- Today (2025)
- 3,477,456 people
- By 2030
- 3,613,117 · +3.9%
- By 2040
- 3,835,945 · +10.3%
- By 2050
- 3,968,736 · +14.1%
- By 2075
- 4,097,053 · +17.8%
- By 2100
- 3,903,633 · +12.3%
Race, ethnicity, and origin ACS 2023
- Neighborhood character
- Diverse neighborhood (Simpson 0.69)
- Race & ethnicity
- White 38% Hispanic / Latino 32% Asian 24% Two or more races 14% Black 1%
- Hispanic origin (detail)
- Mexican 27%
- Common ancestry
- Slovak 2% Lithuanian 2% Italian 1%
- Foreign-born
- 23% · Canada, South Korea, China
- Languages at home
- 66% English-only · Spanish 16% Korean 6% Chinese 4%
Political lean MEDSL · Orange
- 2024 margin
- Toss-up / Even · D 49.7% · R 47.1% · Other 3.2%
- 2008→2024 swing
- +5.2pp toward D · 2008: -2.6pp · 2024: 2.6pp
- All cycles
- 2024: D+2.6 2020: D+9.0 2016: D+7.7 2012: R+8.3 2008: R+2.6
Not yet ingested
- Civics
- —
Market trends
- HPI YoY
- ▼ -826.78%
- Current HPI
- 374.8663
- Rent YoY
- ▲ 1.78%
- Metro
- Los Angeles-Long Beach-Anaheim, CA
- State GDP YoY
- ▲ 3.21%
- F500 in state
- 116
Industry mix (Fortune 500 HQ in CA)
| Industry | F500 HQs | Revenue |
|---|---|---|
| Technology | 27 | $1,492B |
|
||
| Financial Services | 3 | $174B |
|
||
| Retail | 3 | $44B |
|
||
| Insurance | 3 | $26B |
|
||
| Media / Entertainment | 2 | $115B |
|
||
| Pharmaceuticals / Biotech | 2 | $62B |
|
||
Price history
1 event — show timeline
- 2026-06-16 Listed $223,000 TheMLS
Property tax history
-7.9%/yrLatest (2025): $15 · +2.3% YoY. Source: county tax records.
Cash-flow waterfall
monthlySold comps — $/sqft
last 12 mo · ≤1 miLoading sold comps…