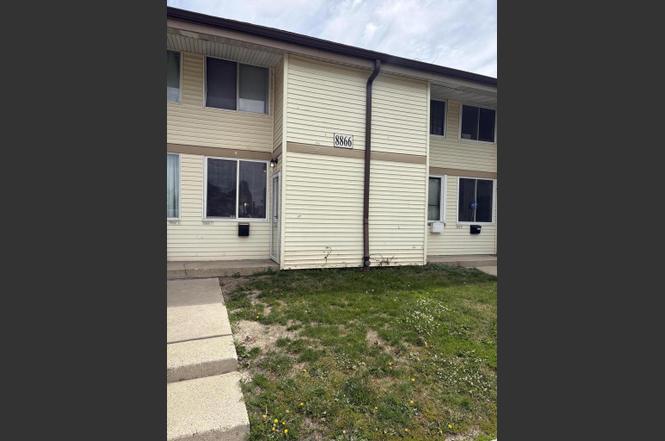
8866 N 95th St Unit F · Milwaukee, WI
Flood risk 7/10 · Major
- FEMA flood zone
- X (unshaded)
- Chance of flooding over 30 yrs
- 0.76%
- Est. flood insurance / yr
- $507 – $1,088
Fire risk 3/10 · Minor
- Est. fire insurance / yr
- $636 – $1,182
Heat risk 2/10 · Minimal
- Hot days now (above 100°F)
- 7 days/yr
- Hot days in 30 yrs
- 13 days/yr
Wind risk 2/10 · Minimal
- Chance of severe wind over 30 yrs
- —
Air-quality risk 2/10 · Minimal
- Unhealthy air days now
- 1 days/yr
- Unhealthy air days in 30 yrs
- 2 days/yr
Risk factors via First Street. Map © Google.
Why this score? — see what drove the B- grade
The composite is a weighted blend of 9 inputs, each scored 0–100. Each bar is that input's sub-score; the figure is the points it added to the 100-point composite (weight × sub-score).
- Cash flow +30.0/30.0
- 1% rule +10.0/10.0
- DSCR +10.0/10.0
- ARV discount +7.5/15.0
- Rent growth +4.0/5.0
- Livability +4.0/5.0
- Condition / age +2.5/5.0
- Schools +1.2/10.0
- Appreciation +0.0/10.0
$84,900
🖨 Deal sheet 📄 Offer letter ✓ Due diligence
Listing remarks MLS
Property being sold in the 'AS IS' condition. Room sizes have been estimated. Pre-approval or proof of funds with all offers. Call main office for special addendums to accompany offers. If this property is financed, it must be owner-occupied.
Key facts
- $261 HOA
- Parking
- Built 1970
Property features AI
Finance
- Financial info: Pets are permitted
- HOA & community: Monthly condo fee of $261; Association amenities include common green space and walking trail
Exterior
- Parking: One assigned surface parking space; Attached garage
- Utilities: Municipal water; Municipal sewer; Natural gas
- Home design: Condo unit in a midrise (3-5 stories) building; Multi-level unit; Part of The Woodlands condominium
- Construction: Assessor/public record used for year built
- Exterior features: Brick, brick/stone, and vinyl exterior; Zoned PD; Common green space and walking trail in the association
Interior
- Kitchen: Kitchen on the lower level approximately 13 x 12
- Bedrooms: Master bedroom (upper level) approximately 13 x 12; Second bedroom (upper level) approximately 12 x 12; Third bedroom (upper level) approximately 10 x 12
- Bathrooms: One full bathroom with shower over tub; One half bathroom
- Heating & cooling: Forced air heating (natural gas); Central air conditioning
- Interior features: Partial basement; Family room on the main level
Neighborhood map
What this means for you Summary
Snapshot
- This is a 3-bed/1.5-bath condo listed at $85k.
Deal economics
- At list price, monthly cash flow is $312 ($4k/yr) — positive.
- The deal already cash-flows at list — no discount required.
- Meets the 1% rule at list price ($2k rent vs $85k).
- Cap rate 11.6% vs local median 5.1% in Milwaukee — top-decile yield for the area; either an underpriced asset or a hidden risk that comps aren't pricing in. Stress-test before assuming the spread holds.
Location & tenants
- Location reads 81/100 on livability (#55 in WI, #1,534 nationally) — a professional / high-income tenant draw. Strengths: amenities A+, commute A+, cost of living A+; Watch: employment D+, schools F, crime F.
- Milwaukee School District (urban): math 10% / reading 18% proficiency, ranked #337 of 342 in WI (top 98%) — low school quality limits family demand, transient renter base, plan for 1-2y turnover; 77% free/reduced lunch — lower-income household profile, screen leases tightly.
- Market conditions: Rents rising fast (+6.0%/yr); 40 active listings in the ZIP; 15 comparable units currently listed for rent nearby; rentals at typical pace (median 24d on market — plan ~3-4 weeks tenant-placement turnaround); 1,017 units permitted in Milwaukee County in 2024 (803 in 5+ unit buildings).
Forward outlook
- Local home prices are declining (-3.0%/yr); year-one equity from $587 of loan paydown is wiped out by about $3k of value loss. Plan a longer hold.
- Milwaukee County population projected at +4% by 2050 — modest demand growth; plan on rents tracking national, not racing it.
- At projected returns (-3.0% appreciation + 6.0% rent growth), your $24k cash investment doubles in ~6 years — after that, you're playing with house money.
Negotiation context
- Only 2 days on market — expect competitive offers; lowballing is unlikely to land.
- Current owner paid $15k; list at $85k implies a 466% gain — meaningful room to come down on a strong offer.
Risks & watch-outs
- Watch-outs: flood insurance adds $66/mo.
- Climate carrying-cost: major flood risk — expect insurance premiums to compound above CPI over the hold.
Questions for the listing agent
- Built in 1970 — when were the roof, HVAC, electrical panel, plumbing, and water heater last replaced?
- What's the actual annual flood-insurance premium (NFIP or private), and is the property in a SFHA with mandatory coverage?
- What does the HOA fee cover, when was the last increase, and are there any pending special assessments or reserve-fund shortfalls?
- Any open or pending special assessments — roof, HVAC, plumbing, elevator, façade? What's the per-unit balance and payoff schedule, and is the seller paying it off at close or rolling it to the buyer?
- Is there a deadline driving the sale (1031 exchange, divorce, estate, relocation)? That informs how much negotiation room exists.
- Schools are F-rated, which usually means shorter tenancies and higher turnover. Who's the typical renter profile here, and what's been the actual vacancy rate?
- Crime grade is F in this area — have there been break-ins, vandalism, or insurance claims at this property in the last 3 years? What carrier currently insures it and at what premium?
- What's the average days-on-market for RENTAL listings here right now (not sales)? A rising rental-DOM trend means longer vacancies and softer asking-rent achievability than the comps imply.
- What's the recent tenant-quality profile in this submarket — average credit score on applications, eviction rate, late-payment / NSF rate, and stable-employment percentage? A property-management company in the area should have these aggregated.
- How much new apartment / multifamily construction is in the pipeline within 1–3 miles? Heavy new supply (>2% of stock underway) typically softens rents 12–24 months out; light construction supports rent growth.
Investment metrics
- 1% rule
- 1.83% ✓
- Cap rate
- 11.64%
- Cash-on-cash
- 19.10%
- DSCR
- 1.85
- GRM
- 4.6
CMA / ARV
No comps found within radius.
Projected returns pro-forma
-3.0% appreciation · 5.95% rent growth · sell at horizon
- IRR
- 11.2%
- Equity multiple
- 1.47×
- Total profit
- $11,079
- Equity at exit
- $12,659
- IRR
- 23.3%
- Equity multiple
- 3.39×
- Total profit
- $56,823
- Equity at exit
- $7,341
Cash invested: $23,772 (down + closing). Projections, not guarantees.
Landlord ↔ Tenant lean methodology
- Overall (STATE)
- 73 Landlord-Friendly
- State Wisconsin
- 73 Landlord-Friendly · R+2
- County
- — inherits STATE
- City
- — inherits STATE
ZIP-level market 53224
- Home prices YoY
- -17.2%
- Rents YoY
- 6.0%
- Active inventory
- 40
- Price-to-rent
- 4.6×
Monthly cashflow live
- Estimated rent
- $1,552 high interval (Pro) →
- Mortgage (P&I)
- −$445
- Tax est. 1.5%
- −$106 /mo · $1,274/yr
- Insurance
- −$35
- Flood insurance flood zone
- −$66 /mo · $798/yr
- HOA
- −$261
- Vacancy / Maint / Mgmt
- −$326
- Net cashflow
- $312
Break-even live
UW: 25.0% down · 7.5% · 30yr · 1.5% tax · 5.0% vac · 8.0% maint · 8.0% mgmt
Financing live
Cash to close
- Down payment
- $21,225
- Closing costs
- $2,547
- Reserves months
- —
- Total cash needed
- —
Loan-product check · same deal, 3 products live
Conventional
25% down · 7.5% · 30yr
- Down + closing
- —
- Monthly P&I
- —
- Monthly cashflow
- —
- DSCR
- —
- Eligible?
- —
Personal DTI + credit; lowest rate.
DSCR
20% down · 8.5% · 30yr
- Down + closing
- —
- Monthly P&I
- —
- Monthly cashflow
- —
- DSCR
- —
- Eligible?
- —
No personal income docs; deal must DSCR.
Hard money
10% down · 12.0% · 12mo
- Down + closing
- —
- Monthly P&I
- —
- Monthly cashflow
- —
- DSCR
- —
- Eligible?
- —
Short-term bridge; refi at stabilization.
Rent comps 15 comps
| Address | Beds | Baths | Sqft | Rent | $/sqft | DOM | Units | Dist |
|---|---|---|---|---|---|---|---|---|
| 9010 N 95th St Unit 1UNIT F Milwaukee, WI | 3.0 | 1.5 | 1056 | $1,550 | $1.47 | 43d | 1 | 0.10mi |
| 9031A N 95th St Milwaukee, WI | 4.0 | 1.5 | 1249 | $1,500 | $1.20 | 14d | 1 | 0.10mi |
| 9097 N 95th St Milwaukee, WI | 3.0 | 1.5 | 1054 | $1,225 | $1.16 | 14d | 1 | 0.22mi |
| 8836 N 95th St Milwaukee, WI | 3.0 | 1.5 | 1100 | $1,450 | $1.32 | 23d | 1 | 0.24mi |
| 9100 N 85th St Milwaukee, WI | 2.0 | 1.0 | 950 | $1,245 | $1.31 | 43d | 1 | 0.62mi |
| 8573 N Granville Rd Milwaukee, WI | 4.0 | 1.0 | 1072 | $1,700 | $1.59 | 14d | 1 | 0.85mi |
| 10851 W Donna Dr Milwaukee, WI | 1.0–2.0 | 1.0 | 785 | $1,200 | $1.53 | 14d | 80 | 1.19mi |
| 7601 W Donna Ct #1 Milwaukee, WI | 2.0 | 1.5 | 872 | $1,250 | $1.43 | 23d | 1 | 1.24mi |
| 7935 N 94th St Unit 7935 Milwaukee, WI | 3.0 | 1.5 | 1250 | $1,300 | $1.04 | 44d | 1 | 1.25mi |
| 8183 N 107th St Unit 81678167-B Milwaukee, WI | 2.0 | 1.5 | 1000 | $1,650 | $1.65 | 4d | 1 | 1.37mi |
| 8183 N 107th St Unit 8199-8199B Milwaukee, WI | 2.0 | 1.5 | 1000 | $1,700 | $1.70 | 23d | 1 | 1.37mi |
| 8183 N 107th St Unit 8183K Milwaukee, WI | 2.0 | 1.5 | 1000 | $1,700 | $1.70 | 4d | 1 | 1.37mi |
| 8183 N 107th St Unit 8199-8199C Milwaukee, WI | 2.0 | 1.5 | 1000 | $1,650 | $1.65 | 43d | 1 | 1.37mi |
| 8183 N 107th St Unit 8199-8199E Milwaukee, WI | 2.0 | 1.5 | 1000 | $1,650 | $1.65 | 23d | 1 | 1.37mi |
| 7300 W Dean Rd Milwaukee, WI | 1.0–2.0 | 1.0–1.5 | 850 | $1,545 | $1.82 | 2d | 8 | 1.40mi |
HOA detail condo
- Monthly dues
- $261 · $3,132/yr
- Assessments
- None detected in remarks — confirm with the listing agent.
Listing history 3 events
-
2026-06-18days on market $84,900 Active 2 DOM
-
2026-06-16remarks 334-char remark
-
2026-06-16$84,900 Active 1 DOM
ⓘ Source: listings_history table (triggers on properties + properties_extension) + one-shot
backfill from property_details.listing_events for pre-trigger history.
Climate risk First Street
- Flood 7/10 Severe FEMA zone X (unshaded) · 76% chance over 30 yrs
- Wildfire 3/10 Moderate
- Heat 2/10 Low 7 d/yr ≥100°F today · 13 d/yr by 30 yrs out
- Wind 2/10 Low
- Air quality 2/10 Low 1 unhealthy d/yr today · 2 by 30 yrs out
Nearby sold comps map
Loading sold comps map…
Walkable amenities ~0.75 mi
Loading nearby amenities…
Taxation est. · year 1
- Rental income
- $18,625
- − Mortgage interest
- −$4,756
- − Property taxes
- −$1,274
- − Insurance
- −$1,222
- − Repairs & maintenance
- −$1,490
- − Management
- −$1,490
- − HOA
- −$3,132
- − Depreciation
- −$2,470
- Taxable income
- $2,792
- Est. tax owed @ 24.0%
- −$670
- After-tax cash flow
- $3,074/yr
For passive investors: Depreciation is non-cash, so a rental often shows a tax loss while cash-flowing — sheltering income. Rental losses are passive: they offset passive income freely, and up to $25,000/yr can offset ordinary (W-2) income if you actively participate and your MAGI is under $100k (phasing out to $0 by $150k); unused losses carry forward. On sale, claimed depreciation is recaptured at up to 25%, and gains may owe capital-gains tax (a 1031 exchange can defer both). Figures are a year-1 estimate at your 24.0% rate — not tax advice; consult a CPA.
Schools (NCES district)
- District
- Milwaukee School District
- NCES district ID
- 5509600
- Math proficiency
- 10% ▼ -5.00%
- Reading proficiency
- 18% ▬ 0.00%
- Median HH income
- $36,339
- Composite
- 11.61/100
- National rank
- #9696
- State rank
- #337 of 342 in WI
Livability — Milwaukee
- Score
- 81/100
- State rank
- #55
- US rank
- #1534
Category grades
Schools grade is shown separately in the Schools card above.
Census & demographics
- Census place
- Milwaukee, WI
- County
- Milwaukee County · 926,379 people
- City population
- 573,768
- Metro
- Milwaukee-Waukesha, WI
- Population (ZIP)
- 21,223
- Household income
- $67,803
- Rent vs Own
- Severe rent burden
- 1137.0
Population outlook (Milwaukee County) Hauer SSP2
- Today (2025)
- 995,758 people
- By 2030
- 1,009,124 · +1.3%
- By 2040
- 1,028,128 · +3.3%
- By 2050
- 1,040,066 · +4.4%
- By 2075
- 1,057,849 · +6.2%
- By 2100
- 1,039,774 · +4.4%
Race, ethnicity, and origin ACS 2023
- Neighborhood character
- Diverse neighborhood (Simpson 0.62)
- Race & ethnicity
- Black 57% White 18% Asian 13% Hispanic / Latino 7% Two or more races 7% Native American 2%
- Hispanic origin (detail)
- Mexican 4% Puerto Rican 2% Dominican 1%
- Common ancestry
- Romanian 2% Italian 2% Portuguese 1%
- Foreign-born
- 7% · Canada
- Languages at home
- 86% English-only · Spanish 6% Other Asian/Pacific 5% German/W. Germanic 1%
Political lean MEDSL · Milwaukee
- 2024 margin
- Solid D (+38.5) · D 68.3% · R 29.8% · Other 1.8%
- 2008→2024 swing
- +2.7pp toward D · 2008: 35.9pp · 2024: 38.5pp
- All cycles
- 2024: D+38.5 2020: D+39.9 2016: D+37.5 2012: D+34.6 2008: D+35.9
Not yet ingested
- Civics
- —
Market trends
- HPI YoY
- ▼ -66.27%
- Current HPI
- 318.5025
- Rent YoY
- ▲ 5.95%
- Metro
- Milwaukee-Waukesha, WI
- State GDP YoY
- ▲ 2.10%
- F500 in state
- 20
Industry mix (Fortune 500 HQ in WI)
| Industry | F500 HQs | Revenue |
|---|---|---|
| Industrial Machinery | 4 | $23B |
|
||
| Industrial Technology | 2 | $36B |
|
||
| Insurance | 1 | $36B |
|
||
| Professional Services | 1 | $19B |
|
||
| Utilities | 1 | $9B |
|
||
| Consumer Goods | 1 | $3B |
|
||
Price history
+466.0% since first listed2 events — show timeline
- 2026-06-16 Listed $84,900 METROMLS
- 2007-06-22 Sold (MLS) $15,000 METROMLS
Cash-flow waterfall
monthlySold comps — $/sqft
last 12 mo · ≤1 miLoading sold comps…