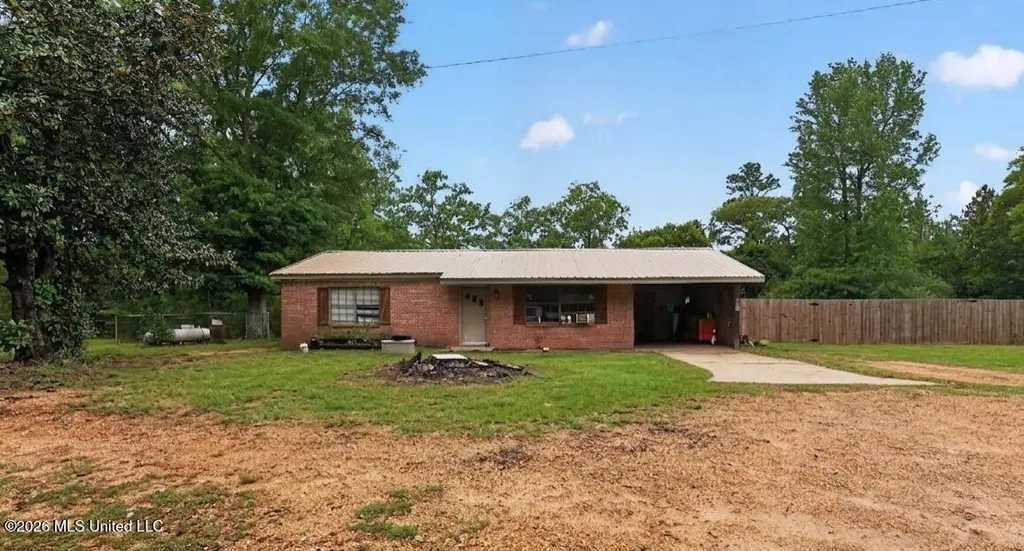
838 S Main St · Mendenhall, MS
Flood risk 1/10 · Minimal
- FEMA flood zone
- X (unshaded)
- Chance of flooding over 30 yrs
- 0.0%
- Est. flood insurance / yr
- $507 – $1,088
Fire risk 4/10 · Minor
- Est. fire insurance / yr
- $1,241 – $2,305
Heat risk 7/10 · Major
- Hot days now (above 107°F)
- 7 days/yr
- Hot days in 30 yrs
- 20 days/yr
Wind risk 8/10 · Major
- Chance of severe wind over 30 yrs
- 80.0%
Air-quality risk 1/10 · Minimal
- Unhealthy air days now
- 0 days/yr
- Unhealthy air days in 30 yrs
- 0 days/yr
Risk factors via First Street. Map © Google.
Why this score? — see what drove the C grade
The composite is a weighted blend of 9 inputs, each scored 0–100. Each bar is that input's sub-score; the figure is the points it added to the 100-point composite (weight × sub-score).
- ARV discount +14.9/15.0
- Cash flow +14.3/30.0
- Appreciation +10.0/10.0
- DSCR +4.4/10.0
- Livability +3.0/5.0
- 1% rule +2.8/10.0
- Rent growth +2.5/5.0
- Condition / age +2.5/5.0
- Schools +1.7/10.0
$165,000
🖨 Deal sheet 📄 Offer letter ✓ Due diligence
Listing remarks
Have you ever noticed how difficult it is to find a home that offers true privacy and massive square footage without being isolated from town? 838 Main St S offers a rare combination of 1970s character and significant infrastructure on a 1.5-acre lot. We believe in being disarmingly upfront: while the home is move-in ready, it is currently filled with the owner's personal belongings. We invite you to look past the "living clutter" to see a clean, spacious interior that will be completely cleared out for your arrival. Underneath the daily life, you'll find vaulted wood-beamed ceilings and a massive brick fireplace that create a level of warmth nearly impossible to find in modern bu
Key facts
- 1.5 acre lot
- 4 parking spots
- Built 1975
Property features AI
Finance
- Other: Approximate building area: 1,963 (source: Owner); Lot size about 1.5 acres
Exterior
- Parking: Carport with 4 spaces; Driveway
- Utilities: Public water; Public sewer; Electricity connected; Natural gas available
- Home design: Single-family house; One level
- Construction: Brick construction; Slab foundation; Built according to public records (year built source: Public Records)
- Exterior features: Back yard fencing; Aluminum roof
Interior
- Kitchen: Built-in gas oven; Refrigerator
- Bathrooms: 2 full bathrooms
- Heating & cooling: Natural gas heating; Central air conditioning
- Interior features: Move-in ready condition; Other exterior features noted
Neighborhood map
What this means for you Summary
Snapshot
- This is a 4-bed/1.0-bath single-family listed at $165k.
Deal economics
- At list price, monthly cash flow is $30 ($366/yr) — positive.
- The deal already cash-flows at list — no discount required.
- To meet the 1% rule (rent ≥ 1% of price), the offer needs to be $128k (22.5% below list).
- Recommended offer: $128k (22.5% below list) — sets the bar for 1% rule.
- Cap rate 6.5% vs local median 3.2% in Mendenhall — top-decile yield for the area; either an underpriced asset or a hidden risk that comps aren't pricing in. Stress-test before assuming the spread holds.
Location & tenants
- Location reads 60/100 on livability (#220 in MS) — a middle-class / working-renter tenant base. Strengths: cost of living A+, crime A-; Watch: schools F, amenities F, commute F.
- Simpson County School District (rural): math 18% / reading 24% proficiency, ranked #90 of 130 in MS (top 69%) — low school quality limits family demand, transient renter base, plan for 1-2y turnover; 76% free/reduced lunch — lower-income household profile, screen leases tightly.
- Market conditions: 69 active listings in the ZIP; 3 units permitted in Simpson County in 2024 (0 in 5+ unit buildings).
Forward outlook
- In year one you build about $18k of equity ($1k loan paydown + $16k appreciation (10.0% local appreciation)).
- Simpson County population projected at -16% by 2050 — secular population decline; favor cash flow + early exit over multi-decade hold.
- At projected returns (10.0% appreciation + 3.0% rent growth), your $46k cash investment doubles in ~3 years — after that, you're playing with house money.
- By year 3, paydown + projected appreciation supports a ~$45k cash-out refi (75% LTV) — recoverable capital for the next deal without selling this one.
Negotiation context
- It's been on market 52 days — a 3% lower offer ($160k) is reasonable based on typical stale-listing flexibility.
Risks & watch-outs
- Climate carrying-cost: severe wind risk, 80% chance of damaging wind over 30y; extreme-heat days projected 7→20/yr by 2055 (HVAC capex compounding) — expect insurance premiums to compound above CPI over the hold.
Questions for the listing agent
- It's been on market 52 days. Have you received any prior offers? Is the seller open to a 22% concession, seller financing, or rate buy-down credit?
- Built in 1975 — when were the roof, HVAC, electrical panel, plumbing, and water heater last replaced?
- Is there a deadline driving the sale (1031 exchange, divorce, estate, relocation)? That informs how much negotiation room exists.
- Schools are F-rated, which usually means shorter tenancies and higher turnover. Who's the typical renter profile here, and what's been the actual vacancy rate?
- What's the average days-on-market for RENTAL listings here right now (not sales)? A rising rental-DOM trend means longer vacancies and softer asking-rent achievability than the comps imply.
- What's the recent tenant-quality profile in this submarket — average credit score on applications, eviction rate, late-payment / NSF rate, and stable-employment percentage? A property-management company in the area should have these aggregated.
- How much new for-sale + rental construction is in the pipeline within 1–3 miles? Heavy new supply typically softens prices + rents 12–24 months out; constrained supply supports both.
Investment metrics
- 1% rule
- 0.78% ✗
- Cap rate
- 6.51%
- Cash-on-cash
- 0.79%
- DSCR
- 1.04
- GRM
- 10.7
CMA / ARV
- ARV (median comp)
- $197,248
- List price
- $165,000
- Delta
- -16.35%
- Verdict
- UNDERPRICED
- Comps
- 4 within 1.0 mi
Show comp detail 1 sale within ~0.75 mi
| Address | Dist | Beds/Ba | Sqft | Sold | Price | $/sf | Match |
|---|---|---|---|---|---|---|---|
| 720 S Main St | 0.63mi | 4/3.0 | 1,889 (+8%) | 6mo | $69,900 | $37 | 45 |
Match score weights: distance 35% · size 25% · config 20% · recency 20%. Top-matched comps best support the ARV.
Projected returns pro-forma
10.0% appreciation · 3.0% rent growth · sell at horizon
- IRR
- 24.8%
- Equity multiple
- 2.99×
- Total profit
- $91,726
- Equity at exit
- $148,645
- IRR
- 21.9%
- Equity multiple
- 6.81×
- Total profit
- $268,433
- Equity at exit
- $320,559
Cash invested: $46,200 (down + closing). Projections, not guarantees.
Landlord ↔ Tenant lean methodology
- Overall (STATE)
- 90 Strongly Landlord-Friendly
- State Mississippi
- 90 Strongly Landlord-Friendly · R+11
- County
- — inherits STATE
- City
- — inherits STATE
ZIP-level market 39114
- Home prices YoY
- 7.9%
- Active inventory
- 69
- Price-to-rent
- 10.7×
Monthly cashflow live
- Estimated rent
- $1,279 medium interval (Pro) →
- Mortgage (P&I)
- −$865
- Tax from tax record
- −$46 /mo · $553/yr
- Insurance
- −$69
- HOA
- −$0
- Vacancy / Maint / Mgmt
- −$269
- Net cashflow
- $30
Break-even live
UW: 25.0% down · 7.5% · 30yr · 1.5% tax · 5.0% vac · 8.0% maint · 8.0% mgmt
Financing live
Cash to close
- Down payment
- $41,250
- Closing costs
- $4,950
- Reserves months
- —
- Total cash needed
- —
Loan-product check · same deal, 3 products live
Conventional
25% down · 7.5% · 30yr
- Down + closing
- —
- Monthly P&I
- —
- Monthly cashflow
- —
- DSCR
- —
- Eligible?
- —
Personal DTI + credit; lowest rate.
DSCR
20% down · 8.5% · 30yr
- Down + closing
- —
- Monthly P&I
- —
- Monthly cashflow
- —
- DSCR
- —
- Eligible?
- —
No personal income docs; deal must DSCR.
Hard money
10% down · 12.0% · 12mo
- Down + closing
- —
- Monthly P&I
- —
- Monthly cashflow
- —
- DSCR
- —
- Eligible?
- —
Short-term bridge; refi at stabilization.
Listing history 19 events
-
2026-06-18days on market $165,000 Active 52 DOM
-
2026-06-17days on market $165,000 Active 51 DOM
-
2026-06-16pricedays on market $165,000 Active 50 DOM
-
2026-06-15days on market $167,000 Active 49 DOM
-
2026-06-13days on market $167,000 Active 47 DOM
-
2026-06-12pricedays on market $167,000 Active 46 DOM
-
2026-06-09days on market $169,900 Active 43 DOM
-
2026-06-08days on market $169,900 Active 42 DOM
-
2026-06-07days on market $169,900 Active 41 DOM
-
2026-06-07days on market $169,900 Active 40 DOM
-
2026-06-04days on market $169,900 Active 37 DOM
-
2026-06-03price $169,900 Active 36 DOM
-
2026-06-02days on market $172,000 Active 36 DOM
-
2026-06-01days on market $172,000 Active 35 DOM
-
2026-05-31days on market $172,000 Active 34 DOM
-
2026-05-12price $175,000 1517-char remark
-
2026-05-05price $178,000 1517-char remark
-
2026-04-27$180,000 Active 1517-char remark
-
1999-07-23soldstatus
ⓘ Source: listings_history table (triggers on properties + properties_extension) + one-shot
backfill from property_details.listing_events for pre-trigger history.
Tax reassessment forecast MS · Resets to sale price
- Current annual tax
- $553 · $46/mo
- Projected year-2 tax
- $1,304 · $109/mo
- Expected delta
- +$751/yr (+$63/mo · 135.8%)
ⓘ Screening estimate from a state-policy table — verify with the county assessor before closing.
Climate risk First Street
- Flood 1/10 Low FEMA zone X (unshaded) · 0% chance over 30 yrs
- Wildfire 4/10 Moderate
- Heat 7/10 Severe 7 d/yr ≥107°F today · 20 d/yr by 30 yrs out
- Wind 8/10 Severe 80% chance of damaging wind over 30 yrs
- Air quality 1/10 Low 0 unhealthy d/yr today · 0 by 30 yrs out
Nearby sold comps map
Loading sold comps map…
Walkable amenities ~0.75 mi
Loading nearby amenities…
Taxation est. · year 1
- Rental income
- $15,351
- − Mortgage interest
- −$9,243
- − Property taxes
- −$553
- − Insurance
- −$825
- − Repairs & maintenance
- −$1,228
- − Management
- −$1,228
- − Depreciation
- −$4,800
- Taxable loss
- −$2,526
- Est. tax savings @ 24.0%
- +$606
- After-tax cash flow
- $972/yr
For passive investors: Depreciation is non-cash, so a rental often shows a tax loss while cash-flowing — sheltering income. Rental losses are passive: they offset passive income freely, and up to $25,000/yr can offset ordinary (W-2) income if you actively participate and your MAGI is under $100k (phasing out to $0 by $150k); unused losses carry forward. On sale, claimed depreciation is recaptured at up to 25%, and gains may owe capital-gains tax (a 1031 exchange can defer both). Figures are a year-1 estimate at your 24.0% rate — not tax advice; consult a CPA.
Schools (NCES district)
- District
- Simpson County School District
- NCES district ID
- 2803990
- Math proficiency
- 18% ▼ -14.00%
- Reading proficiency
- 24% ▼ -9.00%
- Median HH income
- $36,826
- Composite
- 17.46/100
- National rank
- #9063
- State rank
- #90 of 130 in MS
Livability — Mendenhall
- Score
- 60/100
- State rank
- #220
- US rank
- #19070
Category grades
Schools grade is shown separately in the Schools card above.
Census & demographics
- Population (ZIP)
- 10,553
Population outlook (Simpson County) Hauer SSP2
- Today (2025)
- 26,197 people
- By 2030
- 25,474 · -2.8%
- By 2040
- 23,811 · -9.1%
- By 2050
- 22,024 · -15.9%
- By 2075
- 17,701 · -32.4%
- By 2100
- 13,732 · -47.6%
Race, ethnicity, and origin ACS 2023
- Neighborhood character
- Majority White (58%)
- Race & ethnicity
- White 58% Black 39% Two or more races 2%
- Common ancestry
- Italian 3% Slovak 2% Lithuanian 2%
- Foreign-born
- 1%
- Languages at home
- 98% English-only · French/Haitian/Cajun 1% Other Indo-European 1%
Political lean MEDSL · Simpson
- 2024 margin
- Solid R (+36.7) · D 31.4% · R 68.1%
- 2008→2024 swing
- -14.3pp toward R · 2008: -22.4pp · 2024: -36.7pp
- All cycles
- 2024: R+36.7 2020: R+30.4 2016: R+30.9 2012: R+22.1 2008: R+22.4
Not yet ingested
- Civics
- —
Market trends
- HPI YoY
- ▲ 21.04%
- Current HPI
- 286.42
- Rent YoY
- —
- Metro
- —
- State GDP YoY
- —
- F500 in state
- 0
Price history
-8.3% since first listed8 events — show timeline
- 2026-06-16 Price Changed $165,000 MLSU
- 2026-06-11 Price Changed $167,000 MLSU
- 2026-06-02 Price Changed $169,900 MLSU
- 2026-05-19 Price Changed $172,000 MLSU
- 2026-05-12 Price Changed $175,000 MLSU
- 2026-05-05 Price Changed $178,000 MLSU
- 2026-04-27 Listed $180,000 MLSU
- 1999-07-23 Sold (Public Records) — Public Records
Property tax history
+4.2%/yrLatest (2025): $553 · +10.4% YoY. Source: county tax records.
Cash-flow waterfall
monthlySold comps — $/sqft
last 12 mo · ≤1 miLoading sold comps…