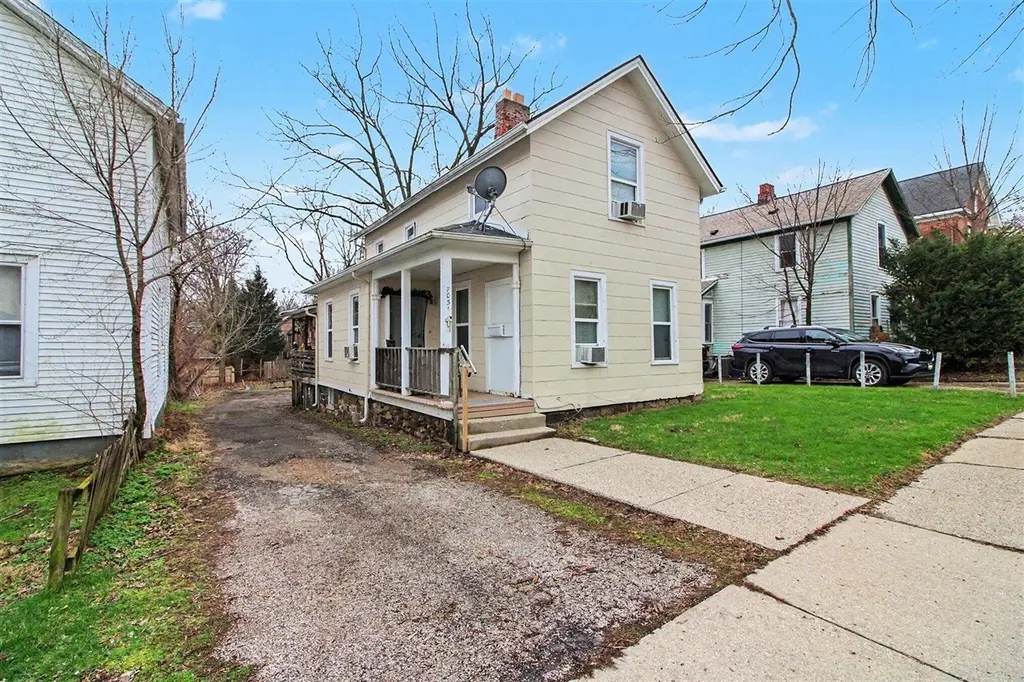
705 Pearl St · Ypsilanti, MI
Flood risk 1/10 · Minimal
- FEMA flood zone
- X (unshaded)
- Chance of flooding over 30 yrs
- 0.0%
- Est. flood insurance / yr
- $473 – $860
Fire risk 1/10 · Minimal
- Est. fire insurance / yr
- $784 – $1,456
Heat risk 3/10 · Minor
- Hot days now (above 99°F)
- 7 days/yr
- Hot days in 30 yrs
- 15 days/yr
Wind risk 2/10 · Minimal
- Chance of severe wind over 30 yrs
- —
Air-quality risk 2/10 · Minimal
- Unhealthy air days now
- 1 days/yr
- Unhealthy air days in 30 yrs
- 2 days/yr
Risk factors via First Street. Map © Google.
Why this score? — see what drove the D grade
The composite is a weighted blend of 9 inputs, each scored 0–100. Each bar is that input's sub-score; the figure is the points it added to the 100-point composite (weight × sub-score).
- ARV discount +15.0/15.0
- Cash flow +10.9/30.0
- Livability +4.0/5.0
- 1% rule +3.9/10.0
- Rent growth +3.3/5.0
- DSCR +3.2/10.0
- Condition / age +2.5/5.0
- Schools +1.3/10.0
- Appreciation +0.0/10.0
$229,900
🖨 Deal sheet (PDF) 📄 Offer letter ✓ Due diligence
Listing remarks MLS
Spacious 5 bedroom home featuring an updated kitchen with dishwasher and updated bath, all within walking distance to campus. Large deck, high ceilings, spacious room sizes. Property is leased to August 2027 ($28,740/yr). Tenants pay gas, electric, and water/sewer.
Key facts
- Large deck
- Updated bath
- Updated kitchen
Tags
Neighborhood map
What this means for you Summary
Snapshot
- This is a 5-bed/2.0-bath single-family listed at $230k.
Deal economics
- At list price, monthly cash flow is $-102 ($-1k/yr) — negative.
- To cash-flow at today's rent, offer at most $212k (7.9% below list).
- To meet the 1% rule (rent ≥ 1% of price), the offer needs to be $204k (11.3% below list).
- Recommended offer: $204k (11.3% below list) — sets the bar for 1% rule.
- Cap rate 5.8% vs local median 3.8% in Ypsilanti — top-decile yield for the area; either an underpriced asset or a hidden risk that comps aren't pricing in. Stress-test before assuming the spread holds.
Location & tenants
- Location reads 81/100 on livability (#71 in MI, #1,539 nationally) — a professional / high-income tenant draw. Strengths: amenities A+, commute A+, cost of living A+; Watch: crime F, employment D-.
- Ypsilanti Community Schools (suburban): math 11% / reading 20% proficiency, ranked #501 of 540 in MI (top 93%) — low school quality limits family demand, transient renter base, plan for 1-2y turnover; 69% free/reduced lunch — lower-income household profile, screen leases tightly.
- Market conditions: Rents rising (+3.4%/yr); 245 active listings in the ZIP; 5 comparable units currently listed for rent nearby; rentals at typical pace (median 20d on market — plan ~3-4 weeks tenant-placement turnaround); 996 units permitted in Washtenaw County in 2024 (492 in 5+ unit buildings).
- This rent runs 33% of the median local income ($74k/yr) — at the standard rent-burdened threshold; future hikes will face affordability resistance.
Forward outlook
- Local home prices are declining (-3.0%/yr); year-one equity from $2k of loan paydown is wiped out by about $7k of value loss. Plan a longer hold.
- Washtenaw County population projected at +25% by 2050 — long-run rental-demand tailwind backs the buy-and-hold thesis.
Negotiation context
- It's been on market 73 days — a 6% lower offer ($216k) is reasonable based on typical stale-listing flexibility.
- 4 sale attempts since 16y ago; this cycle's ask has dropped $19k (8%) from the opening price — seller is motivated, your offer sets the floor, not the list.
- Current owner paid $48k; list at $230k implies a 382% gain — meaningful room to come down on a strong offer.
Risks & watch-outs
- Watch-outs: built in 1880 — expect roof / HVAC / electrical / plumbing capex.
Questions for the listing agent
- What do current leases actually rent for vs. the listed asking? Can we see a recent rent roll and the last 12 months of T-12 income?
- It's been on market 73 days. Have you received any prior offers? Is the seller open to a 11% concession, seller financing, or rate buy-down credit?
- Built in 1880 — when were the roof, HVAC, electrical panel, plumbing, and water heater last replaced?
- Why hasn't it sold? Are there any deal-killer items the seller is aware of (foundation, flood, title, zoning, code violations)?
- Is there a deadline driving the sale (1031 exchange, divorce, estate, relocation)? That informs how much negotiation room exists.
- Crime grade is F in this area — have there been break-ins, vandalism, or insurance claims at this property in the last 3 years? What carrier currently insures it and at what premium?
- The area grade is low — what's the realistic commute time and amenity access for the typical tenant pool here? Any planned neighborhood developments (good or bad) we should know about?
- What's the average days-on-market for RENTAL listings here right now (not sales)? A rising rental-DOM trend means longer vacancies and softer asking-rent achievability than the comps imply.
- What's the recent tenant-quality profile in this submarket — average credit score on applications, eviction rate, late-payment / NSF rate, and stable-employment percentage? A property-management company in the area should have these aggregated.
- How much new for-sale + rental construction is in the pipeline within 1–3 miles? Heavy new supply typically softens prices + rents 12–24 months out; constrained supply supports both.
Investment metrics
- 1% rule
- 0.89% ✗
- Cap rate
- 5.76%
- Cash-on-cash
- -1.91%
- DSCR
- 0.92
- GRM
- 9.4
CMA / ARV
- ARV (median comp)
- $343,034
- List price
- $229,900
- Delta
- -32.98%
- Verdict
- UNDERPRICED
- Comps
- 20 within 1.0 mi
Show comp detail 12 sales within ~0.75 mi
| Address | Dist | Beds/Ba | Sqft | Sold | Price | $/sf | Match |
|---|---|---|---|---|---|---|---|
| 112 Perrin St | 0.12mi | 4/2.0 (-1) | 1,447 (-7%) | 4mo | $272,000 | $188 | 74 |
| 418 Pearl St | 0.19mi | 5/3.0 | 1,495 (-4%) | 14mo | $277,000 | $185 | 68 |
| 924 Congress St | 0.21mi | 4/2.0 (-1) | 1,638 (+5%) | 11mo | $310,000 | $189 | 67 |
| 118 Linden Ct | 0.24mi | 4/1.0 (-1) | 1,445 (-8%) | 3mo | $378,500 | $262 | 65 |
| 916 Pearl St | 0.18mi | 4/2.0 (-1) | 1,684 (+8%) | 13mo | $330,750 | $196 | 62 |
| 431 S Hamilton St | 0.55mi | 5/2.0 | 1,600 (+2%) | 12mo | $250,000 | $156 | 61 |
| 502 Ferris St | 0.22mi | 4/2.0 (-1) | 1,714 (+10%) | 14mo | $260,000 | $152 | 57 |
| 315 1st Ave | 0.38mi | 4/1.0 (-1) | 1,442 (-8%) | 4mo | $135,000 | $94 | 57 |
| 423 N Hamilton St | 0.41mi | 4/2.0 (-1) | 1,778 (+14%) | 3mo | $169,000 | $95 | 50 |
| 476 Hawkins St | 0.57mi | 4/2.0 (-1) | 1,624 (+4%) | 20mo | $245,000 | $151 | 45 |
| 1355 Lathers Ave | 0.71mi | 4/3.5 (-1) | 1,648 (+6%) | 6mo | $350,000 | $212 | 42 |
| 15 N Wallace Blvd | 0.55mi | 4/2.0 (-1) | 1,710 (+10%) | 19mo | $320,000 | $187 | 38 |
Match score weights: distance 35% · size 25% · config 20% · recency 20%. Top-matched comps best support the ARV.
Projected returns pro-forma
-3.0% appreciation · 3.36% rent growth · sell at horizon
- IRR
- -19.0%
- Equity multiple
- 0.33×
- Total profit
- $-42,931
- Equity at exit
- $34,279
- IRR
- -10.6%
- Equity multiple
- 0.34×
- Total profit
- $-42,289
- Equity at exit
- $19,878
Cash invested: $64,372 (down + closing). Projections, not guarantees.
Landlord ↔ Tenant lean methodology
- Overall (STATE)
- 62 Landlord-Friendly
- State Michigan
- 62 Landlord-Friendly · EVEN
- County
- — inherits STATE
- City
- — inherits STATE
ZIP-level market 48197
- Rents YoY
- 3.4%
- Active inventory
- 245
- Price-to-rent
- 9.4×
Monthly cashflow live
- Estimated rent
- $2,038 medium interval (Pro) →
- Mortgage (P&I)
- −$1,206
- Tax from tax record
- −$411 /mo · $4,935/yr
- Insurance
- −$96
- HOA
- −$0
- Vacancy / Maint / Mgmt
- −$428
- Net cashflow
- $-102
Break-even live
Sensitivity live
| Price | -10% $28 | -5% $-37 | +0% $-102 | +5% $-168 | +10% $-233 |
|---|---|---|---|---|---|
| Rent | -10% $-263 | -5% $-183 | +0% $-102 | +5% $-22 | +10% $59 |
| Rate | -1.0pp $13 | -0.5pp $-44 | base $-102 | +0.5pp $-162 | +1.0pp $-223 |
UW: 25.0% down · 7.5% · 30yr · 1.5% tax · 5.0% vac · 8.0% maint · 8.0% mgmt
Financing live
Cash to close
- Down payment
- $57,475
- Closing costs
- $6,897
- Reserves months
- —
- Total cash needed
- —
Loan-product check · same deal, 3 products live
Conventional
25% down · 7.5% · 30yr
- Down + closing
- —
- Monthly P&I
- —
- Monthly cashflow
- —
- DSCR
- —
- Eligible?
- —
Personal DTI + credit; lowest rate.
DSCR
20% down · 8.5% · 30yr
- Down + closing
- —
- Monthly P&I
- —
- Monthly cashflow
- —
- DSCR
- —
- Eligible?
- —
No personal income docs; deal must DSCR.
Hard money
10% down · 12.0% · 12mo
- Down + closing
- —
- Monthly P&I
- —
- Monthly cashflow
- —
- DSCR
- —
- Eligible?
- —
Short-term bridge; refi at stabilization.
Rent comps 5 comps
| Address | Beds | Baths | Sqft | Rent | $/sqft | DOM | Units | Dist |
|---|---|---|---|---|---|---|---|---|
| 222 N Summit St Ypsilanti, MI | 4.0 | 2.0 | 1650 | $2,400 | $1.45 | 19d | 1 | 0.21mi |
| 312 Ballard St Ypsilanti, MI | 4.0 | 3.0 | 1390 | $1,699 | $1.22 | 14d | 1 | 0.28mi |
| 138 Hawkins St Ypsilanti, MI | 4.0 | 2.0 | 1500 | $1,950 | $1.30 | 19d | 1 | 0.37mi |
| 434 N Hamilton St Ypsilanti, MI | 4.0 | 1.0 | 1228 | $1,700 | $1.38 | 19d | 1 | 0.44mi |
| 1000 N Huron River Dr Ypsilanti, MI | 1.0–4.0 | 1.0–4.0 | 937 | $2,616 | $2.79 | 3d | 1 | 0.95mi |
Listing history 23 events
-
2026-06-21days on market $229,900 Active 73 DOM
-
2026-06-18days on market $229,900 Active 70 DOM
-
2026-06-17pricedays on market $229,900 Active 69 DOM
-
2026-06-16days on market $249,000 Active 68 DOM
-
2026-06-15days on market $249,000 Active 67 DOM
-
2026-06-13days on market $249,000 Active 65 DOM
-
2026-06-09days on market $249,000 Active 61 DOM
-
2026-06-08days on market $249,000 Active 60 DOM
-
2026-06-07days on market $249,000 Active 59 DOM
-
2026-06-04days on market $249,000 Active 56 DOM
-
2026-06-03days on market $249,000 Active 55 DOM
-
2026-06-02days on market $249,000 Active 54 DOM
-
2026-06-01days on market $249,000 Active 53 DOM
-
2026-05-31days on market $249,000 Active 52 DOM
-
2026-04-09$249,000 Active 265-char remark
Show marketing remark (265 chars)
Spacious 5 bedroom home featuring an updated kitchen with dishwasher and updated bath, all within walking distance to campus. Large deck, high ceilings, spacious room sizes. Property is leased to August 2027 ($28,740/yr). Tenants pay gas, electric, and water/sewer.
-
2011-02-10soldstatus $47,700
-
2011-02-10soldstatus $47,700
-
2010-12-20$47,700
-
2010-12-20$47,700
-
2002-10-30soldstatus $155,000
-
1990-01-24soldstatus $59,900
-
1990-01-24soldstatus $45,000
ⓘ Source: listings_history table (triggers on properties + properties_extension) + one-shot
backfill from property_details.listing_events for pre-trigger history.
Tax reassessment forecast MI · Partial reset (capped growth)
- Current annual tax
- $4,935 · $411/mo
- Projected year-2 tax
- $4,935 · $411/mo
- Expected delta
- $0/yr ($0/mo · 0.0%)
ⓘ Screening estimate from a state-policy table — verify with the county assessor before closing.
Climate risk First Street
- Flood 1/10 Low FEMA zone X (unshaded) · 0% chance over 30 yrs
- Wildfire 1/10 Low
- Heat 3/10 Moderate 7 d/yr ≥99°F today · 15 d/yr by 30 yrs out
- Wind 2/10 Low
- Air quality 2/10 Low 1 unhealthy d/yr today · 2 by 30 yrs out
Nearby sold comps map
Loading sold comps map…
Walkable amenities ~0.75 mi
Loading nearby amenities…
Taxation est. · year 1
- Rental income
- $24,459
- − Mortgage interest
- −$12,878
- − Property taxes
- −$4,935
- − Insurance
- −$1,150
- − Repairs & maintenance
- −$1,957
- − Management
- −$1,957
- − Depreciation
- −$6,688
- Taxable loss
- −$5,105
- Est. tax savings @ 24.0%
- +$1,225
- After-tax cash flow
- $-4/yr
For passive investors: Depreciation is non-cash, so a rental often shows a tax loss while cash-flowing — sheltering income. Rental losses are passive: they offset passive income freely, and up to $25,000/yr can offset ordinary (W-2) income if you actively participate and your MAGI is under $100k (phasing out to $0 by $150k); unused losses carry forward. On sale, claimed depreciation is recaptured at up to 25%, and gains may owe capital-gains tax (a 1031 exchange can defer both). Figures are a year-1 estimate at your 24.0% rate — not tax advice; consult a CPA.
Schools (NCES district)
- District
- Ypsilanti Community Schools
- NCES district ID
- 2636630
- Math proficiency
- 11% ▼ -8.00%
- Reading proficiency
- 20% ▼ -3.00%
- Median HH income
- $37,759
- Composite
- 12.98/100
- National rank
- #9572
- State rank
- #501 of 540 in MI
Livability — Ypsilanti
- Score
- 81/100
- State rank
- #71
- US rank
- #1539
Category grades
Schools grade is shown separately in the Schools card above.
Census & demographics
- Census place
- Ypsilanti, MI
- County
- Washtenaw County · 306,860 people
- City population
- 105,769
- Metro
- Ann Arbor, MI
- Population (ZIP)
- 66,525
- Household income
- $73,737
- Rent vs Own
- Severe rent burden
- 3134.0
Population outlook (Washtenaw County) Hauer SSP2
- Today (2025)
- 402,878 people
- By 2030
- 424,104 · +5.3%
- By 2040
- 464,633 · +15.3%
- By 2050
- 504,728 · +25.3%
- By 2075
- 614,463 · +52.5%
- By 2100
- 676,181 · +67.8%
Race, ethnicity, and origin ACS 2023
- Neighborhood character
- Diverse neighborhood (Simpson 0.62)
- Race & ethnicity
- White 57% Black 23% Two or more races 9% Hispanic / Latino 8% Asian 6%
- Hispanic origin (detail)
- Mexican 4%
- Common ancestry
- Romanian 5% Slovak 3% Lithuanian 3%
- Foreign-born
- 12% · Canada, China, Vietnam
- Languages at home
- 84% English-only · Spanish 4% Other Indo-European 3% Arabic 3%
Political lean MEDSL · Washtenaw
- 2024 margin
- Solid D (+44.4) · D 71.0% · R 26.6% · Other 2.4%
- 2008→2024 swing
- +3.5pp toward D · 2008: 41.0pp · 2024: 44.4pp
- All cycles
- 2024: D+44.4 2020: D+46.6 2016: D+41.5 2012: D+36.0 2008: D+41.0
Not yet ingested
- Civics
- —
Market trends
- HPI YoY
- ▼ -223.94%
- Current HPI
- 217.0173
- Rent YoY
- ▲ 3.36%
- Metro
- Ann Arbor, MI
- State GDP YoY
- ▲ 1.37%
- F500 in state
- 28
Industry mix (Fortune 500 HQ in MI)
| Industry | F500 HQs | Revenue |
|---|---|---|
| Automotive Parts | 3 | $48B |
|
||
| Automotive | 2 | $372B |
|
||
| Chemicals | 1 | $45B |
|
||
| Automotive Retail | 1 | $29B |
|
||
| Healthcare / Medical Devices | 1 | $23B |
|
||
| Automotive Technology | 1 | $20B |
|
||
Price history
+315.7% since first listed9 events — show timeline
- 2026-04-09 Listed $249,000 REALCOMP
- 2026-04-09 Listed $249,000 MiRealSource-MiMLS
- 2011-02-10 Sold (MLS) $47,700 REALCOMP
- 2011-02-10 Sold (MLS) $47,700 MiRealSource-MiMLS
- 2010-12-20 Listed $47,700 REALCOMP
- 2010-12-20 Listed $47,700 MiRealSource-MiMLS
- 2002-10-30 Sold (Public Records) $155,000 Public Records
- 1990-01-24 Sold (Public Records) $45,000 Public Records
- 1990-01-24 Sold (Public Records) $59,900 Public Records
Property tax history
+1.6%/yrLatest (2025): $4,935 · -3.1% YoY. Source: county tax records.
Cash-flow waterfall
monthlySold comps — $/sqft
last 12 mo · ≤1 miLoading sold comps…