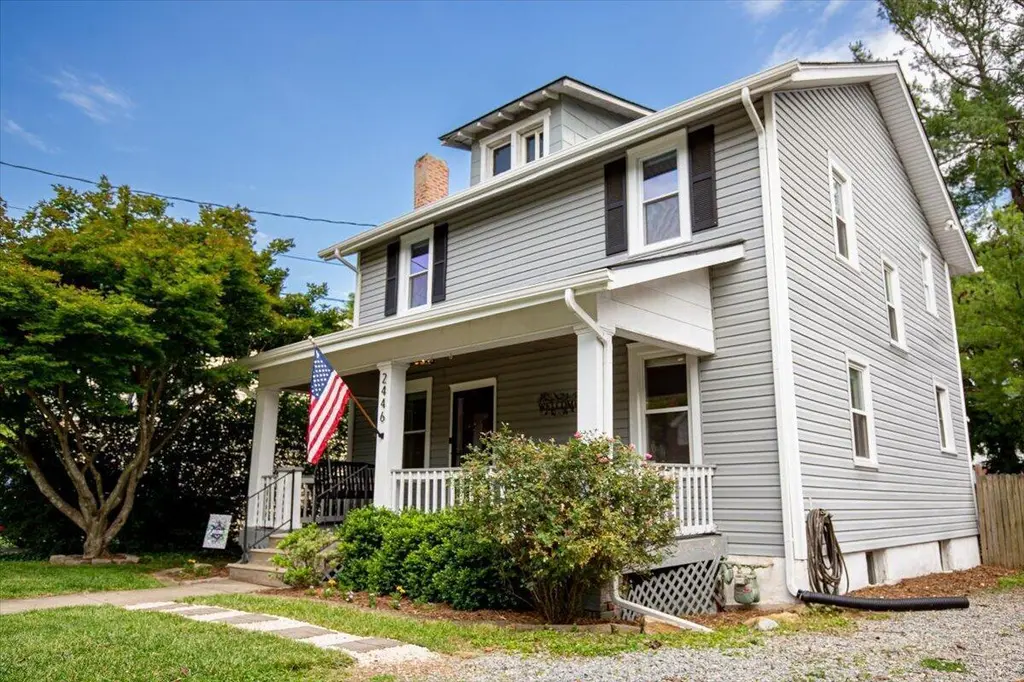
2446 Montvale Rd SW · Roanoke, VA
Flood risk 1/10 · Minimal
- FEMA flood zone
- X (unshaded)
- Chance of flooding over 30 yrs
- 0.0%
- Est. flood insurance / yr
- $473 – $860
Fire risk 1/10 · Minimal
- Est. fire insurance / yr
- $666 – $1,236
Heat risk 5/10 · Moderate
- Hot days now (above 100°F)
- 7 days/yr
- Hot days in 30 yrs
- 18 days/yr
Wind risk 2/10 · Minimal
- Chance of severe wind over 30 yrs
- 1.0%
Air-quality risk 1/10 · Minimal
- Unhealthy air days now
- 0 days/yr
- Unhealthy air days in 30 yrs
- 0 days/yr
Risk factors via First Street. Map © Google.
Why this score? — see what drove the F grade
The composite is a weighted blend of 9 inputs, each scored 0–100. Each bar is that input's sub-score; the figure is the points it added to the 100-point composite (weight × sub-score).
- Cash flow +10.3/30.0
- Rent growth +4.1/5.0
- Schools +4.1/10.0
- ARV discount +3.9/15.0
- Livability +3.7/5.0
- DSCR +3.0/10.0
- 1% rule +2.7/10.0
- Condition / age +2.5/5.0
- Appreciation +0.0/10.0
$325,000
🖨 Deal sheet (PDF) 📄 Offer letter ✓ Due diligence
Listing remarks MLS
Comfortable, affordable home in the heart of Grandin Court! You simply will not find another home w/ this combination of spaciousness, features, & prime location at as good a price. Updates in the past two years include: fully (''back to the studs'') remodeled kitchen; updated electrical panel; added deck; renovated laundry/pantry (which created an office space); some new windows; & some bathroom updates. Other features include: a broad front porch; HW floors; formal LR & DR (plus a den) on the main floor; 3 spacious BRs; basement storage; & a large, level fenced backyard. Owner offering a one-year home warranty with acceptable contract.
Key facts
- Front porch swing
- Private backyard
- Natural light
Tags
Property features AI
Finance
- Other: Lot size approximately 0.17 acre
- HOA & community: Public transport nearby; Nearby restaurants
Exterior
- Home design: Residential property; Built in 1920
- Exterior features: Front porch; Rear porch
Interior
- Kitchen: Built-in microwave
- Bedrooms: 3 bedrooms
- Flooring: Wood
- Bathrooms: 2 full bathrooms
- Heating & cooling: Forced air gas heating; Has cooling
- Interior features: Total of 8 rooms; Insulated storm doors; Tilt-in windows; Wood flooring; Fireplace
Neighborhood map
What this means for you Summary
Snapshot
- This is a 3-bed/2.0-bath single-family listed at $325k.
Deal economics
- At list price, monthly cash flow is $-178 ($-2k/yr) — negative.
- To cash-flow at today's rent, offer at most $293k (9.7% below list).
- To meet the 1% rule (rent ≥ 1% of price), the offer needs to be $250k (22.9% below list).
- Recommended offer: $250k (22.9% below list) — sets the bar for 1% rule.
- Cap rate 5.6% vs local median 4.2% in Roanoke — top-decile yield for the area; either an underpriced asset or a hidden risk that comps aren't pricing in. Stress-test before assuming the spread holds.
Location & tenants
- Location reads 73/100 on livability (#163 in VA) — a middle-class / working-renter tenant base. Strengths: cost of living A+, health & safety A+, housing A; Watch: amenities C-, employment D, crime F.
- Roanoke City Public School District (urban): math 40% / reading 58% proficiency, ranked #102 of 131 in VA (top 78%) — families likely to look elsewhere, expect single-tenant / working-renter base with shorter leases; 67% free/reduced lunch — lower-income household profile, screen leases tightly.
- Zoned schools: Grandin Court Elementary (math 87% / reading 87%, grade A+, #37 of 1,108 statewide, top 4%, 370 students, 100% FRL); Woodrow Wilson Middle (math 38% / reading 63%, grade C, #226 of 342 statewide, top 67%, 642 students, 99% FRL); Patrick Henry High (math 57% / reading 77%, grade B, #185 of 319 statewide, top 61%, 2,005 students, 95% FRL) — zoned schools average 98% FRL vs 67% district-wide (31 pts higher); higher-poverty schools than district average — tighter screening recommended.
- Zoned-school proficiency averages 68% at this address vs 49% district-wide (+19 pts) — the actual schools serving this property are materially stronger than the Roanoke City Public School District average implies; a family-tenant draw the district grade alone would hide.
- Market conditions: Rents rising fast (+6.4%/yr); 120 active listings in the ZIP; 13 comparable units currently listed for rent nearby; rentals at typical pace (median 22d on market — plan ~3-4 weeks tenant-placement turnaround); 46% of comp listings sitting > 30 days — soft ceiling on asking rent; 113 units permitted in Roanoke city in 2024 (0 in 5+ unit buildings).
Forward outlook
- Local home prices are declining (-3.0%/yr); year-one equity from $2k of loan paydown is wiped out by about $10k of value loss. Plan a longer hold.
- Roanoke County population projected at +11% by 2050 — modest demand growth; plan on rents tracking national, not racing it.
Negotiation context
- Only 14 days on market — expect competitive offers; lowballing is unlikely to land.
- 4 sale attempts since 20y ago with the ask held roughly flat each time — persistent listings suggest the price (not the market) is what's stuck; bring a comps-based counter.
- Current owner paid $170k; list at $325k implies a 91% gain — meaningful room to come down on a strong offer.
Risks & watch-outs
- Watch-outs: built in 1920 — expect roof / HVAC / electrical / plumbing capex.
- Climate carrying-cost: extreme-heat days projected 7→18/yr by 2055 (HVAC capex compounding) — expect insurance premiums to compound above CPI over the hold.
Questions for the listing agent
- What do current leases actually rent for vs. the listed asking? Can we see a recent rent roll and the last 12 months of T-12 income?
- Built in 1920 — when were the roof, HVAC, electrical panel, plumbing, and water heater last replaced?
- Is there a deadline driving the sale (1031 exchange, divorce, estate, relocation)? That informs how much negotiation room exists.
- Schools are A-rated — typically a magnet for longer-tenancy family renters. What's the average tenant stay here, and is there a school-zone premium baked into asking?
- Crime grade is F in this area — have there been break-ins, vandalism, or insurance claims at this property in the last 3 years? What carrier currently insures it and at what premium?
- The area grade is low — what's the realistic commute time and amenity access for the typical tenant pool here? Any planned neighborhood developments (good or bad) we should know about?
- What's the average days-on-market for RENTAL listings here right now (not sales)? A rising rental-DOM trend means longer vacancies and softer asking-rent achievability than the comps imply.
- What's the recent tenant-quality profile in this submarket — average credit score on applications, eviction rate, late-payment / NSF rate, and stable-employment percentage? A property-management company in the area should have these aggregated.
- How much new for-sale + rental construction is in the pipeline within 1–3 miles? Heavy new supply typically softens prices + rents 12–24 months out; constrained supply supports both.
Investment metrics
- 1% rule
- 0.77% ✗
- Cap rate
- 5.63%
- Cash-on-cash
- -2.35%
- DSCR
- 0.90
- GRM
- 10.8
CMA / ARV
- ARV (on-the-fly)
- $300,958
- Comps found
- 12
Show comp detail 12 sales within ~0.75 mi
| Address | Dist | Beds/Ba | Sqft | Sold | Price | $/sf | Match |
|---|---|---|---|---|---|---|---|
| 2529 Oregon Ave SW | 0.23mi | 4/1.5 (+1) | 1,874 (+3%) | 2mo | $361,950 | $193 | 75 |
| 2316 Fairway Dr SW | 0.39mi | 3/1.5 | 1,888 (+4%) | 0mo | $318,000 | $168 | 73 |
| 2508 Alberta Ave SW | 0.22mi | 3/1.5 | 1,995 (+10%) | 1mo | $309,250 | $155 | 70 |
| 3108 Spring Rd SW | 0.38mi | 3/1.5 | 1,658 (-8%) | 4mo | $275,000 | $166 | 63 |
| 2716 Deerfield Rd SW | 0.29mi | 3/2.0 | 2,069 (+14%) | 0mo | $329,950 | $159 | 63 |
| 3038 Dover Dr SW | 0.57mi | 3/2.5 | 1,981 (+9%) | 2mo | $300,000 | $151 | 55 |
| 2219 Langdon Rd SW | 0.53mi | 3/1.5 | 1,610 (-11%) | 2mo | $245,000 | $152 | 53 |
| 1868 Carlton Rd SW | 0.72mi | 2/1.0 (-1) | 1,831 (+1%) | 3mo | $250,750 | $137 | 53 |
| 2312 Kipling St SW | 0.66mi | 3/2.0 | 2,045 (+13%) | 4mo | $375,000 | $183 | 45 |
| 2616 Hollowdale Dr | 0.69mi | 3/2.0 | 2,084 (+15%) | 3mo | $395,000 | $190 | 40 |
| 3001 Timberlane Ave | 0.74mi | 4/3.0 (+1) | 2,006 (+11%) | 0mo | $325,000 | $162 | 38 |
| 1656 Brandon Ave SW | 0.72mi | 3/1.5 | 2,074 (+14%) | 3mo | $344,000 | $166 | 38 |
Match score weights: distance 35% · size 25% · config 20% · recency 20%. Top-matched comps best support the ARV.
Projected returns pro-forma
-3.0% appreciation · 6.39% rent growth · sell at horizon
- IRR
- -16.6%
- Equity multiple
- 0.39×
- Total profit
- $-55,211
- Equity at exit
- $48,459
- IRR
- -3.5%
- Equity multiple
- 0.74×
- Total profit
- $-23,908
- Equity at exit
- $28,100
Cash invested: $91,000 (down + closing). Projections, not guarantees.
Landlord ↔ Tenant lean methodology
- Overall (STATE)
- 55 Moderately Landlord-Leaning
- State Virginia
- 55 Moderately Landlord-Leaning · D+2
- County
- — inherits STATE
- City
- — inherits STATE
ZIP-level market 24015
- Rents YoY
- 6.4%
- Active inventory
- 120
- Price-to-rent
- 10.8×
Monthly cashflow live
- Estimated rent
- $2,505 high interval (Pro) →
- Mortgage (P&I)
- −$1,704
- Tax from tax record
- −$318 /mo · $3,810/yr
- Insurance
- −$135
- HOA
- −$0
- Vacancy / Maint / Mgmt
- −$526
- Net cashflow
- $-178
Break-even live
Sensitivity live
| Price | -10% $6 | -5% $-86 | +0% $-178 | +5% $-270 | +10% $-362 |
|---|---|---|---|---|---|
| Rent | -10% $-376 | -5% $-277 | +0% $-178 | +5% $-79 | +10% $19 |
| Rate | -1.0pp $-15 | -0.5pp $-96 | base $-178 | +0.5pp $-263 | +1.0pp $-348 |
UW: 25.0% down · 7.5% · 30yr · 1.5% tax · 5.0% vac · 8.0% maint · 8.0% mgmt
Financing live
Cash to close
- Down payment
- $81,250
- Closing costs
- $9,750
- Reserves months
- —
- Total cash needed
- —
Loan-product check · same deal, 3 products live
Conventional
25% down · 7.5% · 30yr
- Down + closing
- —
- Monthly P&I
- —
- Monthly cashflow
- —
- DSCR
- —
- Eligible?
- —
Personal DTI + credit; lowest rate.
DSCR
20% down · 8.5% · 30yr
- Down + closing
- —
- Monthly P&I
- —
- Monthly cashflow
- —
- DSCR
- —
- Eligible?
- —
No personal income docs; deal must DSCR.
Hard money
10% down · 12.0% · 12mo
- Down + closing
- —
- Monthly P&I
- —
- Monthly cashflow
- —
- DSCR
- —
- Eligible?
- —
Short-term bridge; refi at stabilization.
Rent comps 13 comps
| Address | Beds | Baths | Sqft | Rent | $/sqft | DOM | Units | Dist |
|---|---|---|---|---|---|---|---|---|
| 2615 Laburnum Ave SW Roanoke, VA | 2.0 | 1.5 | 1323 | $1,800 | $1.36 | 44d | 1 | 0.60mi |
| 2615 Laburnum Ave SW Roanoke, VA | 2.0 | 1.5 | 1323 | $1,825 | $1.38 | 21d | 1 | 0.60mi |
| 2923 Evergreen Ln SW Roanoke, VA | 4.0 | 3.5 | 2240 | $3,195 | $1.43 | 21d | 1 | 0.61mi |
| 2917 Evergreen Ln SW Roanoke, VA | 4.0 | 3.5 | 2240 | $3,195 | $1.43 | 21d | 1 | 0.61mi |
| 2911 Evergreen Ln SW Roanoke, VA | 4.0 | 3.5 | 2240 | $3,195 | $1.43 | 21d | 1 | 0.61mi |
| 3419 Evergreen Ln SW Roanoke, VA | 4.0 | 3.5 | 2240 | $3,195 | $1.43 | 44d | 1 | 0.63mi |
| 3427 Evergreen Ln SW Roanoke, VA | 4.0 | 3.5 | 2240 | $3,195 | $1.43 | 44d | 1 | 0.63mi |
| 3423 Evergreen Ln SW Roanoke, VA | 4.0 | 3.5 | 2240 | $3,195 | $1.43 | 44d | 1 | 0.63mi |
| 1668 Brandon Ave SW Roanoke, VA | 3.0 | 1.0 | 1552 | $1,849 | $1.19 | 44d | 1 | 0.71mi |
| 3711 Crescent Ridge Dr SW Roanoke, VA | 4.0 | 2.5 | 2232 | $2,899 | $1.30 | 21d | 1 | 0.82mi |
| 3602 Colonial Green Cir SW Roanoke, VA | 3.0 | 2.5 | 1670 | $2,622 | $1.57 | 14d | 1 | 0.86mi |
| 1709 Sherwood Ave SW Roanoke, VA | 2.0 | 1.0 | 1271 | $1,650 | $1.30 | 44d | 1 | 1.00mi |
| 3345 Circle Brook Dr Cave Spring, VA | 1.0–3.0 | 1.0–2.0 | 997 | $1,920 | $1.92 | 14d | 11 | 1.29mi |
Listing history 11 events
-
2026-06-18days on market $325,000 Active 14 DOM
-
2026-06-17days on market $325,000 Active 13 DOM
-
2026-06-16days on market $325,000 Active 12 DOM
-
2026-06-15days on market $325,000 Active 11 DOM
-
2026-06-14days on market $325,000 Active 9 DOM
-
2026-06-13days on market $325,000 Active 8 DOM
-
2026-06-10days on market $325,000 Active 6 DOM
-
2026-06-09days on market $325,000 Active 5 DOM
-
2026-06-08days on market $325,000 Active 4 DOM
-
2026-06-05remarks 546-char remark
-
2026-06-05$325,000 Active 1 DOM
ⓘ Source: listings_history table (triggers on properties + properties_extension) + one-shot
backfill from property_details.listing_events for pre-trigger history.
Tax reassessment forecast VA · Resets to sale price
- Current annual tax
- $3,810 · $318/mo
- Projected year-2 tax
- $3,810 · $318/mo
- Expected delta
- $0/yr ($0/mo · 0.0%)
ⓘ Screening estimate from a state-policy table — verify with the county assessor before closing.
Climate risk First Street
- Flood 1/10 Low FEMA zone X (unshaded) · 0% chance over 30 yrs
- Wildfire 1/10 Low
- Heat 5/10 Major 7 d/yr ≥100°F today · 18 d/yr by 30 yrs out
- Wind 2/10 Low 100% chance of damaging wind over 30 yrs
- Air quality 1/10 Low 0 unhealthy d/yr today · 0 by 30 yrs out
Nearby sold comps map
Loading sold comps map…
Walkable amenities ~0.75 mi
Loading nearby amenities…
Taxation est. · year 1
- Rental income
- $30,058
- − Mortgage interest
- −$18,205
- − Property taxes
- −$3,810
- − Insurance
- −$1,625
- − Repairs & maintenance
- −$2,405
- − Management
- −$2,405
- − Depreciation
- −$9,455
- Taxable loss
- −$7,846
- Est. tax savings @ 24.0%
- +$1,883
- After-tax cash flow
- $-258/yr
For passive investors: Depreciation is non-cash, so a rental often shows a tax loss while cash-flowing — sheltering income. Rental losses are passive: they offset passive income freely, and up to $25,000/yr can offset ordinary (W-2) income if you actively participate and your MAGI is under $100k (phasing out to $0 by $150k); unused losses carry forward. On sale, claimed depreciation is recaptured at up to 25%, and gains may owe capital-gains tax (a 1031 exchange can defer both). Figures are a year-1 estimate at your 24.0% rate — not tax advice; consult a CPA.
Schools (NCES district)
- District
- Roanoke City Public School District
- NCES district ID
- 5103300
- Math proficiency
- 40% ▼ -38.00%
- Reading proficiency
- 58% ▼ -12.00%
- Median HH income
- $38,592
- Composite
- 40.8/100
- National rank
- #3639
- State rank
- #102 of 131 in VA
Livability — Roanoke
- Score
- 73/100
- State rank
- #163
- US rank
- #5055
Category grades
Schools grade is shown separately in the Schools card above.
Census & demographics
- Census place
- Roanoke, VA
- County
- Roanoke City · 101,625 people
- City population
- 168,930
- Metro
- Roanoke, VA
- Population (ZIP)
- 15,865
- Household income
- $69,831
- Rent vs Own
- Severe rent burden
- 525.0
Population outlook (Roanoke County) Hauer SSP2
- Today (2025)
- 106,094 people
- By 2030
- 108,927 · +2.7%
- By 2040
- 114,104 · +7.5%
- By 2050
- 118,032 · +11.3%
- By 2075
- 123,363 · +16.3%
- By 2100
- 116,827 · +10.1%
Race, ethnicity, and origin ACS 2023
- Neighborhood character
- Predominantly White (83%)
- Race & ethnicity
- White 83% Two or more races 7% Black 5% Hispanic / Latino 5% Asian 2%
- Common ancestry
- Italian 5% Slovak 3% Serbian 2%
- Foreign-born
- 4% · Canada, Jamaica
- Languages at home
- 95% English-only · Spanish 2% Tagalog/Filipino 1% Other Indo-European 1%
Political lean MEDSL · Roanoke
- 2024 margin
- Strong D (+23.6) · D 61.1% · R 37.5% · Other 1.4%
- 2008→2024 swing
- +0.2pp no change · 2008: 23.4pp · 2024: 23.6pp
- All cycles
- 2024: D+23.6 2020: D+25.8 2016: D+17.6 2012: D+21.5 2008: D+23.4
Not yet ingested
- Civics
- —
Market trends
- HPI YoY
- ▼ -333.83%
- Current HPI
- 192.3108
- Rent YoY
- ▲ 6.39%
- Metro
- Roanoke, VA
- State GDP YoY
- ▲ 2.40%
- F500 in state
- 50
Industry mix (Fortune 500 HQ in VA)
| Industry | F500 HQs | Revenue |
|---|---|---|
| Aerospace / Defense | 4 | $236B |
|
||
| Technology / Defense | 3 | $32B |
|
||
| Financial Services | 2 | $176B |
|
||
| Utilities | 2 | $27B |
|
||
| Insurance | 2 | $25B |
|
||
| Technology | 2 | $15B |
|
||
Price history
+606.5% since first listed12 events — show timeline
- 2026-06-04 Listed $325,000 MLSRV
- 2018-08-16 Sold (Public Records) $170,000 Public Records
- 2018-08-15 Sold (MLS) $170,000 MLSRV
- 2018-06-22 Listed $159,950 MLSRV
- 2016-05-31 Listing Removed — MLSRV
- 2016-05-23 Listed $139,000 MLSRV
- 2007-02-15 Sold (MLS) $137,950 MLSRV
- 2007-01-30 Sold (Public Records) $137,950 Public Records
- 2007-01-30 Sold (Public Records) $137,950 Public Records
- 2006-12-06 Listed $137,950 MLSRV
- 1989-01-27 Sold (Public Records) $56,500 Public Records
- 1988-09-01 Sold (Public Records) $46,000 Public Records
Property tax history
+9.0%/yrLatest (2025): $3,810 · +10.2% YoY. Source: county tax records.
Cash-flow waterfall
monthlySold comps — $/sqft
last 12 mo · ≤1 miLoading sold comps…