60 N State Route 101 #77 · Tiffin, OH
Flood risk No data
- FEMA flood zone
- —
- Chance of flooding over 30 yrs
- —
- Est. flood insurance / yr
- —
Fire risk No data
- Est. fire insurance / yr
- —
Heat risk No data
- Hot days now (above threshold)
- —
- Hot days in 30 yrs
- —
Wind risk No data
- Chance of severe wind over 30 yrs
- —
Air-quality risk No data
- Unhealthy air days now
- —
- Unhealthy air days in 30 yrs
- —
Risk factors via First Street. Map © Google.
Why this score? — see what drove the C grade
The composite is a weighted blend of 9 inputs, each scored 0–100. Each bar is that input's sub-score; the figure is the points it added to the 100-point composite (weight × sub-score).
- Cash flow +21.0/30.0
- 1% rule +10.0/10.0
- DSCR +6.7/10.0
- ARV discount +4.7/15.0
- Schools +4.5/10.0
- Livability +4.0/5.0
- Rent growth +2.5/5.0
- Condition / age +2.2/5.0
- Appreciation +0.0/10.0
$47,900
🖨 Deal sheet 📄 Offer letter ✓ Due diligence
Listing remarks
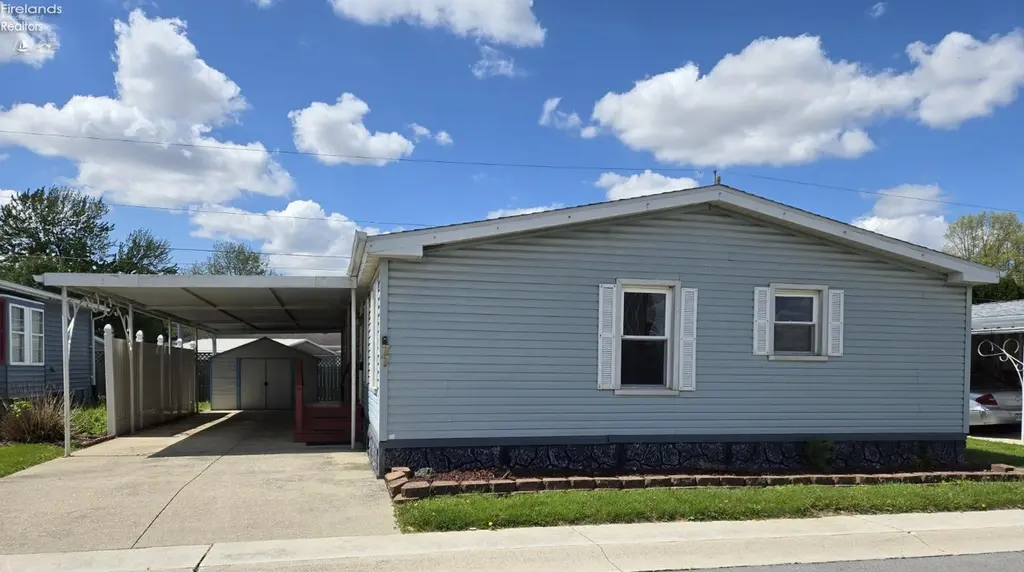
Enjoy this charming and affordable 3 bedroom, 2 full bath double wide mobile home located in the desirable Clinton Mobile Home Park. This home offers comfortable living with an open floor plan. The bright living room flows into a formal dining area. The kitchen is spacious, offering amble cabinetry, plenty of workspace, and an eating area. The large primary suite features a private bathroom, 2 walk-in closets and plenty of storage area. The additional bedrooms offer flexibility for family, guests, or a home office. The covered carport offers an area for relaxing and entertaining along with a nice storage shed. This is a 55+ community. Sale is subject to completion of an application and bein
Key facts
- Open floor plan
- Ample cabinetry
- Eating area
Tags
Property features AI
Finance
- HOA & community: Homeowners association with monthly fee of $601; Community pool
Exterior
- Parking: Attached 2-car garage
- Utilities: Public water; Public sewer
- Home design: Residential mobile home
- Construction: Vinyl siding; Asphalt roof
- Exterior features: Outdoor in-ground pool; Shed(s)
Interior
- Kitchen: Dishwasher; Range; Refrigerator; Disposal
- Bathrooms: 2 full bathrooms
- Heating & cooling: Central air; Ceiling fan(s); Natural gas heating; Forced air heating
- Interior features: Dishwasher; Disposal; Range; Refrigerator; Crawl space basement
Neighborhood map
What this means for you Summary
Snapshot
- This is a 3-bed/2.0-bath manufactured listed at $48k. Condition is rated fair.
Deal economics
- At list price, monthly cash flow is $67 ($806/yr) — positive.
- The deal already cash-flows at list — no discount required.
- Meets the 1% rule at list price ($1k rent vs $48k).
- Recommended offer: $46k (3.0% below list) — sets the bar for market timing.
- Cap rate 8.0% vs local median 3.7% in Tiffin — top-decile yield for the area; either an underpriced asset or a hidden risk that comps aren't pricing in. Stress-test before assuming the spread holds.
Location & tenants
- Location reads 81/100 on livability (#88 in OH, #1,313 nationally) — a professional / high-income tenant draw. Strengths: amenities A+, cost of living A+, housing A+; Watch: crime C-, employment D, commute F.
- Tiffin City (town): math 49% / reading 60% proficiency, ranked #393 of 656 in OH (top 60%) — acceptable for families but not a draw, mixed tenant base, ~2y average lease.
- Market conditions: 65 active listings in the ZIP; 45 units permitted in Seneca County in 2024 (0 in 5+ unit buildings).
Forward outlook
- Local home prices are declining (-3.0%/yr); year-one equity from $331 of loan paydown is wiped out by about $1k of value loss. Plan a longer hold.
- Seneca County population projected at -14% by 2050 — secular population decline; favor cash flow + early exit over multi-decade hold.
Negotiation context
- It's been on market 42 days — a 3% lower offer ($46k) is reasonable based on typical stale-listing flexibility.
Risks & watch-outs
- Watch-outs: HOA is 48% of rent.
Questions for the listing agent
- It's been on market 42 days. Have you received any prior offers? Is the seller open to a 3% concession, seller financing, or rate buy-down credit?
- Have any recent inspections been done? Can we get a copy of the seller's disclosures and any deferred-maintenance estimates?
- What does the HOA fee cover, when was the last increase, and are there any pending special assessments or reserve-fund shortfalls?
- Is there a deadline driving the sale (1031 exchange, divorce, estate, relocation)? That informs how much negotiation room exists.
- Schools are B-rated — typically a magnet for longer-tenancy family renters. What's the average tenant stay here, and is there a school-zone premium baked into asking?
- What's the average days-on-market for RENTAL listings here right now (not sales)? A rising rental-DOM trend means longer vacancies and softer asking-rent achievability than the comps imply.
- What's the recent tenant-quality profile in this submarket — average credit score on applications, eviction rate, late-payment / NSF rate, and stable-employment percentage? A property-management company in the area should have these aggregated.
- How much new for-sale + rental construction is in the pipeline within 1–3 miles? Heavy new supply typically softens prices + rents 12–24 months out; constrained supply supports both.
Investment metrics
- 1% rule
- 2.64% ✓
- Cap rate
- 7.98%
- Cash-on-cash
- 6.01%
- DSCR
- 1.27
- GRM
- 3.2
CMA / ARV
- ARV (median comp)
- $45,119
- List price
- $47,900
- Delta
- 6.16%
- Verdict
- FAIR
- Comps
- 3 within 1.0 mi
Show comp detail 1 sale within ~0.75 mi
| Address | Dist | Beds/Ba | Sqft | Sold | Price | $/sf | Match |
|---|---|---|---|---|---|---|---|
| 60 N State Route 101 Lot 115 | 0.00mi | 3/2.0 | 1,560 (-0%) | 5mo | $51,000 | $33 | 95 |
Match score weights: distance 35% · size 25% · config 20% · recency 20%. Top-matched comps best support the ARV.
Projected returns pro-forma
-3.0% appreciation · 3.0% rent growth · sell at horizon
- IRR
- -6.2%
- Equity multiple
- 0.77×
- Total profit
- $-3,096
- Equity at exit
- $7,142
- IRR
- 4.3%
- Equity multiple
- 1.33×
- Total profit
- $4,391
- Equity at exit
- $4,142
Cash invested: $13,412 (down + closing). Projections, not guarantees.
Landlord ↔ Tenant lean methodology
- Overall (STATE)
- 73 Landlord-Friendly
- State Ohio
- 73 Landlord-Friendly · R+6
- County
- — inherits STATE
- City
- — inherits STATE
ZIP-level market 44883
- Active inventory
- 65
- Price-to-rent
- 3.2×
Monthly cashflow live
- Estimated rent
- $1,265 medium interval (Pro) →
- Mortgage (P&I)
- −$251
- Tax est. 1.5%
- −$60 /mo · $718/yr
- Insurance
- −$20
- HOA
- −$601
- Vacancy / Maint / Mgmt
- −$266
- Net cashflow
- $67
Break-even live
UW: 25.0% down · 7.5% · 30yr · 1.5% tax · 5.0% vac · 8.0% maint · 8.0% mgmt
Financing live
Cash to close
- Down payment
- $11,975
- Closing costs
- $1,437
- Reserves months
- —
- Total cash needed
- —
Loan-product check · same deal, 3 products live
Conventional
25% down · 7.5% · 30yr
- Down + closing
- —
- Monthly P&I
- —
- Monthly cashflow
- —
- DSCR
- —
- Eligible?
- —
Personal DTI + credit; lowest rate.
DSCR
20% down · 8.5% · 30yr
- Down + closing
- —
- Monthly P&I
- —
- Monthly cashflow
- —
- DSCR
- —
- Eligible?
- —
No personal income docs; deal must DSCR.
Hard money
10% down · 12.0% · 12mo
- Down + closing
- —
- Monthly P&I
- —
- Monthly cashflow
- —
- DSCR
- —
- Eligible?
- —
Short-term bridge; refi at stabilization.
HOA detail
- Monthly dues
- $601 · $7,212/yr
Listing history 16 events
-
2026-06-19days on market $47,900 Active 42 DOM
-
2026-06-18days on market $47,900 Active 41 DOM
-
2026-06-17days on market $47,900 Active 40 DOM
-
2026-06-16days on market $47,900 Active 39 DOM
-
2026-06-15days on market $47,900 Active 38 DOM
-
2026-06-14days on market $47,900 Active 36 DOM
-
2026-06-12days on market $47,900 Active 35 DOM
-
2026-06-09days on market $47,900 Active 32 DOM
-
2026-06-08days on market $47,900 Active 31 DOM
-
2026-06-07pricedays on market $47,900 Active 30 DOM
-
2026-06-03days on market $49,900 Active 26 DOM
-
2026-06-02days on market $49,900 Active 25 DOM
-
2026-06-01days on market $49,900 Active 24 DOM
-
2026-05-31days on market $49,900 Active 23 DOM
-
2026-05-30days on market $49,900 Active 22 DOM
-
2026-05-07$49,900 Active 879-char remark
ⓘ Source: listings_history table (triggers on properties + properties_extension) + one-shot
backfill from property_details.listing_events for pre-trigger history.
Nearby sold comps map
Loading sold comps map…
Walkable amenities ~0.75 mi
Loading nearby amenities…
Taxation est. · year 1
- Rental income
- $15,178
- − Mortgage interest
- −$2,683
- − Property taxes
- −$718
- − Insurance
- −$240
- − Repairs & maintenance
- −$1,214
- − Management
- −$1,214
- − HOA
- −$7,212
- − Depreciation
- −$1,393
- Taxable income
- $503
- Est. tax owed @ 24.0%
- −$121
- After-tax cash flow
- $685/yr
For passive investors: Depreciation is non-cash, so a rental often shows a tax loss while cash-flowing — sheltering income. Rental losses are passive: they offset passive income freely, and up to $25,000/yr can offset ordinary (W-2) income if you actively participate and your MAGI is under $100k (phasing out to $0 by $150k); unused losses carry forward. On sale, claimed depreciation is recaptured at up to 25%, and gains may owe capital-gains tax (a 1031 exchange can defer both). Figures are a year-1 estimate at your 24.0% rate — not tax advice; consult a CPA.
Condition & rehab AI · 22 photos
This mobile home requires moderate renovations to improve its condition and increase its value for resale and rental.
Repairs flagged
- Moderate kitchen cabinets — dated and in need of replacement
- Moderate bathroom fixtures — dated and in need of replacement
- Moderate flooring — carpeted and in need of replacement
- Moderate interior walls — paint peeling and textured walls
- Minor exterior siding — light discoloration
Value-add opportunities
- Both update kitchen and bathrooms — modernizing will attract more buyers and renters
- Both paint exterior — fresh paint will improve curb appeal
- Both replace carpet — new flooring will make the home more appealing
Renovation cost estimate screening
| Repair item | Severity | Est. cost |
|---|---|---|
| kitchen cabinets · dated and in need of replacement | Moderate | $3,000–15,000 |
| bathroom fixtures · dated and in need of replacement | Moderate | $3,000–15,000 |
| flooring · carpeted and in need of replacement | Moderate | $3,000–15,000 |
| interior walls · paint peeling and textured walls | Moderate | $3,000–15,000 |
| exterior siding · light discoloration | Minor | $500–3,000 |
| Total estimated repair cost · 5 items | $12,500–63,000 |
Value-add ROI direction
- Both update kitchen and bathrooms — modernizing will attract more buyers and renters ↑
- Both paint exterior — fresh paint will improve curb appeal ↑
- Both replace carpet — new flooring will make the home more appealing ↑
ⓘ Cost ranges are severity-bucket heuristics (US national rule-of-thumb). Get contractor quotes + a written scope before underwriting a rehab budget.
Schools (NCES district)
- District
- Tiffin City
- NCES district ID
- 3904489
- Math proficiency
- 49% ▼ -17.00%
- Reading proficiency
- 60% ▼ -7.00%
- Median HH income
- $39,074
- Composite
- 45.43/100
- National rank
- #2621
- State rank
- #393 of 656 in OH
Livability — Tiffin
- Score
- 81/100
- State rank
- #88
- US rank
- #1313
Category grades
Schools grade is shown separately in the Schools card above.
Census & demographics
- County
- Seneca County · 28,102 people
- City population
- 28,102
- Metro
- Tiffin, OH
- Population (ZIP)
- 28,102
- Household income
- $62,692
- Rent vs Own
- Severe rent burden
- 772.0
Population outlook (Seneca County) Hauer SSP2
- Today (2025)
- 54,243 people
- By 2030
- 52,947 · -2.4%
- By 2040
- 49,842 · -8.1%
- By 2050
- 46,689 · -13.9%
- By 2075
- 39,889 · -26.5%
- By 2100
- 32,155 · -40.7%
Race, ethnicity, and origin ACS 2023
- Neighborhood character
- Predominantly White (90%)
- Race & ethnicity
- White 90% Hispanic / Latino 4% Two or more races 3% Black 3%
- Common ancestry
- Romanian 2% Lithuanian 2% Slovak 1%
- Foreign-born
- 1%
- Languages at home
- 97% English-only · Spanish 1%
Political lean MEDSL · Seneca
- 2024 margin
- Solid R (+37.5) · D 30.7% · R 68.2% · Other 1.0%
- 2008→2024 swing
- -34.8pp toward R · 2008: -2.7pp · 2024: -37.5pp
- All cycles
- 2024: R+37.5 2020: R+34.2 2016: R+31.2 2012: R+8.4 2008: R+2.7
Not yet ingested
- Civics
- —
Market trends
- HPI YoY
- ▼ -186.24%
- Current HPI
- 215.4289
- Rent YoY
- —
- Metro
- Tiffin, OH
- State GDP YoY
- ▲ 1.98%
- F500 in state
- 48
Industry mix (Fortune 500 HQ in OH)
| Industry | F500 HQs | Revenue |
|---|---|---|
| Insurance | 3 | $145B |
|
||
| Industrial Machinery | 3 | $49B |
|
||
| Financial Services | 3 | $24B |
|
||
| Consumer Goods | 2 | $93B |
|
||
| Aerospace / Defense | 2 | $47B |
|
||
| Utilities | 2 | $33B |
|
||
Price history
-4.0% since first listed2 events — show timeline
- 2026-06-03 Price Changed $47,900 FAOR
- 2026-05-07 Listed $49,900 FAOR
Cash-flow waterfall
monthlySold comps — $/sqft
last 12 mo · ≤1 miLoading sold comps…