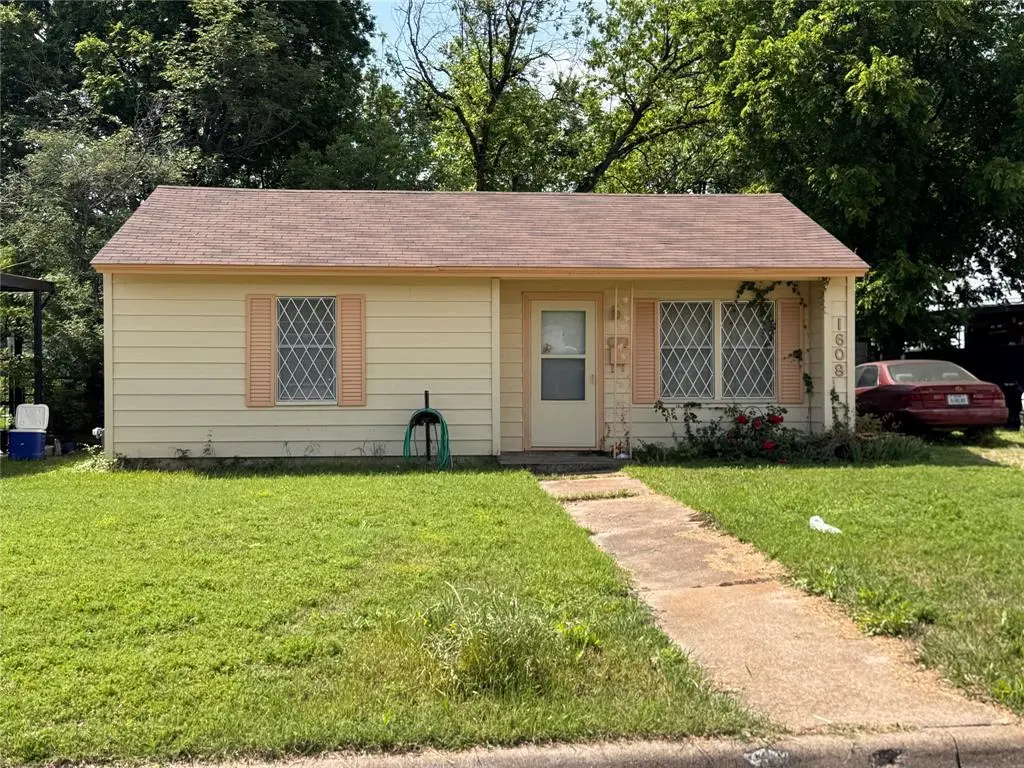
1608 Bell Ave · Blue Mound, TX
Flood risk 1/10 · Minimal
- FEMA flood zone
- X (unshaded)
- Chance of flooding over 30 yrs
- 0.0%
- Est. flood insurance / yr
- $507 – $1,088
Fire risk 4/10 · Minor
- Est. fire insurance / yr
- $1,222 – $2,270
Heat risk 7/10 · Major
- Hot days now (above 109°F)
- 7 days/yr
- Hot days in 30 yrs
- 21 days/yr
Wind risk 4/10 · Minor
- Chance of severe wind over 30 yrs
- 21.0%
Air-quality risk 4/10 · Minor
- Unhealthy air days now
- 4 days/yr
- Unhealthy air days in 30 yrs
- 5 days/yr
Risk factors via First Street. Map © Google.
Why this score? — see what drove the B grade
The composite is a weighted blend of 9 inputs, each scored 0–100. Each bar is that input's sub-score; the figure is the points it added to the 100-point composite (weight × sub-score).
- Cash flow +28.2/30.0
- ARV discount +15.0/15.0
- DSCR +10.0/10.0
- 1% rule +8.9/10.0
- Schools +3.5/10.0
- Livability +3.5/5.0
- Rent growth +2.5/5.0
- Condition / age +2.5/5.0
- Appreciation +0.0/10.0
$150,000
🖨 Deal sheet (PDF) 📄 Offer letter ✓ Due diligence
Listing remarks
Great flip opportunity in Blue Mound! Easy access to 820. Property is being sold as is, where is. Cash only.
Key facts
- 7,928 sq ft lot
- Garage
- Built 1954
Property features AI
Finance
- Other: Property type: Single Family Residence; Will subdivide: Subdivided
- Financial info: Listing terms: Cash
- HOA & community: No HOA / association
Exterior
- Parking: Attached garage with workshop area; 1 garage space; 1 covered parking space
- Utilities: City water; City sewer; Cable available; Individual gas meter
- Home design: Single-family residence; Residential property; One story; Preowned (built in 1954); Subdivision: Saginaw Park Add
- Construction: Siding and wood exterior; Composition roof; Slab foundation; Built in 1954
- Exterior features: Chain link fencing; Few trees on the lot; Concrete and curbs
Interior
- Kitchen: Gas range; Microwave; Refrigerator water line (water line to refrigerator)
- Bedrooms: 3 bedrooms (all on the main level); Primary bedroom on the main level
- Flooring: Laminate flooring; Vinyl flooring
- Bathrooms: 2 full bathrooms
- Heating & cooling: Central heating (natural gas); Central air conditioning
- Interior features: Cable TV available; High-speed internet available; Window coverings; Seven total rooms; Two living areas; One dining area; One-level layout
- Laundry & utility: Washer hookup; Electric dryer hookup; Full-size washer/dryer area
Neighborhood map
What this means for you Summary
Snapshot
- This is a 3-bed/1.0-bath single-family listed at $150k.
Deal economics
- At list price, monthly cash flow is $476 ($6k/yr) — positive.
- The deal already cash-flows at list — no discount required.
- Meets the 1% rule at list price ($2k rent vs $150k).
- Recommended offer: $146k (3.0% below list) — sets the bar for market timing.
Location & tenants
- Location reads 70/100 on livability (#390 in TX) — a middle-class / working-renter tenant base. Strengths: crime A+, cost of living A+, housing A+; Watch: employment D+, amenities F, commute F.
- Eagle Mt-Saginaw ISD (urban): math 35% / reading 42% proficiency, ranked #361 of 826 in TX (top 44%) — families likely to look elsewhere, expect single-tenant / working-renter base with shorter leases.
- Zoned schools: L A Gililland El (math 28% / reading 31%, grade F, #2,525 of 4,322 statewide, top 62%, 485 students, 76% FRL) — zoned schools average 76% FRL vs 36% district-wide (40 pts higher); higher-poverty schools than district average — tighter screening recommended.
- Market conditions: Rents soft (-0.2%/yr); 471 active listings in the ZIP; 31 comparable units currently listed for rent nearby; rentals leasing fast (median 8d on market — plan ~1-2 weeks tenant-placement turnaround); solid renter incomes; 18,938 units permitted in Tarrant County in 2024 (8,336 in 5+ unit buildings).
Forward outlook
- Local home prices are declining (-3.0%/yr); year-one equity from $1k of loan paydown is wiped out by about $4k of value loss. Plan a longer hold.
- Tarrant County population projected at +41% by 2050 — long-run rental-demand tailwind backs the buy-and-hold thesis.
Negotiation context
- It's been on market 50 days — a 3% lower offer ($146k) is reasonable based on typical stale-listing flexibility.
Risks & watch-outs
- Watch-outs: property tax is 2.6% of price; built in 1954 — expect roof / HVAC / electrical / plumbing capex.
- Climate carrying-cost: extreme-heat days projected 7→21/yr by 2055 (HVAC capex compounding) — expect insurance premiums to compound above CPI over the hold.
Questions for the listing agent
- It's been on market 50 days. Have you received any prior offers? Is the seller open to a 3% concession, seller financing, or rate buy-down credit?
- Built in 1954 — when were the roof, HVAC, electrical panel, plumbing, and water heater last replaced?
- Property tax is high relative to price — has the assessment been appealed recently, and will the sale trigger a re-assessment?
- Is there a deadline driving the sale (1031 exchange, divorce, estate, relocation)? That informs how much negotiation room exists.
- Schools are F-rated, which usually means shorter tenancies and higher turnover. Who's the typical renter profile here, and what's been the actual vacancy rate?
- What's the average days-on-market for RENTAL listings here right now (not sales)? A rising rental-DOM trend means longer vacancies and softer asking-rent achievability than the comps imply.
- What's the recent tenant-quality profile in this submarket — average credit score on applications, eviction rate, late-payment / NSF rate, and stable-employment percentage? A property-management company in the area should have these aggregated.
- How much new for-sale + rental construction is in the pipeline within 1–3 miles? Heavy new supply typically softens prices + rents 12–24 months out; constrained supply supports both.
Investment metrics
- 1% rule
- 1.39% ✓
- Cap rate
- 10.10%
- Cash-on-cash
- 13.59%
- DSCR
- 1.60
- GRM
- 6.0
CMA / ARV
- ARV (on-the-fly)
- $238,196
- Comps found
- 12
Show comp detail 12 sales within ~0.75 mi
| Address | Dist | Beds/Ba | Sqft | Sold | Price | $/sf | Match |
|---|---|---|---|---|---|---|---|
| 1712 Glenn Dr | 0.22mi | 4/1.0 (+1) | 1,302 (-1%) | 3mo | $149,900 | $115 | 81 |
| 1712 Canyon Rdg | 0.35mi | 3/2.0 | 1,314 (-0%) | 2mo | $256,900 | $196 | 78 |
| 1708 Canyon Ridge St | 0.35mi | 3/2.0 | 1,254 (-5%) | 7mo | $245,000 | $195 | 66 |
| 129 Collins Ct | 0.37mi | 3/2.0 | 1,190 (-10%) | 5mo | $199,000 | $167 | 59 |
| 1929 Overland St | 0.58mi | 3/2.0 | 1,402 (+6%) | 2mo | $250,000 | $178 | 57 |
| 1604 Tyson St | 0.30mi | 3/1.5 | 1,161 (-12%) | 9mo | $205,995 | $177 | 57 |
| 1833 Capulin Rd | 0.69mi | 3/2.0 | 1,359 (+3%) | 9mo | $295,000 | $217 | 51 |
| 1755 Tyson St | 0.43mi | 4/2.0 (+1) | 1,437 (+9%) | 9mo | $249,900 | $174 | 48 |
| 2109 Sweetwood Dr | 0.70mi | 3/2.0 | 1,439 (+9%) | 0mo | $260,000 | $181 | 47 |
| 1768 Americana Blvd | 0.53mi | 3/2.0 | 1,174 (-11%) | 8mo | $195,000 | $166 | 47 |
| 5957 Missy Ln | 0.75mi | 3/2.0 | 1,412 (+7%) | 8mo | $275,000 | $195 | 42 |
| 6468 Payton Dr | 0.62mi | 3/2.0 | 1,474 (+12%) | 9mo | $299,900 | $203 | 39 |
Match score weights: distance 35% · size 25% · config 20% · recency 20%. Top-matched comps best support the ARV.
Projected returns pro-forma
-3.0% appreciation · 0.0% rent growth · sell at horizon
- IRR
- -0.0%
- Equity multiple
- 1.00×
- Total profit
- $-18
- Equity at exit
- $22,365
- IRR
- 5.9%
- Equity multiple
- 1.38×
- Total profit
- $15,820
- Equity at exit
- $12,969
Cash invested: $42,000 (down + closing). Projections, not guarantees.
Landlord ↔ Tenant lean methodology
- Overall (STATE)
- 87 Strongly Landlord-Friendly
- State Texas
- 87 Strongly Landlord-Friendly · R+5
- County
- — inherits STATE
- City
- — inherits STATE
ZIP-level market 76131
- Home prices YoY
- -15.6%
- Rents YoY
- -0.2%
- Active inventory
- 471
- Price-to-rent
- 6.0×
Monthly cashflow live
- Estimated rent
- $2,087 high interval (Pro) →
- Mortgage (P&I)
- −$787
- Tax from tax record
- −$324 /mo · $3,887/yr
- Insurance
- −$62
- HOA
- −$0
- Vacancy / Maint / Mgmt
- −$438
- Net cashflow
- $476
Break-even live
Sensitivity live
| Price | -10% $560 | -5% $518 | +0% $476 | +5% $433 | +10% $391 |
|---|---|---|---|---|---|
| Rent | -10% $311 | -5% $393 | +0% $476 | +5% $558 | +10% $640 |
| Rate | -1.0pp $551 | -0.5pp $514 | base $476 | +0.5pp $437 | +1.0pp $397 |
UW: 25.0% down · 7.5% · 30yr · 1.5% tax · 5.0% vac · 8.0% maint · 8.0% mgmt
Financing live
Cash to close
- Down payment
- $37,500
- Closing costs
- $4,500
- Reserves months
- —
- Total cash needed
- —
Loan-product check · same deal, 3 products live
Conventional
25% down · 7.5% · 30yr
- Down + closing
- —
- Monthly P&I
- —
- Monthly cashflow
- —
- DSCR
- —
- Eligible?
- —
Personal DTI + credit; lowest rate.
DSCR
20% down · 8.5% · 30yr
- Down + closing
- —
- Monthly P&I
- —
- Monthly cashflow
- —
- DSCR
- —
- Eligible?
- —
No personal income docs; deal must DSCR.
Hard money
10% down · 12.0% · 12mo
- Down + closing
- —
- Monthly P&I
- —
- Monthly cashflow
- —
- DSCR
- —
- Eligible?
- —
Short-term bridge; refi at stabilization.
Rent comps 31 comps
| Address | Beds | Baths | Sqft | Rent | $/sqft | DOM | Units | Dist |
|---|---|---|---|---|---|---|---|---|
| 1628 Americana Blvd Blue Mound, TX | 3.0 | 2.0 | 1196 | $1,850 | $1.55 | 8d | 1 | 0.33mi |
| 829 Minuteman Dr Blue Mound, TX | 3.0 | 2.0 | 1509 | $2,140 | $1.42 | 3d | 1 | 0.62mi |
| 1764 Independence Rd Blue Mound, TX | 3.0 | 2.0 | 1538 | $1,899 | $1.23 | 20d | 1 | 0.63mi |
| 6029 Kristen Dr Fort Worth, TX | 3.0 | 2.0 | 1432 | $2,000 | $1.40 | 25d | 1 | 0.64mi |
| 2016 Priscella Dr Fort Worth, TX | 3.0 | 2.0 | 1632 | $2,150 | $1.32 | 4d | 1 | 0.68mi |
| 6109 Melanie Dr Fort Worth, TX | 3.0 | 2.0 | 1760 | $2,095 | $1.19 | 18d | 1 | 0.71mi |
| 6309 Melanie Dr Fort Worth, TX | 3.0 | 2.0 | 1614 | $2,300 | $1.43 | 18d | 1 | 0.75mi |
| 100 Creek Terrace Dr Fort Worth, TX | 3.0 | 2.0 | 1814 | $2,280 | $1.26 | 25d | 1 | 0.75mi |
| 144 Creek Terrace Dr Saginaw, TX | 3.0 | 2.0 | 1813 | $2,195 | $1.21 | 12d | 1 | 0.79mi |
| 2120 Ingrid Ln Fort Worth, TX | 3.0 | 2.5 | 1847 | $2,549 | $1.38 | 13d | 1 | 0.80mi |
| 5832 Melanie Dr Fort Worth, TX | 3.0 | 2.0 | 1384 | $1,985 | $1.43 | 3d | 1 | 0.86mi |
| 2016 Elderica Dr Fort Worth, TX | 3.0–4.0 | 2.5–3.5 | 1381 | $2,428 | $1.76 | 8d | 5 | 1.01mi |
| 853 Atchison Dr Saginaw, TX | 4.0 | 2.0 | 1748 | $2,100 | $1.20 | 25d | 1 | 1.04mi |
| 157 Spring Hollow Dr Fort Worth, TX | 4.0 | 2.0 | 1737 | $2,249 | $1.29 | 3d | 1 | 1.05mi |
| 2600 Western Center Blvd Fort Worth, TX | 2.0–3.0 | 2.0–2.5 | 1192 | $1,589 | $1.33 | 2d | 12 | 1.07mi |
| 915 Santa Fe Dr Saginaw, TX | 4.0 | 2.0 | 1744 | $8,950 | $5.13 | 25d | 1 | 1.11mi |
| 1016 Grand Central Pkwy Saginaw, TX | 3.0 | 2.0 | 1757 | $2,104 | $1.20 | 21d | 1 | 1.11mi |
| 2650 Western Center Blvd Fort Worth, TX | 1.0–3.0 | 1.0–2.0 | 964 | $1,885 | $1.96 | 3d | 28 | 1.16mi |
| 1101 Trinity Trl Saginaw, TX | 3.0 | 2.0 | 1596 | $2,055 | $1.29 | 3d | 1 | 1.22mi |
| 7401 Cowhand Ct Fort Worth, TX | 3.0 | 2.5 | 1634 | $2,099 | $1.28 | 3d | 1 | 1.23mi |
| 5900 Ozark Dr Fort Worth, TX | 3.0 | 2.0 | 1751 | $2,100 | $1.20 | 18d | 1 | 1.24mi |
| 217 Palomino Dr Saginaw, TX | 4.0 | 2.0 | 1795 | $2,000 | $1.11 | 19d | 1 | 1.33mi |
| 6415 Old Denton Rd Fort Worth, TX | 1.0–3.0 | 1.0–2.0 | 1130 | $2,188 | $1.94 | 2d | 19 | 1.34mi |
| 6301 Old Denton Rd Unit 6338 Fort Worth, TX | 2.0 | 2.0 | 1172 | $1,517 | $1.29 | 3d | 1 | 1.35mi |
| 6301 Old Denton Rd Unit 6334 Fort Worth, TX | 3.0 | 2.0 | 1312 | $1,947 | $1.48 | 3d | 1 | 1.35mi |
| 6301 Old Denton Rd Fort Worth, TX | 2.0 | 2.0 | 1172 | $1,555 | $1.33 | 3d | 1 | 1.35mi |
| 6301 Old Denton Rd Fort Worth, TX | 2.0 | 2.0 | 1172 | $1,535 | $1.31 | 21d | 1 | 1.35mi |
| 6301 Old Denton Rd Fort Worth, TX | 2.0 | 2.0 | 1172 | $1,535 | $1.31 | 19d | 1 | 1.35mi |
| 2357 Bernese Ln Fort Worth, TX | 3.0 | 2.0 | 1778 | $2,150 | $1.21 | 22d | 1 | 1.39mi |
| 632 Condor Trl Fort Worth, TX | 3.0 | 2.0 | 1658 | $2,095 | $1.26 | 8d | 1 | 1.49mi |
| 7445 Sienna Ridge Ln Fort Worth, TX | 3.0 | 2.0 | 1374 | $2,000 | $1.46 | 0d | 1 | 1.50mi |
Listing history 15 events
-
2026-06-18days on market $150,000 Active 50 DOM
-
2026-06-17days on market $150,000 Active 49 DOM
-
2026-06-16days on market $150,000 Active 48 DOM
-
2026-06-15days on market $150,000 Active 47 DOM
-
2026-06-13days on market $150,000 Active 45 DOM
-
2026-06-13days on market $150,000 Active 44 DOM
-
2026-06-09days on market $150,000 Active 41 DOM
-
2026-06-08days on market $150,000 Active 40 DOM
-
2026-06-07days on market $150,000 Active 39 DOM
-
2026-06-04days on market $150,000 Active 36 DOM
-
2026-06-03days on market $150,000 Active 35 DOM
-
2026-06-02days on market $150,000 Active 34 DOM
-
2026-06-01days on market $150,000 Active 33 DOM
-
2026-05-31days on market $150,000 Active 32 DOM
-
2026-04-24$150,000 Active
ⓘ Source: listings_history table (triggers on properties + properties_extension) + one-shot
backfill from property_details.listing_events for pre-trigger history.
Tax reassessment forecast TX · Resets to sale price
- Current annual tax
- $3,887 · $324/mo
- Projected year-2 tax
- $3,887 · $324/mo
- Expected delta
- $0/yr ($0/mo · 0.0%)
ⓘ Screening estimate from a state-policy table — verify with the county assessor before closing.
Climate risk First Street
- Flood 1/10 Low FEMA zone X (unshaded) · 0% chance over 30 yrs
- Wildfire 4/10 Moderate
- Heat 7/10 Severe 7 d/yr ≥109°F today · 21 d/yr by 30 yrs out
- Wind 4/10 Moderate 21% chance of damaging wind over 30 yrs
- Air quality 4/10 Moderate 4 unhealthy d/yr today · 5 by 30 yrs out
Nearby sold comps map
Loading sold comps map…
Walkable amenities ~0.75 mi
Loading nearby amenities…
Taxation est. · year 1
- Rental income
- $25,042
- − Mortgage interest
- −$8,402
- − Property taxes
- −$3,887
- − Insurance
- −$750
- − Repairs & maintenance
- −$2,003
- − Management
- −$2,003
- − Depreciation
- −$4,364
- Taxable income
- $3,632
- Est. tax owed @ 24.0%
- −$872
- After-tax cash flow
- $4,835/yr
For passive investors: Depreciation is non-cash, so a rental often shows a tax loss while cash-flowing — sheltering income. Rental losses are passive: they offset passive income freely, and up to $25,000/yr can offset ordinary (W-2) income if you actively participate and your MAGI is under $100k (phasing out to $0 by $150k); unused losses carry forward. On sale, claimed depreciation is recaptured at up to 25%, and gains may owe capital-gains tax (a 1031 exchange can defer both). Figures are a year-1 estimate at your 24.0% rate — not tax advice; consult a CPA.
Schools (NCES district)
- District
- Eagle Mt-Saginaw ISD
- NCES district ID
- 4817700
- Math proficiency
- 35% ▼ -16.00%
- Reading proficiency
- 42% ▼ -9.00%
- Median HH income
- $72,781
- Composite
- 35.41/100
- National rank
- #4945
- State rank
- #361 of 826 in TX
Livability — Blue Mound
- Score
- 70/100
- State rank
- #390
- US rank
- #8123
Category grades
Schools grade is shown separately in the Schools card above.
Census & demographics
- Census place
- Blue Mound, TX
- County
- Tarrant County · 2,033,669 people
- Metro
- Dallas-Fort Worth-Arlington, TX
- Population (ZIP)
- 56,322
- Household income
- $108,694
- Rent vs Own
- Severe rent burden
- 1805.0
Population outlook (Tarrant County) Hauer SSP2
- Today (2025)
- 2,380,417 people
- By 2030
- 2,578,900 · +8.3%
- By 2040
- 2,974,995 · +25.0%
- By 2050
- 3,350,489 · +40.8%
- By 2075
- 4,216,909 · +77.2%
- By 2100
- 4,741,527 · +99.2%
Race, ethnicity, and origin ACS 2023
- Neighborhood character
- Highly diverse neighborhood (Simpson 0.71)
- Race & ethnicity
- White 42% Hispanic / Latino 27% Black 14% Two or more races 12% Asian 12%
- Hispanic origin (detail)
- Mexican 19% Puerto Rican 4%
- Common ancestry
- Lithuanian 1% Slovak 1% Iranian 1%
- Foreign-born
- 16% · Canada, Vietnam, India
- Languages at home
- 67% English-only · Spanish 18% Other Indo-European 6% Vietnamese 2%
Political lean MEDSL · Tarrant
- 2024 margin
- Lean R (+5.1) · D 46.7% · R 51.9% · Other 1.4%
- 2008→2024 swing
- +6.6pp toward D · 2008: -11.7pp · 2024: -5.1pp
- All cycles
- 2024: R+5.1 2020: D+0.2 2016: R+8.7 2012: R+15.7 2008: R+11.7
Not yet ingested
- Civics
- —
Market trends
- HPI YoY
- ▼ -46.06%
- Current HPI
- 249.22
- Rent YoY
- ▼ -0.17%
- Metro
- Dallas-Fort Worth-Arlington, TX
- State GDP YoY
- ▲ 3.95%
- F500 in state
- 110
Industry mix (Fortune 500 HQ in TX)
| Industry | F500 HQs | Revenue |
|---|---|---|
| Energy | 16 | $1,198B |
|
||
| Technology | 5 | $198B |
|
||
| Engineering / Construction | 4 | $72B |
|
||
| Energy Services | 3 | $60B |
|
||
| Utilities | 3 | $41B |
|
||
| Healthcare | 2 | $330B |
|
||
Price history
1 event — show timeline
- 2026-04-24 Listed $150,000 NTREIS
Property tax history
+5.7%/yrLatest (2025): $3,887 · +13.3% YoY. Source: county tax records.
Cash-flow waterfall
monthlySold comps — $/sqft
last 12 mo · ≤1 miLoading sold comps…