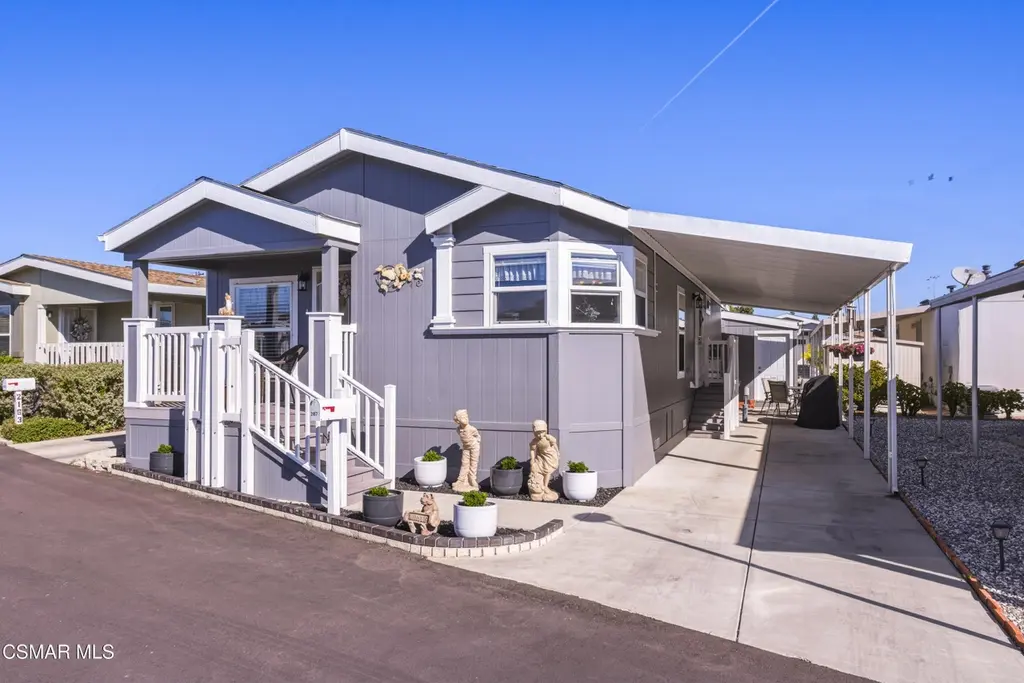
2167 Cardinal Ave · Oxnard, CA
Flood risk 4/10 · Minor
- FEMA flood zone
- X (unshaded)
- Chance of flooding over 30 yrs
- 0.22%
- Est. flood insurance / yr
- $507 – $1,088
Fire risk 3/10 · Minor
- Est. fire insurance / yr
- $659 – $1,223
Heat risk 4/10 · Minor
- Hot days now (above 85°F)
- 7 days/yr
- Hot days in 30 yrs
- 17 days/yr
Wind risk 1/10 · Minimal
- Chance of severe wind over 30 yrs
- —
Air-quality risk 4/10 · Minor
- Unhealthy air days now
- 4 days/yr
- Unhealthy air days in 30 yrs
- 5 days/yr
Risk factors via First Street. Map © Google.
Why this score? — see what drove the D+ grade
The composite is a weighted blend of 9 inputs, each scored 0–100. Each bar is that input's sub-score; the figure is the points it added to the 100-point composite (weight × sub-score).
- Cash flow +22.1/30.0
- DSCR +7.1/10.0
- 1% rule +4.6/10.0
- ARV discount +4.4/15.0
- Schools +3.6/10.0
- Livability +2.7/5.0
- Rent growth +2.5/5.0
- Condition / age +2.5/5.0
- Appreciation +0.0/10.0
$299,999
🖨 Deal sheet (PDF) 📄 Offer letter ✓ Due diligence
Listing remarks
Welcome to storybook living in the highly desirable Sunny Acres 55+ community in Oxnard! Built in 2016, this beautiful NEWER CONSTRUCTION manufactured home offers the perfect blend of comfort, and style WITH lw space rent of $768 currently. Step inside to find high ceilings, expansive living areas, and a stunning kitchen complete with a center island, walk-in pantry, and abundant storage--perfect for everyday living and entertaining alike. The spacious primary suite feels like a private retreat with its generous layout and spa-inspired bathroom, while the secondary bedroom is nearly equal in size--ideal as a second primary or guest suite--plus an additional full bath for added convenience.
Key facts
- Stunning kitchen
- Abundant storage
- Center island
Tags
Property features AI
Finance
- Other: CC & R disclosures apply; Oven included; refrigerators and washer/dryer may be negotiable; Approval status required
- Financial info: Listing accepts Conventional, Cash, and Other financing
- HOA & community: Subdivision: Sunny Acres MHP
Exterior
- Parking: 1 carport space; No attached garage
- Security: Resident manager
- Utilities: Month-to-month land lease
- Home design: Mobile home, model Festival II; Approximately 59 feet long
- Construction: Built in 2016
- Exterior features: Front porch; Entry through living room; Private pool; Private spa; Located in a senior community
Interior
- Kitchen: Convection oven; Gas stove
- Bedrooms: 2 bedrooms
- Flooring: Carpet
- Bathrooms: 2 full bathrooms
- Heating & cooling: Heating present
- Interior features: Quartz counters; Living area about 1368 (per public records); No fireplace
- Laundry & utility: Dedicated laundry room inside
Neighborhood map
What this means for you Summary
Snapshot
- This is a 2-bed/2.0-bath manufactured listed at $300k.
Deal economics
- At list price, monthly cash flow is $481 ($6k/yr) — positive.
- The deal already cash-flows at list — no discount required.
- To meet the 1% rule (rent ≥ 1% of price), the offer needs to be $287k (4.4% below list).
- Recommended offer: $287k (4.4% below list) — sets the bar for 1% rule.
- Cap rate 8.2% vs local median 2.5% in Oxnard — top-decile yield for the area; either an underpriced asset or a hidden risk that comps aren't pricing in. Stress-test before assuming the spread holds.
Location & tenants
- Location reads 54/100 on livability (#905 in CA) — a working-class tenant base; expect higher turnover. Strengths: employment A-, health & safety A-, housing B; Watch: schools F, crime F, amenities D-.
- Oxnard Union High (urban): math 28% / reading 51% proficiency, ranked #220 of 517 in CA (top 43%) — families likely to look elsewhere, expect single-tenant / working-renter base with shorter leases.
- Market conditions: Rents flat; 31 active listings in the ZIP; 6 comparable units currently listed for rent nearby; rentals leasing fast (median 2d on market — plan ~1-2 weeks tenant-placement turnaround); solid renter incomes; 1,759 units permitted in Ventura County in 2024 (1,196 in 5+ unit buildings).
- This rent runs 39% of the median local income ($87k/yr) — at the standard rent-burdened threshold; future hikes will face affordability resistance.
Forward outlook
- Local home prices are declining (-3.0%/yr); year-one equity from $2k of loan paydown is wiped out by about $9k of value loss. Plan a longer hold.
- Ventura County population projected at +4% by 2050 — modest demand growth; plan on rents tracking national, not racing it.
Negotiation context
- It's been on market 49 days — a 3% lower offer ($291k) is reasonable based on typical stale-listing flexibility.
- 2 sale attempts since 22y ago with the ask held roughly flat each time — persistent listings suggest the price (not the market) is what's stuck; bring a comps-based counter.
Questions for the listing agent
- It's been on market 49 days. Have you received any prior offers? Is the seller open to a 4% concession, seller financing, or rate buy-down credit?
- Is there a deadline driving the sale (1031 exchange, divorce, estate, relocation)? That informs how much negotiation room exists.
- Schools are F-rated, which usually means shorter tenancies and higher turnover. Who's the typical renter profile here, and what's been the actual vacancy rate?
- Crime grade is F in this area — have there been break-ins, vandalism, or insurance claims at this property in the last 3 years? What carrier currently insures it and at what premium?
- The area grade is low — what's the realistic commute time and amenity access for the typical tenant pool here? Any planned neighborhood developments (good or bad) we should know about?
- What's the average days-on-market for RENTAL listings here right now (not sales)? A rising rental-DOM trend means longer vacancies and softer asking-rent achievability than the comps imply.
- What's the recent tenant-quality profile in this submarket — average credit score on applications, eviction rate, late-payment / NSF rate, and stable-employment percentage? A property-management company in the area should have these aggregated.
- How much new for-sale + rental construction is in the pipeline within 1–3 miles? Heavy new supply typically softens prices + rents 12–24 months out; constrained supply supports both.
Investment metrics
- 1% rule
- 0.96% ✗
- Cap rate
- 8.22%
- Cash-on-cash
- 6.87%
- DSCR
- 1.31
- GRM
- 8.7
CMA / ARV
- ARV (on-the-fly)
- $280,440
- Comps found
- 12
Show comp detail 12 sales within ~0.75 mi
| Address | Dist | Beds/Ba | Sqft | Sold | Price | $/sf | Match |
|---|---|---|---|---|---|---|---|
| 4061 Canary Ln #4061 | 0.05mi | 2/2.0 | 1,344 (-2%) | 4mo | $275,000 | $205 | 91 |
| 3700 Olds Rd #38 | 0.10mi | 2/2.0 | 1,248 (-9%) | 0mo | $215,000 | $172 | 80 |
| 2400 E Pleasant Valley Rd #108 | 0.28mi | 3/2.0 (+1) | 1,344 (-2%) | 3mo | $316,000 | $235 | 77 |
| 1645 Lime Ave #91 | 0.09mi | 3/2.0 (+1) | 1,248 (-9%) | 2mo | $335,000 | $268 | 75 |
| 2138 Bluejay Ave #43 | 0.11mi | 2/2.0 | 1,250 (-9%) | 17mo | $250,000 | $200 | 66 |
| 4061 Raven Ln #0 | 0.09mi | 2/2.0 | 1,248 (-9%) | 18mo | $220,000 | $176 | 66 |
| 4021 Oriole Ln Unit G | 0.03mi | 2/2.0 | 1,200 (-12%) | 17mo | $240,000 | $200 | 64 |
| 1253 Pear Ave | 0.09mi | 3/2.0 (+1) | 1,248 (-9%) | 16mo | $321,500 | $258 | 63 |
| 1416 Persimmon Ave #156 | 0.18mi | 3/2.0 (+1) | 1,464 (+7%) | 23mo | $335,000 | $229 | 56 |
| 132 Rainbow Dr #158 | 0.69mi | 2/2.0 | 1,344 (-2%) | 23mo | $309,000 | $230 | 46 |
| 104 Fontana Dr #104 | 0.70mi | 2/2.0 | 1,440 (+5%) | 20mo | $175,000 | $122 | 42 |
| 118 Yellowstone Dr #96 | 0.72mi | 2/2.0 | 1,248 (-9%) | 17mo | $242,000 | $194 | 38 |
Match score weights: distance 35% · size 25% · config 20% · recency 20%. Top-matched comps best support the ARV.
Projected returns pro-forma
-3.0% appreciation · 0.01% rent growth · sell at horizon
- IRR
- -8.8%
- Equity multiple
- 0.68×
- Total profit
- $-26,498
- Equity at exit
- $44,731
- IRR
- -3.4%
- Equity multiple
- 0.80×
- Total profit
- $-16,570
- Equity at exit
- $25,938
Cash invested: $84,000 (down + closing). Projections, not guarantees.
Landlord ↔ Tenant lean methodology
- Overall (STATE)
- 18 Strongly Tenant-Friendly
- State California
- 18 Strongly Tenant-Friendly · D+13
- County
- — inherits STATE
- City
- — inherits STATE
ZIP-level market 93033
- Rents YoY
- 0.0%
- Active inventory
- 31
- Price-to-rent
- 8.7×
Monthly cashflow live
- Estimated rent
- $2,869 high interval (Pro) →
- Mortgage (P&I)
- −$1,573
- Tax from tax record
- −$87 /mo · $1,046/yr
- Insurance
- −$125
- HOA
- −$0
- Vacancy / Maint / Mgmt
- −$602
- Net cashflow
- $481
Break-even live
Sensitivity live
| Price | -10% $651 | -5% $566 | +0% $481 | +5% $396 | +10% $311 |
|---|---|---|---|---|---|
| Rent | -10% $254 | -5% $368 | +0% $481 | +5% $594 | +10% $708 |
| Rate | -1.0pp $632 | -0.5pp $557 | base $481 | +0.5pp $403 | +1.0pp $324 |
UW: 25.0% down · 7.5% · 30yr · 1.5% tax · 5.0% vac · 8.0% maint · 8.0% mgmt
Financing live
Cash to close
- Down payment
- $75,000
- Closing costs
- $9,000
- Reserves months
- —
- Total cash needed
- —
Loan-product check · same deal, 3 products live
Conventional
25% down · 7.5% · 30yr
- Down + closing
- —
- Monthly P&I
- —
- Monthly cashflow
- —
- DSCR
- —
- Eligible?
- —
Personal DTI + credit; lowest rate.
DSCR
20% down · 8.5% · 30yr
- Down + closing
- —
- Monthly P&I
- —
- Monthly cashflow
- —
- DSCR
- —
- Eligible?
- —
No personal income docs; deal must DSCR.
Hard money
10% down · 12.0% · 12mo
- Down + closing
- —
- Monthly P&I
- —
- Monthly cashflow
- —
- DSCR
- —
- Eligible?
- —
Short-term bridge; refi at stabilization.
Rent comps 6 comps
| Address | Beds | Baths | Sqft | Rent | $/sqft | DOM | Units | Dist |
|---|---|---|---|---|---|---|---|---|
| 2250 E Pleasant Valley Rd Oxnard, CA | 1.0–3.0 | 1.0–2.0 | 797 | $3,115 | $3.91 | 2d | 9 | 0.13mi |
| 2065 E Bard Rd Oxnard, CA | 3.0 | 2.5 | 1249 | $3,000 | $2.40 | 24d | 1 | 0.31mi |
| 4401 Dallas Dr Oxnard, CA | 2.0 | 1.5 | 950 | $3,272 | $3.44 | 2d | 2 | 0.66mi |
| 2630 El Dorado Ave Unit A Oxnard, CA | 2.0 | 1.0 | 878 | $2,500 | $2.85 | 2d | 1 | 0.74mi |
| 2530 El Dorado Ave Oxnard, CA | 2.0 | 1.0 | 878 | $2,695 | $3.07 | 2d | 1 | 0.80mi |
| 4800 Terrace Ave Unit B Oxnard, CA | 2.0 | 2.0 | 1055 | $2,600 | $2.46 | 2d | 1 | 0.99mi |
Listing history 19 events
-
2026-06-19days on market $299,999 Active 49 DOM
-
2026-06-18days on market $299,999 Active 48 DOM
-
2026-06-17days on market $299,999 Active 47 DOM
-
2026-06-16days on market $299,999 Active 46 DOM
-
2026-06-15days on market $299,999 Active 45 DOM
-
2026-06-13days on market $299,999 Active 43 DOM
-
2026-06-12days on market $299,999 Active 42 DOM
-
2026-06-10days on market $299,999 Active 40 DOM
-
2026-06-09days on market $299,999 Active 39 DOM
-
2026-06-08days on market $299,999 Active 38 DOM
-
2026-06-07days on market $299,999 Active 37 DOM
-
2026-06-05days on market $299,999 Active 35 DOM
-
2026-06-03days on market $299,999 Active 33 DOM
-
2026-06-02days on market $299,999 Active 32 DOM
-
2026-06-01days on market $299,999 Active 31 DOM
-
2026-05-31days on market $299,999 Active 30 DOM
-
2026-05-01$299,999 Active
-
2005-03-18historical
-
2004-10-25
ⓘ Source: listings_history table (triggers on properties + properties_extension) + one-shot
backfill from property_details.listing_events for pre-trigger history.
Tax reassessment forecast CA · Resets to sale price
- Current annual tax
- $1,046 · $87/mo
- Projected year-2 tax
- $2,280 · $190/mo
- Expected delta
- +$1,234/yr (+$103/mo · 117.9%)
ⓘ Screening estimate from a state-policy table — verify with the county assessor before closing.
Climate risk First Street
- Flood 4/10 Moderate FEMA zone X (unshaded) · 22% chance over 30 yrs
- Wildfire 3/10 Moderate
- Heat 4/10 Moderate 7 d/yr ≥85°F today · 17 d/yr by 30 yrs out
- Wind 1/10 Low
- Air quality 4/10 Moderate 4 unhealthy d/yr today · 5 by 30 yrs out
Nearby sold comps map
Loading sold comps map…
Walkable amenities ~0.75 mi
Loading nearby amenities…
Taxation est. · year 1
- Rental income
- $34,425
- − Mortgage interest
- −$16,805
- − Property taxes
- −$1,046
- − Insurance
- −$1,500
- − Repairs & maintenance
- −$2,754
- − Management
- −$2,754
- − Depreciation
- −$8,727
- Taxable income
- $839
- Est. tax owed @ 24.0%
- −$201
- After-tax cash flow
- $5,569/yr
For passive investors: Depreciation is non-cash, so a rental often shows a tax loss while cash-flowing — sheltering income. Rental losses are passive: they offset passive income freely, and up to $25,000/yr can offset ordinary (W-2) income if you actively participate and your MAGI is under $100k (phasing out to $0 by $150k); unused losses carry forward. On sale, claimed depreciation is recaptured at up to 25%, and gains may owe capital-gains tax (a 1031 exchange can defer both). Figures are a year-1 estimate at your 24.0% rate — not tax advice; consult a CPA.
Schools (NCES district)
- District
- Oxnard Union High
- NCES district ID
- 0629270
- Math proficiency
- 28% ▲ 7.00%
- Reading proficiency
- 51% ▲ 11.00%
- Median HH income
- $68,770
- Composite
- 35.79/100
- National rank
- #4835
- State rank
- #220 of 517 in CA
Livability — Oxnard
- Score
- 54/100
- State rank
- #905
- US rank
- #24028
Category grades
Schools grade is shown separately in the Schools card above.
Census & demographics
- Census place
- Oxnard, CA
- County
- Ventura County · 829,955 people
- City population
- 213,176
- Metro
- Oxnard-Thousand Oaks-Ventura, CA
- Population (ZIP)
- 78,737
- Household income
- $87,309
- Rent vs Own
- Severe rent burden
- 1968.0
Population outlook (Ventura County) Hauer SSP2
- Today (2025)
- 895,754 people
- By 2030
- 912,134 · +1.8%
- By 2040
- 931,454 · +4.0%
- By 2050
- 934,609 · +4.3%
- By 2075
- 924,899 · +3.3%
- By 2100
- 864,712 · -3.5%
Race, ethnicity, and origin ACS 2023
- Neighborhood character
- Predominantly Hispanic (86%)
- Race & ethnicity
- Hispanic / Latino 86% Two or more races 36% Asian 7% White 5% Native American 4%
- Hispanic origin (detail)
- Mexican 82%
- Foreign-born
- 41% · Canada, Vietnam
- Languages at home
- 20% English-only · Spanish 72% Tagalog/Filipino 4%
Political lean MEDSL · Ventura
- 2024 margin
- D (+15.1) · D 56.1% · R 41.0% · Other 2.9%
- 2008→2024 swing
- +2.8pp toward D · 2008: 12.3pp · 2024: 15.1pp
- All cycles
- 2024: D+15.1 2020: D+21.1 2016: D+16.8 2012: D+5.3 2008: D+12.3
Not yet ingested
- Civics
- —
Market trends
- HPI YoY
- ▼ -824.11%
- Current HPI
- 348.9793
- Rent YoY
- ▬ 0.01%
- Metro
- Oxnard-Thousand Oaks-Ventura, CA
- State GDP YoY
- ▲ 3.21%
- F500 in state
- 116
Industry mix (Fortune 500 HQ in CA)
| Industry | F500 HQs | Revenue |
|---|---|---|
| Technology | 27 | $1,492B |
|
||
| Financial Services | 3 | $174B |
|
||
| Retail | 3 | $44B |
|
||
| Insurance | 3 | $26B |
|
||
| Media / Entertainment | 2 | $115B |
|
||
| Pharmaceuticals / Biotech | 2 | $62B |
|
||
Price history
3 events — show timeline
- 2026-05-01 Listed $299,999 CSMAR
- 2005-03-18 Delisted — CRMLS
- 2004-10-25 Listed — CRMLS
Property tax history
-3.6%/yrLatest (2025): $1,046 · +7.1% YoY. Source: county tax records.
Cash-flow waterfall
monthlySold comps — $/sqft
last 12 mo · ≤1 miLoading sold comps…