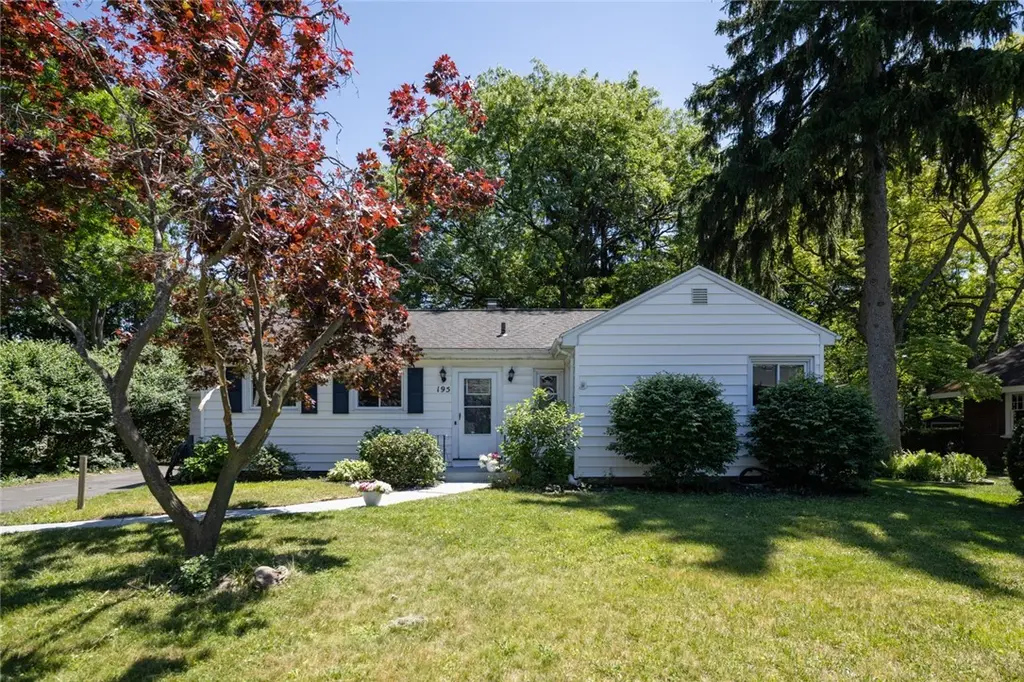
195 East Pkwy · Irondequoit, NY
Flood risk 1/10 · Minimal
- FEMA flood zone
- X (unshaded)
- Chance of flooding over 30 yrs
- 0.0%
- Est. flood insurance / yr
- $473 – $860
Fire risk 1/10 · Minimal
- Est. fire insurance / yr
- $691 – $1,283
Heat risk 2/10 · Minimal
- Hot days now (above 96°F)
- 7 days/yr
- Hot days in 30 yrs
- 15 days/yr
Wind risk 1/10 · Minimal
- Chance of severe wind over 30 yrs
- —
Air-quality risk 2/10 · Minimal
- Unhealthy air days now
- 1 days/yr
- Unhealthy air days in 30 yrs
- 2 days/yr
Risk factors via First Street. Map © Google.
Why this score? — see what drove the C+ grade
The composite is a weighted blend of 9 inputs, each scored 0–100. Each bar is that input's sub-score; the figure is the points it added to the 100-point composite (weight × sub-score).
- Cash flow +19.2/30.0
- ARV discount +15.0/15.0
- Schools +6.2/10.0
- DSCR +6.1/10.0
- 1% rule +5.1/10.0
- Livability +4.0/5.0
- Rent growth +2.5/5.0
- Condition / age +2.5/5.0
- Appreciation +0.0/10.0
$174,900
🖨 Deal sheet 📄 Offer letter ✓ Due diligence
Listing remarks MLS
Spectacular open layout remodeled 3 bedroom, 1.5 bath Ranch home in West Irondequoit school district. This unique home features an open kitchen/ family room with newer cabinets, countertops, intricately tiled kitchen floor leading in the hardwood living room, new craftsman style interior doors, and newer lighting. Bathroom features tiled floor and walls, new vanity and fixtures. Basement features an original wood burning fireplace with a lot of new mechanical updates. Exterior features a covered back concrete porch, fully fenced yard and vinyl siding, and architectural shingled roof! Not very often a home in this highly desirable neighborhood gets listed! HURRY!
Key facts
- Newer furnace
- Open-concept kitchen
- Covered patio
Tags
Property features AI
Exterior
- Parking: Attached garage with 1 garage space
- Utilities: Public water connected; Sewer connected; Electricity connected; Cable available
- Home design: Single-story home; Resale property
- Construction: Vinyl siding; Copper plumbing; Asphalt roof; Block foundation; Built as existing (year built: existing)
- Exterior features: Blacktop driveway; Fully fenced yard; Covered patio/porch; Patio
Interior
- Kitchen: Dishwasher
- Bedrooms: Three main-level bedrooms
- Flooring: Ceramic tile; Hardwood; Luxury vinyl
- Bathrooms: One full bathroom; One half bathroom (total two main-level bathrooms)
- Heating & cooling: Gas forced-air heating; Circuit breaker electric system
- Interior features: Great room; Living/Dining room; Main-level primary suite; Programmable thermostat
- Laundry & utility: Gas water heater
Neighborhood map
What this means for you Summary
Snapshot
- This is a 3-bed/1.5-bath single-family listed at $175k.
Deal economics
- At list price, monthly cash flow is $189 ($2k/yr) — positive.
- The deal already cash-flows at list — no discount required.
- Meets the 1% rule at list price ($2k rent vs $175k).
- Cap rate 7.6% vs local median 4.5% in Irondequoit — top-decile yield for the area; either an underpriced asset or a hidden risk that comps aren't pricing in. Stress-test before assuming the spread holds.
Location & tenants
- Location reads 81/100 on livability (#92 in NY, #1,414 nationally) — a professional / high-income tenant draw. Strengths: housing A+, health & safety A+, crime B+; Watch: amenities F.
- West Irondequoit Central School District (suburban): math 73% / reading 70% proficiency, ranked #126 of 590 in NY (top 21%) — strong family-tenant draw, lease renewals of 3-5y typical; only 18% free/reduced lunch — higher-income household profile.
- Market conditions: 102 active listings in the ZIP; 12 comparable units currently listed for rent nearby; rentals at typical pace (median 14d on market — plan ~3-4 weeks tenant-placement turnaround); solid renter incomes; 1,169 units permitted in Monroe County in 2024 (591 in 5+ unit buildings).
Forward outlook
- Local home prices are declining (-3.0%/yr); year-one equity from $1k of loan paydown is wiped out by about $5k of value loss. Plan a longer hold.
- Monroe County population projected to shrink 6% by 2050 — rents likely to lag national; underwrite the cash flow, not the appreciation.
Negotiation context
- Only 8 days on market — expect competitive offers; lowballing is unlikely to land.
- 3 sale attempts since 12y ago with the ask held roughly flat each time — persistent listings suggest the price (not the market) is what's stuck; bring a comps-based counter.
- Current owner paid $128k; 36% above their basis — modest negotiation headroom, anchor on the comps not their cost.
Risks & watch-outs
- Watch-outs: built in 1955 — expect roof / HVAC / electrical / plumbing capex.
Questions for the listing agent
- Built in 1955 — when were the roof, HVAC, electrical panel, plumbing, and water heater last replaced?
- Is there a deadline driving the sale (1031 exchange, divorce, estate, relocation)? That informs how much negotiation room exists.
- Schools are B-rated — typically a magnet for longer-tenancy family renters. What's the average tenant stay here, and is there a school-zone premium baked into asking?
- What's the average days-on-market for RENTAL listings here right now (not sales)? A rising rental-DOM trend means longer vacancies and softer asking-rent achievability than the comps imply.
- What's the recent tenant-quality profile in this submarket — average credit score on applications, eviction rate, late-payment / NSF rate, and stable-employment percentage? A property-management company in the area should have these aggregated.
- How much new for-sale + rental construction is in the pipeline within 1–3 miles? Heavy new supply typically softens prices + rents 12–24 months out; constrained supply supports both.
Investment metrics
- 1% rule
- 1.01% ✓
- Cap rate
- 7.59%
- Cash-on-cash
- 4.64%
- DSCR
- 1.21
- GRM
- 8.2
CMA / ARV
- ARV (on-the-fly)
- $265,512
- Comps found
- 12
Show comp detail 12 sales within ~0.75 mi
| Address | Dist | Beds/Ba | Sqft | Sold | Price | $/sf | Match |
|---|---|---|---|---|---|---|---|
| 78 Parkside Cres | 0.32mi | 3/1.0 | 1,175 (-2%) | 8mo | $262,000 | $223 | 74 |
| 145 Pontiac Dr | 0.41mi | 2/1.5 (-1) | 1,172 (-2%) | 1mo | $260,000 | $222 | 72 |
| 59 Armstrong Ave | 0.36mi | 3/1.5 | 1,090 (-9%) | 1mo | $258,000 | $237 | 68 |
| 25 Maplehurst Rd | 0.43mi | 3/1.0 | 1,161 (-3%) | 7mo | $290,000 | $250 | 67 |
| 127 Barry Rd | 0.52mi | 2/2.0 (-1) | 1,163 (-3%) | 5mo | $200,000 | $172 | 60 |
| 146 Burwell Rd | 0.46mi | 3/1.5 | 1,320 (+10%) | 2mo | $245,000 | $186 | 59 |
| 2042 N Clinton Ave | 0.69mi | 3/2.0 | 1,150 (-4%) | 2mo | $275,000 | $239 | 58 |
| 93 Burwell Rd | 0.43mi | 3/1.5 | 1,320 (+10%) | 6mo | $230,000 | $174 | 57 |
| 275 Titus Ave | 0.32mi | 3/1.0 | 1,370 (+14%) | 7mo | $210,000 | $153 | 53 |
| 53 Armstrong Ave | 0.36mi | 3/1.0 | 1,371 (+15%) | 5mo | $231,000 | $168 | 53 |
| 146 Leland Rd | 0.56mi | 3/1.5 | 1,350 (+13%) | 8mo | $272,000 | $201 | 46 |
| 472 Barry Rd | 0.71mi | 2/1.0 (-1) | 1,092 (-9%) | 2mo | $270,740 | $248 | 44 |
Match score weights: distance 35% · size 25% · config 20% · recency 20%. Top-matched comps best support the ARV.
Projected returns pro-forma
-3.0% appreciation · 3.0% rent growth · sell at horizon
- IRR
- -9.1%
- Equity multiple
- 0.67×
- Total profit
- $-16,264
- Equity at exit
- $26,078
- IRR
- 0.4%
- Equity multiple
- 1.03×
- Total profit
- $1,463
- Equity at exit
- $15,122
Cash invested: $48,972 (down + closing). Projections, not guarantees.
Landlord ↔ Tenant lean methodology
- Overall (STATE)
- 15 Strongly Tenant-Friendly
- State New York
- 15 Strongly Tenant-Friendly · D+10
- County
- — inherits STATE
- City
- — inherits STATE
ZIP-level market 14617
- Active inventory
- 102
- Price-to-rent
- 8.2×
Monthly cashflow live
- Estimated rent
- $1,769 high interval (Pro) →
- Mortgage (P&I)
- −$917
- Tax est. 1.5%
- −$219 /mo · $2,624/yr
- Insurance
- −$73
- HOA
- −$0
- Vacancy / Maint / Mgmt
- −$372
- Net cashflow
- $189
Break-even live
UW: 25.0% down · 7.5% · 30yr · 1.5% tax · 5.0% vac · 8.0% maint · 8.0% mgmt
Financing live
Cash to close
- Down payment
- $43,725
- Closing costs
- $5,247
- Reserves months
- —
- Total cash needed
- —
Loan-product check · same deal, 3 products live
Conventional
25% down · 7.5% · 30yr
- Down + closing
- —
- Monthly P&I
- —
- Monthly cashflow
- —
- DSCR
- —
- Eligible?
- —
Personal DTI + credit; lowest rate.
DSCR
20% down · 8.5% · 30yr
- Down + closing
- —
- Monthly P&I
- —
- Monthly cashflow
- —
- DSCR
- —
- Eligible?
- —
No personal income docs; deal must DSCR.
Hard money
10% down · 12.0% · 12mo
- Down + closing
- —
- Monthly P&I
- —
- Monthly cashflow
- —
- DSCR
- —
- Eligible?
- —
Short-term bridge; refi at stabilization.
Rent comps 12 comps
| Address | Beds | Baths | Sqft | Rent | $/sqft | DOM | Units | Dist |
|---|---|---|---|---|---|---|---|---|
| 83 Navarre Rd Rochester, NY | 3.0 | 2.0 | 1322 | $2,250 | $1.70 | 2d | 1 | 0.71mi |
| 39 Chelsea Rd Rochester, NY | 3.0 | 1.5 | 1108 | $2,350 | $2.12 | 23d | 1 | 0.91mi |
| 1750 Hudson Ave Irondequoit, NY | 1.0–2.0 | 1.0 | 654 | $1,900 | $2.90 | 2d | 4 | 1.03mi |
| 14-42 Seneca Manor Dr Rochester, NY | 1.0–2.0 | 1.0 | 800 | $1,120 | $1.40 | 43d | 1 | 1.08mi |
| 60 Cheltenham Rd Unit Down Rochester, NY | 2.0 | 1.0 | 1014 | $1,300 | $1.28 | 14d | 1 | 1.08mi |
| 1902 Dewey Ave Unit 1896 Rochester, NY | 2.0 | 1.0 | 900 | $1,150 | $1.28 | 23d | 1 | 1.19mi |
| 230 Pullman Ave Unit 1 Rochester, NY | 2.0 | 1.0 | 900 | $1,100 | $1.22 | 14d | 1 | 1.26mi |
| 116 Ridgeway Ave Rochester, NY | 3.0 | 2.0 | 1032 | $1,650 | $1.60 | 2d | 1 | 1.27mi |
| 248 Flower City Park Rochester, NY | 3.0 | 1.0 | 1350 | $1,800 | $1.33 | 3d | 1 | 1.30mi |
| 493 Hollenbeck St Rochester, NY | 2.0 | 1.5 | 936 | $1,275 | $1.36 | 14d | 1 | 1.37mi |
| 45 Clay Ave Rochester, NY | 3.0 | 1.0 | 1000 | $1,700 | $1.70 | 14d | 1 | 1.38mi |
| 56 Brambury Dr Rochester, NY | 1.0–2.0 | 1.0 | 720 | $1,425 | $1.98 | 10d | 1 | 1.46mi |
Listing history 7 events
-
2026-06-18days on market $174,900 Active 8 DOM
-
2026-06-17days on market $174,900 Active 7 DOM
-
2026-06-16days on market $174,900 Active 6 DOM
-
2026-06-15days on market $174,900 Active 5 DOM
-
2026-06-13days on market $174,900 Active 3 DOM
-
2026-06-13remarks 699-char remark
-
2026-06-13$174,900 Active 2 DOM
ⓘ Source: listings_history table (triggers on properties + properties_extension) + one-shot
backfill from property_details.listing_events for pre-trigger history.
Climate risk First Street
- Flood 1/10 Low FEMA zone X (unshaded) · 0% chance over 30 yrs
- Wildfire 1/10 Low
- Heat 2/10 Low 7 d/yr ≥96°F today · 15 d/yr by 30 yrs out
- Wind 1/10 Low
- Air quality 2/10 Low 1 unhealthy d/yr today · 2 by 30 yrs out
Nearby sold comps map
Loading sold comps map…
Walkable amenities ~0.75 mi
Loading nearby amenities…
Taxation est. · year 1
- Rental income
- $21,234
- − Mortgage interest
- −$9,797
- − Property taxes
- −$2,624
- − Insurance
- −$874
- − Repairs & maintenance
- −$1,699
- − Management
- −$1,699
- − Depreciation
- −$5,088
- Taxable loss
- −$547
- Est. tax savings @ 24.0%
- +$131
- After-tax cash flow
- $2,402/yr
For passive investors: Depreciation is non-cash, so a rental often shows a tax loss while cash-flowing — sheltering income. Rental losses are passive: they offset passive income freely, and up to $25,000/yr can offset ordinary (W-2) income if you actively participate and your MAGI is under $100k (phasing out to $0 by $150k); unused losses carry forward. On sale, claimed depreciation is recaptured at up to 25%, and gains may owe capital-gains tax (a 1031 exchange can defer both). Figures are a year-1 estimate at your 24.0% rate — not tax advice; consult a CPA.
Schools (NCES district)
- District
- West Irondequoit Central School District
- NCES district ID
- 3615390
- Math proficiency
- 73% ▲ 3.00%
- Reading proficiency
- 70% ▲ 5.00%
- Median HH income
- $60,218
- Composite
- 61.61/100
- National rank
- #748
- State rank
- #126 of 590 in NY
Livability — Irondequoit
- Score
- 81/100
- State rank
- #92
- US rank
- #1414
Category grades
Schools grade is shown separately in the Schools card above.
Census & demographics
- Census place
- Irondequoit, NY
- County
- Monroe County · 674,131 people
- City population
- 74,252
- Metro
- Rochester, NY
- Population (ZIP)
- 21,788
- Household income
- $90,192
- Rent vs Own
- Severe rent burden
- 426.0
Population outlook (Monroe County) Hauer SSP2
- Today (2025)
- 759,460 people
- By 2030
- 757,154 · -0.3%
- By 2040
- 740,644 · -2.5%
- By 2050
- 714,443 · -5.9%
- By 2075
- 645,883 · -15.0%
- By 2100
- 547,084 · -28.0%
Race, ethnicity, and origin ACS 2023
- Neighborhood character
- Predominantly White (85%)
- Race & ethnicity
- White 85% Hispanic / Latino 8% Two or more races 6% Black 4%
- Hispanic origin (detail)
- Puerto Rican 4%
- Common ancestry
- Romanian 6% Iranian 3% Lithuanian 3%
- Foreign-born
- 4% · Canada
- Languages at home
- 93% English-only · Spanish 4% Other Indo-European 1% Russian/Polish/Slavic 1%
Political lean MEDSL · Monroe
- 2024 margin
- D (+19.1) · D 59.5% · R 40.5%
- 2008→2024 swing
- +1.4pp toward D · 2008: 17.7pp · 2024: 19.1pp
- All cycles
- 2024: D+19.1 2020: D+21.0 2016: D+14.1 2012: D+17.4 2008: D+17.7
Not yet ingested
- Civics
- —
Market trends
- HPI YoY
- ▼ -148.22%
- Current HPI
- 263.9973
- Rent YoY
- —
- Metro
- Rochester, NY
- State GDP YoY
- ▲ 2.60%
- F500 in state
- 92
Industry mix (Fortune 500 HQ in NY)
| Industry | F500 HQs | Revenue |
|---|---|---|
| Financial Services | 10 | $950B |
|
||
| Consumer Goods | 9 | $162B |
|
||
| Insurance | 4 | $225B |
|
||
| Telecommunications | 2 | $144B |
|
||
| Pharmaceuticals | 2 | $112B |
|
||
| Media / Entertainment | 2 | $69B |
|
||
Price history
+144.6% since first listed10 events — show timeline
- 2026-06-10 Listed $174,900 UNYREIS
- 2018-02-27 Sold (Public Records) $128,500 Public Records
- 2018-02-27 Sold (MLS) $128,500 UNYREIS
- 2018-01-29 Pending — UNYREIS
- 2018-01-26 Listed $125,000 UNYREIS
- 2014-04-07 Sold (MLS) $88,550 UNYREIS
- 2014-02-10 Listed $80,000 UNYREIS
- 2005-08-03 Sold (Public Records) $116,000 Public Records
- 2004-05-04 Sold (Public Records) $102,017 Public Records
- 1996-02-06 Sold (Public Records) $71,500 Public Records
Property tax history
+6.4%/yrLatest (2025): $10,475 · +3.4% YoY. Source: county tax records.
Cash-flow waterfall
monthlySold comps — $/sqft
last 12 mo · ≤1 miLoading sold comps…