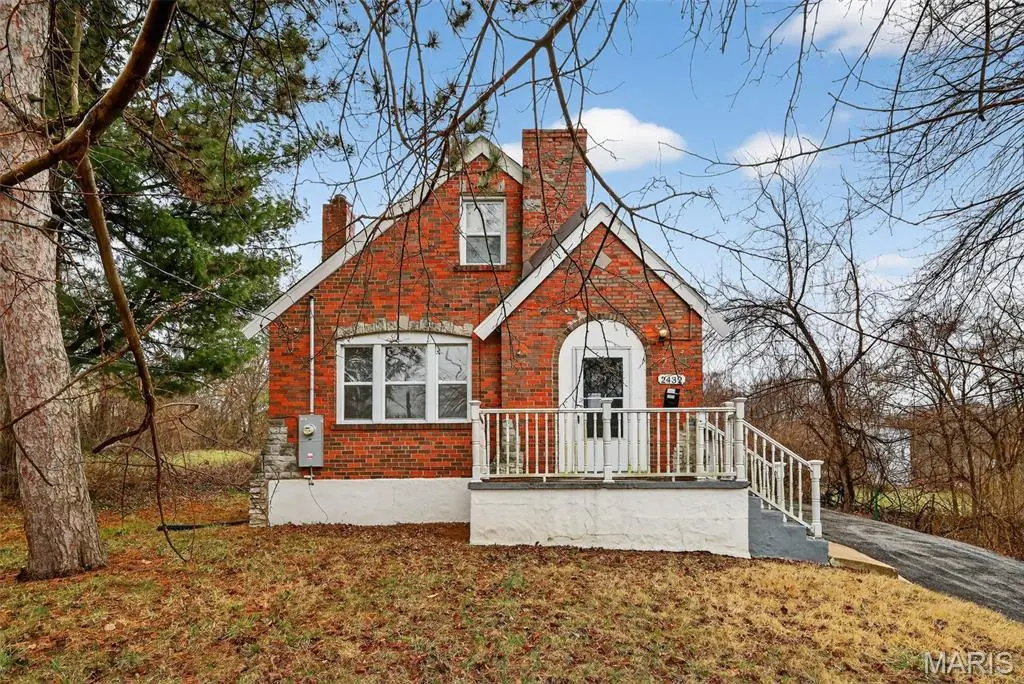
2432 Mary Ave · Jennings, MO
Flood risk 1/10 · Minimal
- FEMA flood zone
- X (unshaded)
- Chance of flooding over 30 yrs
- 0.0%
- Est. flood insurance / yr
- $473 – $860
Fire risk 1/10 · Minimal
- Est. fire insurance / yr
- $1,054 – $1,958
Heat risk 4/10 · Minor
- Hot days now (above 107°F)
- 7 days/yr
- Hot days in 30 yrs
- 19 days/yr
Wind risk 2/10 · Minimal
- Chance of severe wind over 30 yrs
- 1.0%
Air-quality risk 4/10 · Minor
- Unhealthy air days now
- 4 days/yr
- Unhealthy air days in 30 yrs
- 5 days/yr
Risk factors via First Street. Map © Google.
Why this score? — see what drove the B grade
The composite is a weighted blend of 9 inputs, each scored 0–100. Each bar is that input's sub-score; the figure is the points it added to the 100-point composite (weight × sub-score).
- Cash flow +30.0/30.0
- 1% rule +10.0/10.0
- DSCR +10.0/10.0
- Appreciation +6.9/10.0
- Rent growth +3.7/5.0
- ARV discount +3.6/15.0
- Livability +3.4/5.0
- Condition / age +2.5/5.0
- Schools +1.1/10.0
$79,900
🖨 Deal sheet 📄 Offer letter ✓ Due diligence
Listing remarks MLS
Stunning brick bungalow full of character and charm! This spacious 4-bedroom, 1-bath home welcomes you with fantastic curb appeal, natural light, and neutral colors that create a warm and inviting atmosphere throughout. Step inside to a huge living room featuring a beautiful masonry fireplace—perfect for cozy evenings and gathering with friends and family. Gorgeous wood floors flow through much of the main level, adding timeless style. The main floor includes the primary bedroom and an additional guest bedroom, a full bathroom, and a formal dining room ideal for entertaining. The bright kitchen offers great functionality and comes equipped with a range and refrigerator. Upstairs, you’ll find two additional bedrooms providing extra space for family, guests, or a home office. Outside, enjoy a large yard, a covered back porch perfect for relaxing, and a detached 1-car garage for added convenience. The full basement includes laundry hookups and plenty of room for storage or future possibilities. With classic bungalow charm, generous living space, and desirable features throughout, this St. Louis home is one you won’t want to miss!
Key facts
- Bright kitchen
- Brick bungalow
- Formal dining room
Tags
Neighborhood map
What this means for you Summary
Snapshot
- This is a 3-bed/1.5-bath single-family listed at $80k.
Deal economics
- At list price, monthly cash flow is $398 ($5k/yr) — positive.
- The deal already cash-flows at list — no discount required.
- Meets the 1% rule at list price ($1k rent vs $80k).
- Recommended offer: $73k (9.0% below list) — sets the bar for market timing.
Location & tenants
- Location reads 67/100 on livability (#208 in MO) — a middle-class / working-renter tenant base. Strengths: cost of living A+, commute A-, housing A-; Watch: schools D-, crime F, amenities F.
- Jennings (suburban): math 8% / reading 20% proficiency, ranked #315 of 324 in MO (top 97%) — low school quality limits family demand, transient renter base, plan for 1-2y turnover; 86% free/reduced lunch — lower-income household profile, screen leases tightly.
- Market conditions: Rents rising fast (+5.0%/yr); 372 active listings in the ZIP; 40 comparable units currently listed for rent nearby; rentals at typical pace (median 24d on market — plan ~3-4 weeks tenant-placement turnaround); 40% of comp listings sitting > 30 days — soft ceiling on asking rent; lower-income renter base — watch delinquency; 920 units permitted in St. Louis County in 2024 (250 in 5+ unit buildings).
- This rent runs 36% of the median local income ($41k/yr) — at the standard rent-burdened threshold; future hikes will face affordability resistance.
Forward outlook
- In year one you build about $4k of equity ($552 loan paydown + $3k appreciation (3.8% local appreciation)).
- At projected returns (3.8% appreciation + 5.0% rent growth), your $22k cash investment doubles in ~3 years — after that, you're playing with house money.
- By year 9, paydown + projected appreciation supports a ~$31k cash-out refi (75% LTV) — recoverable capital for the next deal without selling this one.
Negotiation context
- It's been on market 105 days — a 9% lower offer ($73k) is reasonable based on typical stale-listing flexibility.
- Current owner paid $26k; list at $80k implies a 207% gain — meaningful room to come down on a strong offer.
Risks & watch-outs
- Watch-outs: built in 1939 — expect roof / HVAC / electrical / plumbing capex.
Questions for the listing agent
- It's been on market 105 days. Have you received any prior offers? Is the seller open to a 9% concession, seller financing, or rate buy-down credit?
- Built in 1939 — when were the roof, HVAC, electrical panel, plumbing, and water heater last replaced?
- Why hasn't it sold? Are there any deal-killer items the seller is aware of (foundation, flood, title, zoning, code violations)?
- Is there a deadline driving the sale (1031 exchange, divorce, estate, relocation)? That informs how much negotiation room exists.
- Schools are D-rated, which usually means shorter tenancies and higher turnover. Who's the typical renter profile here, and what's been the actual vacancy rate?
- Crime grade is F in this area — have there been break-ins, vandalism, or insurance claims at this property in the last 3 years? What carrier currently insures it and at what premium?
- What's the average days-on-market for RENTAL listings here right now (not sales)? A rising rental-DOM trend means longer vacancies and softer asking-rent achievability than the comps imply.
- What's the recent tenant-quality profile in this submarket — average credit score on applications, eviction rate, late-payment / NSF rate, and stable-employment percentage? A property-management company in the area should have these aggregated.
- How much new for-sale + rental construction is in the pipeline within 1–3 miles? Heavy new supply typically softens prices + rents 12–24 months out; constrained supply supports both.
Investment metrics
- 1% rule
- 1.55% ✓
- Cap rate
- 12.28%
- Cash-on-cash
- 21.37%
- DSCR
- 1.95
- GRM
- 5.4
CMA / ARV
- ARV (median comp)
- $73,571
- List price
- $79,900
- Delta
- 8.60%
- Verdict
- FAIR
- Comps
- 20 within 1.0 mi
Show comp detail 12 sales within ~0.75 mi
| Address | Dist | Beds/Ba | Sqft | Sold | Price | $/sf | Match |
|---|---|---|---|---|---|---|---|
| 5 Jendale Ct | 0.19mi | 4/1.0 (+1) | 1,267 (+4%) | 6mo | $69,995 | $55 | 73 |
| 2538 Oepts Ave | 0.22mi | 3/1.5 | 1,144 (-6%) | 7mo | $40,000 | $35 | 73 |
| 8871 Boyce Pl | 0.44mi | 3/2.0 | 1,250 (+2%) | 4mo | $149,900 | $120 | 71 |
| 8 Jendale Ct | 0.18mi | 2/2.0 (-1) | 1,127 (-8%) | 4mo | $125,000 | $111 | 68 |
| 8870 Saint Cyr Dr | 0.36mi | 3/1.0 | 1,131 (-8%) | 2mo | $39,900 | $35 | 67 |
| 2327 Switzer Ave | 0.39mi | 4/1.0 (+1) | 1,201 (-2%) | 7mo | $45,000 | $37 | 66 |
| 9305 Scottdale Ave | 0.70mi | 3/2.0 | 1,280 (+5%) | 3mo | $60,000 | $47 | 55 |
| 2035 Sun Valley Dr | 0.71mi | 3/2.0 | 1,170 (-4%) | 4mo | $68,900 | $59 | 54 |
| 8819 May Ave | 0.41mi | 2/1.0 (-1) | 1,074 (-12%) | 0mo | $100,000 | $93 | 53 |
| 2044 Hildred Ave | 0.55mi | 4/1.0 (+1) | 1,136 (-7%) | 6mo | $115,000 | $101 | 50 |
| 9157 Victory Ave | 0.55mi | 4/2.5 (+1) | 1,127 (-8%) | 5mo | $129,900 | $115 | 48 |
| 2568 Dorwood Dr | 0.70mi | 2/1.0 (-1) | 1,336 (+9%) | 4mo | $105,000 | $79 | 42 |
Match score weights: distance 35% · size 25% · config 20% · recency 20%. Top-matched comps best support the ARV.
Projected returns pro-forma
3.79% appreciation · 4.97% rent growth · sell at horizon
- IRR
- 30.6%
- Equity multiple
- 2.83×
- Total profit
- $40,927
- Equity at exit
- $39,534
- IRR
- 31.4%
- Equity multiple
- 5.92×
- Total profit
- $110,096
- Equity at exit
- $63,893
Cash invested: $22,372 (down + closing). Projections, not guarantees.
Landlord ↔ Tenant lean methodology
- Overall (STATE)
- 81 Strongly Landlord-Friendly
- State Missouri
- 81 Strongly Landlord-Friendly · R+10
- County
- — inherits STATE
- City
- — inherits STATE
ZIP-level market 63136
- Home prices YoY
- 0.9%
- Rents YoY
- 5.0%
- Active inventory
- 372
- Price-to-rent
- 5.4×
Monthly cashflow live
- Estimated rent
- $1,237 high interval (Pro) →
- Mortgage (P&I)
- −$419
- Tax from tax record
- −$127 /mo · $1,521/yr
- Insurance
- −$33
- HOA
- −$0
- Vacancy / Maint / Mgmt
- −$260
- Net cashflow
- $398
Break-even live
UW: 25.0% down · 7.5% · 30yr · 1.5% tax · 5.0% vac · 8.0% maint · 8.0% mgmt
Financing live
Cash to close
- Down payment
- $19,975
- Closing costs
- $2,397
- Reserves months
- —
- Total cash needed
- —
Loan-product check · same deal, 3 products live
Conventional
25% down · 7.5% · 30yr
- Down + closing
- —
- Monthly P&I
- —
- Monthly cashflow
- —
- DSCR
- —
- Eligible?
- —
Personal DTI + credit; lowest rate.
DSCR
20% down · 8.5% · 30yr
- Down + closing
- —
- Monthly P&I
- —
- Monthly cashflow
- —
- DSCR
- —
- Eligible?
- —
No personal income docs; deal must DSCR.
Hard money
10% down · 12.0% · 12mo
- Down + closing
- —
- Monthly P&I
- —
- Monthly cashflow
- —
- DSCR
- —
- Eligible?
- —
Short-term bridge; refi at stabilization.
Rent comps 40 comps
| Address | Beds | Baths | Sqft | Rent | $/sqft | DOM | Units | Dist |
|---|---|---|---|---|---|---|---|---|
| 3 Pohlman Ln Saint Louis, MO | 2.0 | 1.0 | 704 | $1,000 | $1.42 | 16d | 1 | 0.04mi |
| 7 Lamar Dr Saint Louis, MO | 3.0 | 1.0 | 894 | $1,200 | $1.34 | 17d | 1 | 0.14mi |
| 8720 Akins Dr Saint Louis, MO | 2.0 | 1.0 | 1012 | $1,150 | $1.14 | 23d | 1 | 0.18mi |
| 2415 Shirley Ave Saint Louis, MO | 3.0 | 1.0 | 990 | $1,450 | $1.46 | 23d | 1 | 0.25mi |
| 2427 Switzer Ave Saint Louis, MO | 3.0 | 1.0 | 1008 | $1,300 | $1.29 | 43d | 1 | 0.30mi |
| 2617 Hord Ave Saint Louis, MO | 2.0 | 1.0 | 800 | $775 | $0.97 | 4d | 1 | 0.31mi |
| 2527 Switzer Ave Saint Louis, MO | 3.0 | 1.0 | 888 | $1,135 | $1.28 | 16d | 1 | 0.33mi |
| 8817 Shady Grove Ave Saint Louis, MO | 2.0 | 1.0 | 1085 | $1,075 | $0.99 | 23d | 1 | 0.33mi |
| 2546 Main St Saint Louis, MO | 4.0 | 1.0 | 984 | $1,269 | $1.29 | 43d | 1 | 0.38mi |
| 8908 Scottdale Ave Jennings, MO | 2.0 | 1.0 | 790 | $1,000 | $1.27 | 43d | 1 | 0.47mi |
| 2623 Avie Dr Saint Louis, MO | 3.0 | 2.0 | 921 | $1,350 | $1.47 | 43d | 1 | 0.49mi |
| 8347 Eton Pl Saint Louis, MO | 2.0 | 1.0 | 750 | $1,075 | $1.43 | 43d | 1 | 0.50mi |
| 8344 Eton Pl Saint Louis, MO | 2.0 | 1.0 | 750 | $895 | $1.19 | 4d | 1 | 0.51mi |
| 2022 McLaran Ave Saint Louis, MO | 3.0 | 2.0 | 1181 | $1,593 | $1.35 | 14d | 1 | 0.62mi |
| 8527 Dianthus Ln Saint Louis, MO | 3.0 | 1.0 | 976 | $1,295 | $1.33 | 43d | 1 | 0.67mi |
| 7205 Calvin Ave Saint Louis, MO | 3.0 | 1.0 | 832 | $750 | $0.90 | 43d | 1 | 0.67mi |
| 8502 Dianthus Ln Saint Louis, MO | 2.0 | 1.0 | 1072 | $1,175 | $1.10 | 23d | 1 | 0.73mi |
| 1942 Damato Ct Saint Louis, MO | 2.0 | 1.0 | 905 | $1,100 | $1.22 | 43d | 1 | 0.73mi |
| 7142 Lamont Dr Saint Louis, MO | 2.0 | 1.0 | 750 | $1,100 | $1.47 | 17d | 1 | 0.76mi |
| 7441 Calvin Ave Saint Louis, MO | 3.0 | 1.0 | 1068 | $1,350 | $1.26 | 12d | 1 | 0.77mi |
| 7426 Calvin Ave Saint Louis, MO | 2.0 | 1.0 | 1100 | $1,125 | $1.02 | 17d | 1 | 0.78mi |
| 2056 Coleridge Dr Saint Louis, MO | 3.0 | 1.0 | 949 | $1,195 | $1.26 | 23d | 1 | 0.80mi |
| 5640 Sapphire Ave Saint Louis, MO | 2.0 | 1.0 | 900 | $1,100 | $1.22 | 43d | 1 | 0.84mi |
| 5615 Beldon Dr Saint Louis, MO | 2.0 | 1.0 | 850 | $950 | $1.12 | 43d | 1 | 0.86mi |
| 7120 Greenhaven Dr Saint Louis, MO | 3.0 | 2.0 | 1131 | $1,050 | $0.93 | 23d | 1 | 0.90mi |
| 5613 Statler Ave Saint Louis, MO | 2.0 | 1.0 | 864 | $1,300 | $1.50 | 4d | 1 | 0.92mi |
| 9547 Glen Owen Dr Saint Louis, MO | 2.0 | 1.0 | 923 | $985 | $1.07 | 23d | 1 | 0.92mi |
| 5637 Jennings Station Rd Saint Louis, MO | 3.0 | 1.0 | 1116 | $895 | $0.80 | 43d | 1 | 0.96mi |
| 7315 Albright Ave Saint Louis, MO | 3.0 | 1.0 | 888 | $1,150 | $1.30 | 43d | 1 | 0.99mi |
| 9418 Pattonwood Dr Saint Louis, MO | 2.0 | 2.0 | 982 | $1,500 | $1.53 | 23d | 1 | 1.00mi |
| 7218 Albright Ave Saint Louis, MO | 2.0 | 1.0 | 1100 | $980 | $0.89 | 23d | 1 | 1.00mi |
| 7304 Albright Ave Saint Louis, MO | 2.0 | 1.0 | 800 | $1,100 | $1.38 | 43d | 1 | 1.01mi |
| 5955 Floy Ave Saint Louis, MO | 2.0 | 1.0 | 1032 | $1,050 | $1.02 | 3d | 1 | 1.02mi |
| 7414 Pleaseway Dr Saint Louis, MO | 2.0 | 1.0 | 768 | $1,100 | $1.43 | 43d | 1 | 1.02mi |
| 7420 Pleaseway Dr Saint Louis, MO | 2.0 | 1.0 | 952 | $1,250 | $1.31 | 22d | 1 | 1.03mi |
| 2152 Nemnich Rd Saint Louis, MO | 2.0 | 1.5 | 1030 | $1,100 | $1.07 | 43d | 1 | 1.05mi |
| 5516 Fairridge Ct Saint Louis, MO | 2.0 | 1.0 | 1110 | $995 | $0.90 | 23d | 1 | 1.06mi |
| 5932 Floy Ave Saint Louis, MO | 3.0 | 1.0 | 1080 | $1,373 | $1.27 | 20d | 1 | 1.06mi |
| 5612 Hodiamont Ave Saint Louis, MO | 3.0 | 1.5 | 1200 | $1,150 | $0.96 | 10d | 1 | 1.11mi |
| 9709 Balboa Dr Saint Louis, MO | 3.0 | 1.0 | 1000 | $1,600 | $1.60 | 43d | 1 | 1.15mi |
Listing history 23 events
-
2026-06-18days on market $79,900 Active 105 DOM
-
2026-06-17days on market $79,900 Active 104 DOM
-
2026-06-16pricedays on market $79,900 Active 103 DOM
-
2026-06-15days on market $89,900 Active 102 DOM
-
2026-06-13days on market $89,900 Active 100 DOM
-
2026-06-09days on market $89,900 Active 96 DOM
-
2026-06-08days on market $89,900 Active 95 DOM
-
2026-06-07days on market $89,900 Active 94 DOM
-
2026-06-03days on market $89,900 Active 90 DOM
-
2026-06-02days on market $89,900 Active 89 DOM
-
2026-06-01days on market $89,900 Active 88 DOM
-
2026-05-31days on market $89,900 Active 87 DOM
-
2026-05-01price $99,900 1166-char remark
Show marketing remark (1166 chars)
Stunning brick bungalow full of character and charm! This spacious 4-bedroom, 1-bath home welcomes you with fantastic curb appeal, natural light, and neutral colors that create a warm and inviting atmosphere throughout. Step inside to a huge living room featuring a beautiful masonry fireplace—perfect for cozy evenings and gathering with friends and family. Gorgeous wood floors flow through much of the main level, adding timeless style. The main floor includes the primary bedroom and an additional guest bedroom, a full bathroom, and a formal dining room ideal for entertaining. The bright kitchen offers great functionality and comes equipped with a range and refrigerator. Upstairs, you’ll find two additional bedrooms providing extra space for family, guests, or a home office. Outside, enjoy a large yard, a covered back porch perfect for relaxing, and a detached 1-car garage for added convenience. The full basement includes laundry hookups and plenty of room for storage or future possibilities. With classic bungalow charm, generous living space, and desirable features throughout, this St. Louis home is one you won’t want to miss!
-
2026-03-05$104,900 Active 1166-char remark
Show marketing remark (1166 chars)
Stunning brick bungalow full of character and charm! This spacious 4-bedroom, 1-bath home welcomes you with fantastic curb appeal, natural light, and neutral colors that create a warm and inviting atmosphere throughout. Step inside to a huge living room featuring a beautiful masonry fireplace—perfect for cozy evenings and gathering with friends and family. Gorgeous wood floors flow through much of the main level, adding timeless style. The main floor includes the primary bedroom and an additional guest bedroom, a full bathroom, and a formal dining room ideal for entertaining. The bright kitchen offers great functionality and comes equipped with a range and refrigerator. Upstairs, you’ll find two additional bedrooms providing extra space for family, guests, or a home office. Outside, enjoy a large yard, a covered back porch perfect for relaxing, and a detached 1-car garage for added convenience. The full basement includes laundry hookups and plenty of room for storage or future possibilities. With classic bungalow charm, generous living space, and desirable features throughout, this St. Louis home is one you won’t want to miss!
-
2021-04-02soldstatus $26,000
-
2020-06-08soldstatus
-
2009-02-23soldstatus $48,000
-
2009-02-23soldstatus $50,500
-
2004-12-27soldstatus $79,900
-
2004-10-27soldstatus $28,000
-
2004-10-27soldstatus $38,000
-
2004-10-27soldstatus $45,500
-
2001-05-22soldstatus $68,500
ⓘ Source: listings_history table (triggers on properties + properties_extension) + one-shot
backfill from property_details.listing_events for pre-trigger history.
Tax reassessment forecast MO · Resets to sale price
- Current annual tax
- $1,521 · $127/mo
- Projected year-2 tax
- $1,521 · $127/mo
- Expected delta
- $0/yr ($0/mo · 0.0%)
ⓘ Screening estimate from a state-policy table — verify with the county assessor before closing.
Climate risk First Street
- Flood 1/10 Low FEMA zone X (unshaded) · 0% chance over 30 yrs
- Wildfire 1/10 Low
- Heat 4/10 Moderate 7 d/yr ≥107°F today · 19 d/yr by 30 yrs out
- Wind 2/10 Low 100% chance of damaging wind over 30 yrs
- Air quality 4/10 Moderate 4 unhealthy d/yr today · 5 by 30 yrs out
Nearby sold comps map
Loading sold comps map…
Walkable amenities ~0.75 mi
Loading nearby amenities…
Taxation est. · year 1
- Rental income
- $14,847
- − Mortgage interest
- −$4,476
- − Property taxes
- −$1,521
- − Insurance
- −$400
- − Repairs & maintenance
- −$1,188
- − Management
- −$1,188
- − Depreciation
- −$2,324
- Taxable income
- $3,751
- Est. tax owed @ 24.0%
- −$900
- After-tax cash flow
- $3,881/yr
For passive investors: Depreciation is non-cash, so a rental often shows a tax loss while cash-flowing — sheltering income. Rental losses are passive: they offset passive income freely, and up to $25,000/yr can offset ordinary (W-2) income if you actively participate and your MAGI is under $100k (phasing out to $0 by $150k); unused losses carry forward. On sale, claimed depreciation is recaptured at up to 25%, and gains may owe capital-gains tax (a 1031 exchange can defer both). Figures are a year-1 estimate at your 24.0% rate — not tax advice; consult a CPA.
Schools (NCES district)
- District
- Jennings
- NCES district ID
- 2916290
- Math proficiency
- 8% ▼ -16.00%
- Reading proficiency
- 20% ▼ -4.00%
- Median HH income
- $30,595
- Composite
- 11.04/100
- National rank
- #9739
- State rank
- #315 of 324 in MO
Livability — Jennings
- Score
- 67/100
- State rank
- #208
- US rank
- #10499
Category grades
Schools grade is shown separately in the Schools card above.
Census & demographics
- Census place
- Jennings, MO
- County
- Saint Louis County · 888,823 people
- Metro
- St. Louis, MO-IL
- Population (ZIP)
- 40,929
- Household income
- $41,154
- Rent vs Own
- Severe rent burden
- 3085.0
Population outlook (St. Louis County) Hauer SSP2
- Today (2025)
- 1,025,227 people
- By 2030
- 1,028,023 · +0.3%
- By 2040
- 1,020,940 · -0.4%
- By 2050
- 1,007,280 · -1.8%
- By 2075
- 987,277 · -3.7%
- By 2100
- 921,984 · -10.1%
Race, ethnicity, and origin ACS 2023
- Neighborhood character
- Predominantly Black (90%)
- Race & ethnicity
- Black 90% White 5% Two or more races 3%
- Foreign-born
- 1% · Canada
Political lean MEDSL · St. Louis
- 2024 margin
- Strong D (+23.4) · D 60.8% · R 37.4% · Other 1.7%
- 2008→2024 swing
- +3.5pp toward D · 2008: 19.9pp · 2024: 23.4pp
- All cycles
- 2024: D+23.4 2020: D+24.0 2016: D+16.2 2012: D+13.7 2008: D+19.9
Not yet ingested
- Civics
- —
Market trends
- HPI YoY
- ▲ 3.79%
- Current HPI
- 420.28
- Rent YoY
- ▲ 4.97%
- Metro
- St. Louis, MO-IL
- State GDP YoY
- ▲ 1.84%
- F500 in state
- 20
Industry mix (Fortune 500 HQ in MO)
| Industry | F500 HQs | Revenue |
|---|---|---|
| Healthcare | 1 | $163B |
|
||
| Insurance | 1 | $21B |
|
||
| Industrial Technology | 1 | $17B |
|
||
| Retail | 1 | $16B |
|
||
| Industrial Distribution | 1 | $10B |
|
||
| Utilities | 1 | $9B |
|
||
Price history
+45.8% since first listed11 events — show timeline
- 2026-05-01 Price Changed $99,900 MARIS as Distributed by MLS Grid
- 2026-03-05 Listed $104,900 MARIS as Distributed by MLS Grid
- 2021-04-02 Sold (Public Records) $26,000 Public Records
- 2020-06-08 Sold (Public Records) — Public Records
- 2009-02-23 Sold (Public Records) $50,500 Public Records
- 2009-02-23 Sold (Public Records) $48,000 Public Records
- 2004-12-27 Sold (Public Records) $79,900 Public Records
- 2004-10-27 Sold (Public Records) $45,500 Public Records
- 2004-10-27 Sold (Public Records) $38,000 Public Records
- 2004-10-27 Sold (Public Records) $28,000 Public Records
- 2001-05-22 Sold (Public Records) $68,500 Public Records
Property tax history
+4.3%/yrLatest (2022): $1,521 · +1.5% YoY. Source: county tax records.
Cash-flow waterfall
monthlySold comps — $/sqft
last 12 mo · ≤1 miLoading sold comps…