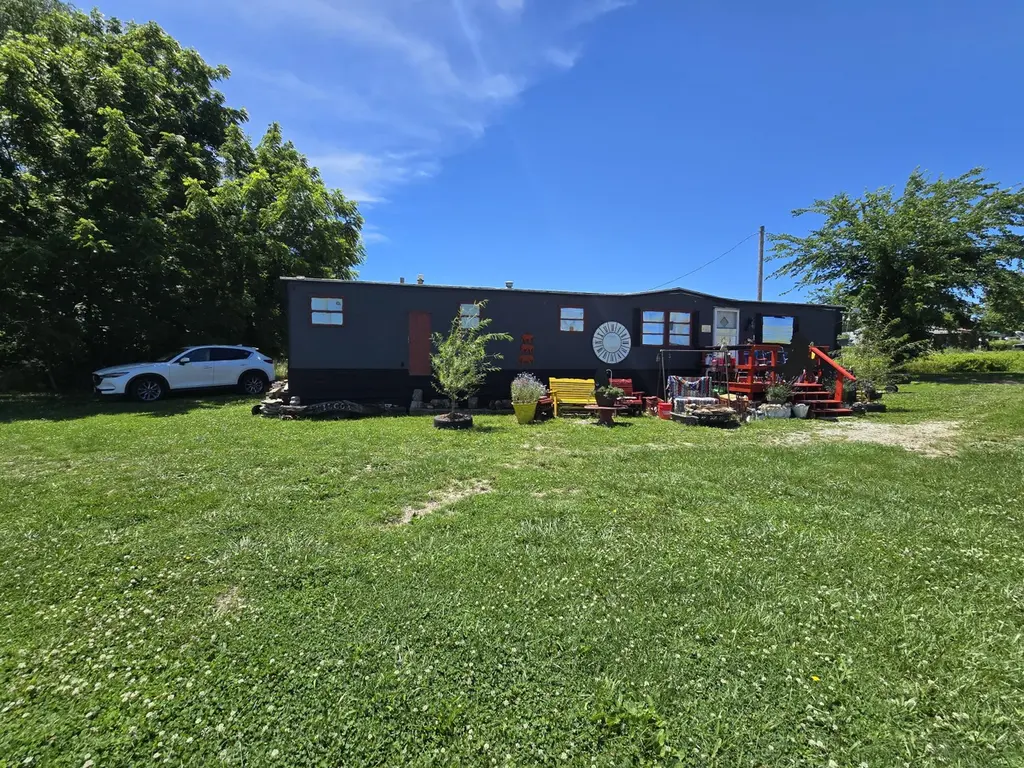
125 N Dallas St · Urbana, MO
Flood risk No data
- FEMA flood zone
- —
- Chance of flooding over 30 yrs
- —
- Est. flood insurance / yr
- —
Fire risk No data
- Est. fire insurance / yr
- —
Heat risk No data
- Hot days now (above threshold)
- —
- Hot days in 30 yrs
- —
Wind risk No data
- Chance of severe wind over 30 yrs
- —
Air-quality risk No data
- Unhealthy air days now
- —
- Unhealthy air days in 30 yrs
- —
Risk factors via First Street. Map © Google.
Why this score? — see what drove the B+ grade
The composite is a weighted blend of 9 inputs, each scored 0–100. Each bar is that input's sub-score; the figure is the points it added to the 100-point composite (weight × sub-score).
- Cash flow +29.3/30.0
- DSCR +10.0/10.0
- 1% rule +8.2/10.0
- Appreciation +8.2/10.0
- ARV discount +7.5/15.0
- Schools +5.4/10.0
- Livability +2.9/5.0
- Rent growth +2.5/5.0
- Condition / age +2.2/5.0
$60,000
🖨 Deal sheet 📄 Offer letter ✓ Due diligence
Listing remarks
🏡 Affordable, Simple, and Already Producing Income. Not every property needs granite countertops and a Pinterest board. Sometimes you just need a place to live, a rental to add to the portfolio, or an affordable way to get started. Located in the Skyline School District, this older mobile home sits right in town with easy access to the essentials. Gas station, Dollar General, bank, post office, and everyday conveniences are all just minutes away. 💰 Bonus: The property currently generates $100 per month from highway sign rental income, putting money in your pocket from day one. Whether you're looking for a budget-friendly home, investment property, or a project with upside, this one is wort
Key facts
- 0.3 acre lot
- Built 1980
- Listed 5 days
Neighborhood map
What this means for you Summary
Snapshot
- This is a 2-bed/1.0-bath manufactured listed at $60k. Condition is rated fair.
Deal economics
- At list price, monthly cash flow is $212 ($3k/yr) — positive.
- The deal already cash-flows at list — no discount required.
- Meets the 1% rule at list price ($793 rent vs $60k).
- Cap rate 10.5% vs local median 4.2% in Urbana — top-decile yield for the area; either an underpriced asset or a hidden risk that comps aren't pricing in. Stress-test before assuming the spread holds.
Location & tenants
- Location reads 57/100 on livability (#629 in MO) — a working-class tenant base; expect higher turnover. Strengths: cost of living A+, housing A+; Watch: crime F, amenities F, commute F.
- Hickory County R-I (rural): math 65% / reading 66% proficiency, ranked #8 of 324 in MO (top 2%) — acceptable for families but not a draw, mixed tenant base, ~2y average lease.
- Market conditions: 35 active listings in the ZIP; 8 units permitted in Dallas County in 2024 (0 in 5+ unit buildings).
Forward outlook
- In year one you build about $4k of equity ($415 loan paydown + $4k appreciation (6.3% local appreciation)).
- Dallas County population projected at -26% by 2050 — secular population decline; favor cash flow + early exit over multi-decade hold.
- At projected returns (6.3% appreciation + 3.0% rent growth), your $17k cash investment doubles in ~3 years — after that, you're playing with house money.
- By year 8, paydown + projected appreciation supports a ~$33k cash-out refi (75% LTV) — recoverable capital for the next deal without selling this one.
Negotiation context
- Only 6 days on market — expect competitive offers; lowballing is unlikely to land.
Questions for the listing agent
- Have any recent inspections been done? Can we get a copy of the seller's disclosures and any deferred-maintenance estimates?
- Is there a deadline driving the sale (1031 exchange, divorce, estate, relocation)? That informs how much negotiation room exists.
- Schools are B-rated — typically a magnet for longer-tenancy family renters. What's the average tenant stay here, and is there a school-zone premium baked into asking?
- Crime grade is F in this area — have there been break-ins, vandalism, or insurance claims at this property in the last 3 years? What carrier currently insures it and at what premium?
- What's the average days-on-market for RENTAL listings here right now (not sales)? A rising rental-DOM trend means longer vacancies and softer asking-rent achievability than the comps imply.
- What's the recent tenant-quality profile in this submarket — average credit score on applications, eviction rate, late-payment / NSF rate, and stable-employment percentage? A property-management company in the area should have these aggregated.
- How much new for-sale + rental construction is in the pipeline within 1–3 miles? Heavy new supply typically softens prices + rents 12–24 months out; constrained supply supports both.
Investment metrics
- 1% rule
- 1.32% ✓
- Cap rate
- 10.53%
- Cash-on-cash
- 15.13%
- DSCR
- 1.67
- GRM
- 6.3
CMA / ARV
No comps found within radius.
Projected returns pro-forma
6.35% appreciation · 3.0% rent growth · sell at horizon
- IRR
- 28.7%
- Equity multiple
- 2.91×
- Total profit
- $32,075
- Equity at exit
- $39,049
- IRR
- 26.5%
- Equity multiple
- 5.97×
- Total profit
- $83,503
- Equity at exit
- $71,991
Cash invested: $16,800 (down + closing). Projections, not guarantees.
Landlord ↔ Tenant lean methodology
- Overall (STATE)
- 81 Strongly Landlord-Friendly
- State Missouri
- 81 Strongly Landlord-Friendly · R+10
- County
- — inherits STATE
- City
- — inherits STATE
ZIP-level market 65767
- Home prices YoY
- 2.5%
- Active inventory
- 35
- Price-to-rent
- 6.3×
Monthly cashflow live
- Estimated rent
- $793 medium interval (Pro) →
- Mortgage (P&I)
- −$315
- Tax est. 1.5%
- −$75 /mo · $900/yr
- Insurance
- −$25
- HOA
- −$0
- Vacancy / Maint / Mgmt
- −$167
- Net cashflow
- $212
Break-even live
UW: 25.0% down · 7.5% · 30yr · 1.5% tax · 5.0% vac · 8.0% maint · 8.0% mgmt
Financing live
Cash to close
- Down payment
- $15,000
- Closing costs
- $1,800
- Reserves months
- —
- Total cash needed
- —
Loan-product check · same deal, 3 products live
Conventional
25% down · 7.5% · 30yr
- Down + closing
- —
- Monthly P&I
- —
- Monthly cashflow
- —
- DSCR
- —
- Eligible?
- —
Personal DTI + credit; lowest rate.
DSCR
20% down · 8.5% · 30yr
- Down + closing
- —
- Monthly P&I
- —
- Monthly cashflow
- —
- DSCR
- —
- Eligible?
- —
No personal income docs; deal must DSCR.
Hard money
10% down · 12.0% · 12mo
- Down + closing
- —
- Monthly P&I
- —
- Monthly cashflow
- —
- DSCR
- —
- Eligible?
- —
Short-term bridge; refi at stabilization.
Listing history 7 events
-
2026-06-19days on market $60,000 Active 6 DOM
-
2026-06-18days on market $60,000 Active 5 DOM
-
2026-06-17days on market $60,000 Active 4 DOM
-
2026-06-16days on market $60,000 Active 3 DOM
-
2026-06-15days on market $60,000 Active 2 DOM
-
2026-06-14remarks 698-char remark
-
2026-06-14$60,000 Active 1 DOM
ⓘ Source: listings_history table (triggers on properties + properties_extension) + one-shot
backfill from property_details.listing_events for pre-trigger history.
Nearby sold comps map
Loading sold comps map…
Walkable amenities ~0.75 mi
Loading nearby amenities…
Taxation est. · year 1
- Rental income
- $9,516
- − Mortgage interest
- −$3,361
- − Property taxes
- −$900
- − Insurance
- −$300
- − Repairs & maintenance
- −$761
- − Management
- −$761
- − Depreciation
- −$1,745
- Taxable income
- $1,687
- Est. tax owed @ 24.0%
- −$405
- After-tax cash flow
- $2,137/yr
For passive investors: Depreciation is non-cash, so a rental often shows a tax loss while cash-flowing — sheltering income. Rental losses are passive: they offset passive income freely, and up to $25,000/yr can offset ordinary (W-2) income if you actively participate and your MAGI is under $100k (phasing out to $0 by $150k); unused losses carry forward. On sale, claimed depreciation is recaptured at up to 25%, and gains may owe capital-gains tax (a 1031 exchange can defer both). Figures are a year-1 estimate at your 24.0% rate — not tax advice; consult a CPA.
Condition & rehab AI · 6 photos
This mobile home is in poor condition and requires extensive repairs and maintenance to improve its condition and increase its value.
Repairs flagged
- Major roof — Significant wear and tear on the roof.
- Major exterior siding — Significant wear and tear on the exterior siding.
- Major windows — Significant wear and tear on the windows.
- Major foundation/structure — Significant wear and tear on the foundation and structure.
- Major HVAC/mechanicals — No visible systems, but likely in poor condition based on the overall condition of the property.
- Major landscaping — Overgrown grass and debris scattered around the property, indicating a lack of maintenance.
Value-add opportunities
- Both paint the exterior and interior — Painting the exterior and interior will improve the appearance and increase the property's value.
- Both repair and replace the roof — A new roof will improve the property's appearance and increase its value.
- Both repair and replace the windows — New windows will improve the property's appearance and increase its value.
- Both repair and replace the HVAC/mechanicals — Upgrading the HVAC and mechanical systems will improve the property's comfort and increase its value.
- Both landscape and maintain the property — A well-maintained landscape will improve the property's curb appeal and increase its value.
Renovation cost estimate screening
| Repair item | Severity | Est. cost |
|---|---|---|
| roof · Significant wear and tear on the roof. | Major | $15,000–50,000 |
| exterior siding · Significant wear and tear on the exterior siding. | Major | $15,000–50,000 |
| windows · Significant wear and tear on the windows. | Major | $15,000–50,000 |
| foundation/structure · Significant wear and tear on the foundation and structure. | Major | $15,000–50,000 |
| HVAC/mechanicals · No visible systems, but likely in poor condition based on the overall condition of the property. | Major | $15,000–50,000 |
| landscaping · Overgrown grass and debris scattered around the property, indicating a lack of maintenance. | Major | $15,000–50,000 |
| Total estimated repair cost · 6 items | $90,000–300,000 |
Value-add ROI direction
- Both paint the exterior and interior — Painting the exterior and interior will improve the appearance and increase the property's value. ↑
- Both repair and replace the roof — A new roof will improve the property's appearance and increase its value. ↑
- Both repair and replace the windows — New windows will improve the property's appearance and increase its value. ↑
- Both repair and replace the HVAC/mechanicals — Upgrading the HVAC and mechanical systems will improve the property's comfort and increase its value. ↑
- Both landscape and maintain the property — A well-maintained landscape will improve the property's curb appeal and increase its value. ↑
ⓘ Cost ranges are severity-bucket heuristics (US national rule-of-thumb). Get contractor quotes + a written scope before underwriting a rehab budget.
Schools (NCES district)
- District
- Hickory County R-I
- NCES district ID
- 2914320
- Math proficiency
- 65% ▼ -4.00%
- Reading proficiency
- 66% ▲ 1.00%
- Median HH income
- $33,125
- Composite
- 54.03/100
- National rank
- #1393
- State rank
- #8 of 324 in MO
Livability — Urbana
- Score
- 57/100
- State rank
- #629
- US rank
- #21576
Category grades
Schools grade is shown separately in the Schools card above.
Census & demographics
- Census place
- Urbana, MO
- Population (ZIP)
- 1,860
Population outlook (Dallas County) Hauer SSP2
- Today (2025)
- 15,419 people
- By 2030
- 14,668 · -4.9%
- By 2040
- 13,045 · -15.4%
- By 2050
- 11,341 · -26.4%
- By 2075
- 8,096 · -47.5%
- By 2100
- 5,656 · -63.3%
Race, ethnicity, and origin ACS 2023
- Neighborhood character
- Predominantly White (94%)
- Race & ethnicity
- White 94% Two or more races 5%
- Common ancestry
- Romanian 14% Iranian 9% Italian 1%
- Foreign-born
- 0%
Political lean MEDSL · Dallas
- 2024 margin
- Solid R (+64.6) · D 17.3% · R 81.8%
- 2008→2024 swing
- -35.4pp toward R · 2008: -29.1pp · 2024: -64.6pp
- All cycles
- 2024: R+64.6 2020: R+64.7 2016: R+62.1 2012: R+39.4 2008: R+29.1
Not yet ingested
- Civics
- —
Market trends
- HPI YoY
- ▲ 6.35%
- Current HPI
- 256.3794
- Rent YoY
- —
- Metro
- —
- State GDP YoY
- ▲ 1.84%
- F500 in state
- 20
Industry mix (Fortune 500 HQ in MO)
| Industry | F500 HQs | Revenue |
|---|---|---|
| Healthcare | 1 | $163B |
|
||
| Insurance | 1 | $21B |
|
||
| Industrial Technology | 1 | $17B |
|
||
| Retail | 1 | $16B |
|
||
| Industrial Distribution | 1 | $10B |
|
||
| Utilities | 1 | $9B |
|
||
Price history
1 event — show timeline
- 2026-06-13 Listed $60,000 SOMO
Cash-flow waterfall
monthlySold comps — $/sqft
last 12 mo · ≤1 miLoading sold comps…