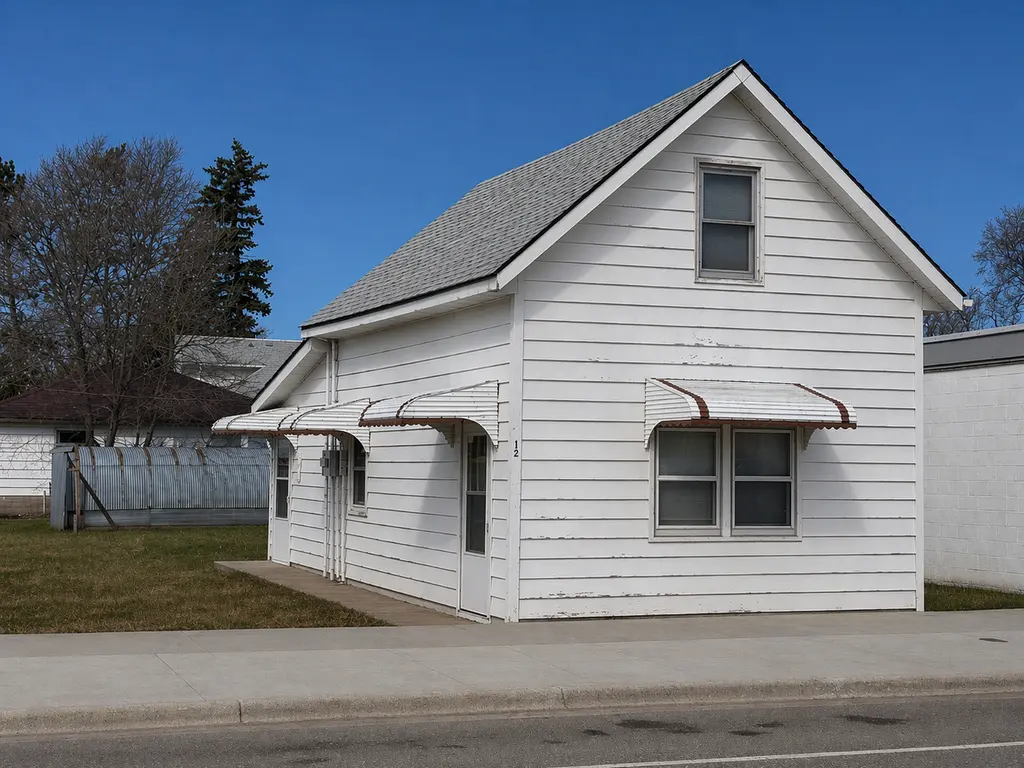
126 Central Ave N · Eagle Bend, MN
Flood risk 1/10 · Minimal
- FEMA flood zone
- X (unshaded)
- Chance of flooding over 30 yrs
- 0.0%
- Est. flood insurance / yr
- $507 – $1,088
Fire risk 4/10 · Minor
- Est. fire insurance / yr
- $888 – $1,650
Heat risk 1/10 · Minimal
- Hot days now (above 97°F)
- 7 days/yr
- Hot days in 30 yrs
- 12 days/yr
Wind risk 2/10 · Minimal
- Chance of severe wind over 30 yrs
- —
Air-quality risk 2/10 · Minimal
- Unhealthy air days now
- 1 days/yr
- Unhealthy air days in 30 yrs
- 1 days/yr
Risk factors via First Street. Map © Google.
Why this score? — see what drove the C+ grade
The composite is a weighted blend of 9 inputs, each scored 0–100. Each bar is that input's sub-score; the figure is the points it added to the 100-point composite (weight × sub-score).
- Cash flow +23.0/30.0
- ARV discount +7.5/15.0
- DSCR +7.4/10.0
- Appreciation +7.3/10.0
- 1% rule +5.4/10.0
- Schools +4.3/10.0
- Livability +3.2/5.0
- Rent growth +2.5/5.0
- Condition / age +2.5/5.0
$115,000
🖨 Deal sheet 📄 Offer letter ✓ Due diligence
Listing remarks
MOVE-IN READY & AFFORDABLE-FULLY UPDATED! Don't miss this beautifully refreshed 2-BEDROOM, 1-BATH HOME offering 1300 sq ft of comfortable living space at an affordable price. This home has been thoughtfully updated with all new flooring and fresh paint throughout, creating a clean, move-in-ready feel. The two-story layout provides great separation of space, while all essential living facilities are conveniently located on the main floor making day to day living easy and accessible. The kitchen offers ample cabinet storage and flexibility including main floor laundry and a convenient main floor full bathroom. Both bedrooms are well sized making this home ideal for a first-time buyer, d
Key facts
- Fresh paint
- Fully updated
- New flooring
Tags
Neighborhood map
What this means for you Summary
Snapshot
- This is a 2-bed/1.0-bath single-family listed at $115k.
Deal economics
- At list price, monthly cash flow is $205 ($2k/yr) — positive.
- The deal already cash-flows at list — no discount required.
- Meets the 1% rule at list price ($1k rent vs $115k).
Location & tenants
- Location reads 63/100 on livability (#663 in MN) — a middle-class / working-renter tenant base. Strengths: cost of living A+, housing A+; Watch: health & safety C-, crime D, employment D.
- Bertha-Hewitt Public School District (rural): math 49% / reading 53% proficiency, ranked #120 of 301 in MN (top 40%) — acceptable for families but not a draw, mixed tenant base, ~2y average lease.
- Market conditions: 14 active listings in the ZIP; 1 comparable units currently listed for rent nearby; 167 units permitted in Todd County in 2024 (78 in 5+ unit buildings).
Forward outlook
- In year one you build about $6k of equity ($795 loan paydown + $5k appreciation (4.7% local appreciation)).
- Todd County population projected at -28% by 2050 — secular population decline; favor cash flow + early exit over multi-decade hold.
- At projected returns (4.7% appreciation + 3.0% rent growth), your $32k cash investment doubles in ~4 years — after that, you're playing with house money.
- By year 6, paydown + projected appreciation supports a ~$33k cash-out refi (75% LTV) — recoverable capital for the next deal without selling this one.
Negotiation context
- Only 5 days on market — expect competitive offers; lowballing is unlikely to land.
Risks & watch-outs
- Watch-outs: built in 1928 — expect roof / HVAC / electrical / plumbing capex.
Questions for the listing agent
- Built in 1928 — when were the roof, HVAC, electrical panel, plumbing, and water heater last replaced?
- Is there a deadline driving the sale (1031 exchange, divorce, estate, relocation)? That informs how much negotiation room exists.
- Schools are F-rated, which usually means shorter tenancies and higher turnover. Who's the typical renter profile here, and what's been the actual vacancy rate?
- Crime grade is D in this area — have there been break-ins, vandalism, or insurance claims at this property in the last 3 years? What carrier currently insures it and at what premium?
- What's the average days-on-market for RENTAL listings here right now (not sales)? A rising rental-DOM trend means longer vacancies and softer asking-rent achievability than the comps imply.
- What's the recent tenant-quality profile in this submarket — average credit score on applications, eviction rate, late-payment / NSF rate, and stable-employment percentage? A property-management company in the area should have these aggregated.
- How much new for-sale + rental construction is in the pipeline within 1–3 miles? Heavy new supply typically softens prices + rents 12–24 months out; constrained supply supports both.
Investment metrics
- 1% rule
- 1.04% ✓
- Cap rate
- 8.43%
- Cash-on-cash
- 7.64%
- DSCR
- 1.34
- GRM
- 8.0
CMA / ARV
No comps found within radius.
Projected returns pro-forma
4.67% appreciation · 3.0% rent growth · sell at horizon
- IRR
- 18.7%
- Equity multiple
- 2.16×
- Total profit
- $37,406
- Equity at exit
- $62,888
- IRR
- 18.8%
- Equity multiple
- 4.19×
- Total profit
- $102,831
- Equity at exit
- $106,696
Cash invested: $32,200 (down + closing). Projections, not guarantees.
Landlord ↔ Tenant lean methodology
- Overall (STATE)
- 46 Balanced
- State Minnesota
- 46 Balanced · D+2
- County
- — inherits STATE
- City
- — inherits STATE
ZIP-level market 56446
- Home prices YoY
- 3.1%
- Active inventory
- 14
- Price-to-rent
- 8.0×
Monthly cashflow live
- Estimated rent
- $1,195 medium interval (Pro) →
- Mortgage (P&I)
- −$603
- Tax from tax record
- −$88 /mo · $1,056/yr
- Insurance
- −$48
- HOA
- −$0
- Vacancy / Maint / Mgmt
- −$251
- Net cashflow
- $205
Break-even live
UW: 25.0% down · 7.5% · 30yr · 1.5% tax · 5.0% vac · 8.0% maint · 8.0% mgmt
Financing live
Cash to close
- Down payment
- $28,750
- Closing costs
- $3,450
- Reserves months
- —
- Total cash needed
- —
Loan-product check · same deal, 3 products live
Conventional
25% down · 7.5% · 30yr
- Down + closing
- —
- Monthly P&I
- —
- Monthly cashflow
- —
- DSCR
- —
- Eligible?
- —
Personal DTI + credit; lowest rate.
DSCR
20% down · 8.5% · 30yr
- Down + closing
- —
- Monthly P&I
- —
- Monthly cashflow
- —
- DSCR
- —
- Eligible?
- —
No personal income docs; deal must DSCR.
Hard money
10% down · 12.0% · 12mo
- Down + closing
- —
- Monthly P&I
- —
- Monthly cashflow
- —
- DSCR
- —
- Eligible?
- —
Short-term bridge; refi at stabilization.
Rent comps 1 comps
| Address | Beds | Baths | Sqft | Rent | $/sqft | DOM | Units | Dist |
|---|---|---|---|---|---|---|---|---|
| 135 North St W Unit A Eagle Bend, MN | 2.0 | 1.0 | 1035 | $1,195 | $1.15 | 43d | 1 | 0.08mi |
Listing history 3 events
-
2026-04-26status Pending
-
2026-04-26price $115,000
-
2026-04-21$110,000 Active
ⓘ Source: listings_history table (triggers on properties + properties_extension) + one-shot
backfill from property_details.listing_events for pre-trigger history.
Tax reassessment forecast MN · Partial reset (capped growth)
- Current annual tax
- $1,056 · $88/mo
- Projected year-2 tax
- $1,172 · $98/mo
- Expected delta
- +$116/yr (+$10/mo · 11.0%)
ⓘ Screening estimate from a state-policy table — verify with the county assessor before closing.
Climate risk First Street
- Flood 1/10 Low FEMA zone X (unshaded) · 0% chance over 30 yrs
- Wildfire 4/10 Moderate
- Heat 1/10 Low 7 d/yr ≥97°F today · 12 d/yr by 30 yrs out
- Wind 2/10 Low
- Air quality 2/10 Low 1 unhealthy d/yr today · 1 by 30 yrs out
Nearby sold comps map
Loading sold comps map…
Walkable amenities ~0.75 mi
Loading nearby amenities…
Taxation est. · year 1
- Rental income
- $14,340
- − Mortgage interest
- −$6,442
- − Property taxes
- −$1,056
- − Insurance
- −$575
- − Repairs & maintenance
- −$1,147
- − Management
- −$1,147
- − Depreciation
- −$3,345
- Taxable income
- $627
- Est. tax owed @ 24.0%
- −$151
- After-tax cash flow
- $2,310/yr
For passive investors: Depreciation is non-cash, so a rental often shows a tax loss while cash-flowing — sheltering income. Rental losses are passive: they offset passive income freely, and up to $25,000/yr can offset ordinary (W-2) income if you actively participate and your MAGI is under $100k (phasing out to $0 by $150k); unused losses carry forward. On sale, claimed depreciation is recaptured at up to 25%, and gains may owe capital-gains tax (a 1031 exchange can defer both). Figures are a year-1 estimate at your 24.0% rate — not tax advice; consult a CPA.
Schools (NCES district)
- District
- Bertha-Hewitt Public School District
- NCES district ID
- 2705430
- Math proficiency
- 49% ▼ -5.00%
- Reading proficiency
- 53% ▼ -6.00%
- Median HH income
- $41,200
- Composite
- 42.76/100
- National rank
- #3155
- State rank
- #120 of 301 in MN
Livability — Eagle Bend
- Score
- 63/100
- State rank
- #663
- US rank
- #15973
Category grades
Schools grade is shown separately in the Schools card above.
Census & demographics
- Census place
- Eagle Bend, MN
- Population (ZIP)
- 1,502
Population outlook (Todd County) Hauer SSP2
- Today (2025)
- 22,202 people
- By 2030
- 20,962 · -5.6%
- By 2040
- 18,352 · -17.3%
- By 2050
- 15,904 · -28.4%
- By 2075
- 11,348 · -48.9%
- By 2100
- 7,801 · -64.9%
Race, ethnicity, and origin ACS 2023
- Neighborhood character
- Predominantly White (86%)
- Race & ethnicity
- White 86% Two or more races 13% Hispanic / Latino 3%
- Common ancestry
- Portuguese 13% Romanian 11% Lithuanian 2%
- Foreign-born
- 1% · Canada
- Languages at home
- 95% English-only · German/W. Germanic 4%
Political lean MEDSL · Todd
- 2024 margin
- Solid R (+53.5) · D 22.5% · R 76.0% · Other 1.5%
- 2008→2024 swing
- -42.4pp toward R · 2008: -11.1pp · 2024: -53.5pp
- All cycles
- 2024: R+53.5 2020: R+48.8 2016: R+47.7 2012: R+16.1 2008: R+11.1
Not yet ingested
- Civics
- —
Market trends
- HPI YoY
- ▲ 4.67%
- Current HPI
- 155.836
- Rent YoY
- —
- Metro
- —
- State GDP YoY
- ▲ 2.41%
- F500 in state
- 34
Industry mix (Fortune 500 HQ in MN)
| Industry | F500 HQs | Revenue |
|---|---|---|
| Healthcare | 2 | $407B |
|
||
| Retail | 2 | $150B |
|
||
| Consumer Goods | 2 | $32B |
|
||
| Industrial Machinery | 2 | $6B |
|
||
| Agriculture | 1 | $40B |
|
||
| Healthcare / Medical Devices | 1 | $32B |
|
||
Price history
+4.5% since first listed3 events — show timeline
- 2026-04-26 Pending — NORTHSTARMLS as Distributed by MLS Grid
- 2026-04-26 Price Changed $115,000 NORTHSTARMLS as Distributed by MLS Grid
- 2026-04-21 Listed $110,000 NORTHSTARMLS as Distributed by MLS Grid
Property tax history
+9.5%/yrLatest (2025): $1,056 · -1.3% YoY. Source: county tax records.
Cash-flow waterfall
monthlySold comps — $/sqft
last 12 mo · ≤1 miLoading sold comps…