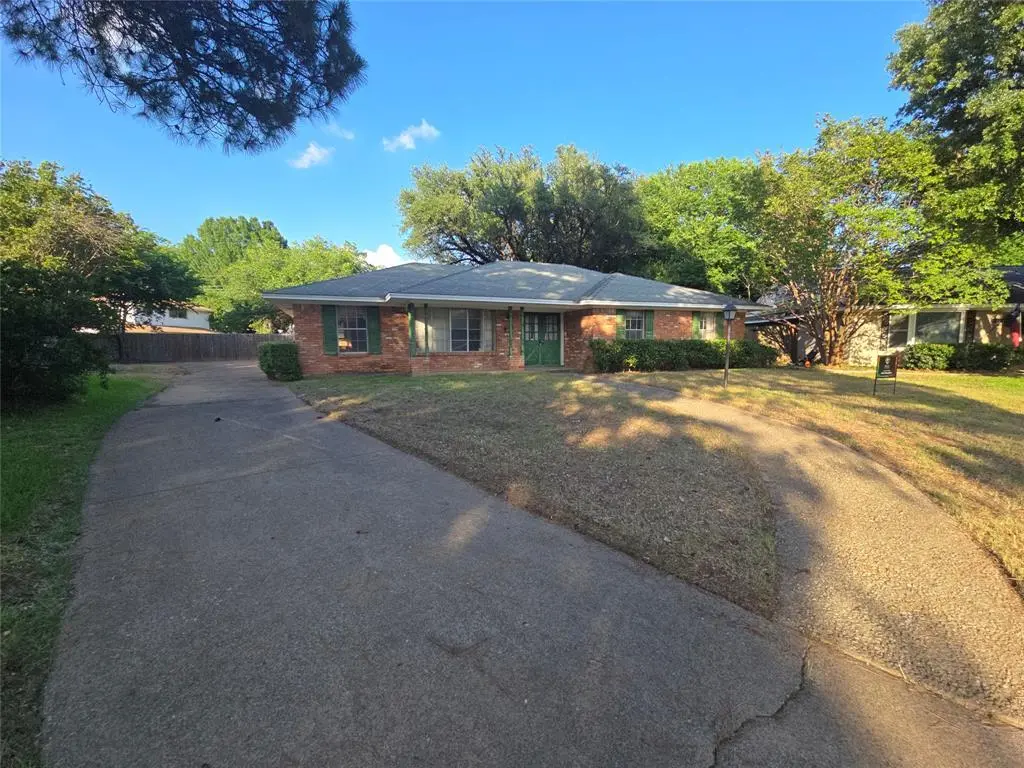
905 Glen Vista Dr N · Irving, TX
Flood risk 1/10 · Minimal
- FEMA flood zone
- X (unshaded)
- Chance of flooding over 30 yrs
- 0.0%
- Est. flood insurance / yr
- $507 – $1,088
Fire risk 1/10 · Minimal
- Est. fire insurance / yr
- $1,222 – $2,270
Heat risk 7/10 · Major
- Hot days now (above 109°F)
- 7 days/yr
- Hot days in 30 yrs
- 22 days/yr
Wind risk 6/10 · Moderate
- Chance of severe wind over 30 yrs
- 27.0%
Air-quality risk 3/10 · Minor
- Unhealthy air days now
- 2 days/yr
- Unhealthy air days in 30 yrs
- 3 days/yr
Risk factors via First Street. Map © Google.
Why this score? — see what drove the C- grade
The composite is a weighted blend of 9 inputs, each scored 0–100. Each bar is that input's sub-score; the figure is the points it added to the 100-point composite (weight × sub-score).
- Cash flow +15.0/30.0
- ARV discount +15.0/15.0
- 1% rule +6.3/10.0
- DSCR +4.6/10.0
- Livability +4.0/5.0
- Rent growth +2.7/5.0
- Condition / age +2.5/5.0
- Schools +1.9/10.0
- Appreciation +0.0/10.0
$239,900
🖨 Deal sheet (PDF) 📄 Offer letter ✓ Due diligence
Listing remarks
Opportunity knocks in one of Irving's most established and sought-after neighborhoods. This 4 bedroom 2 bath single story home sits on an oversized 0.32 acre lot in Storyglen Estates, offering one of the larger lots in the immediate area and serious upside for the right buyer. At 2,036 square feet with a 2 car attached garage and storage building, the bones are here for a strong renovation play or long term hold. Location is a genuine asset. The property sits within the Hospital District corridor, placing it minutes from Baylor Scott and White Medical Center, major employment hubs, and the Toyota Music Factory entertainment district. Quick access to I 635, SH 183, and I 35E puts the entire
Key facts
- Oversized lot
- No hoa
- 0.32 acre lot
Tags
Property features AI
Finance
- Other: Subdivision: Storyglen Estates
- Financial info: Listing terms: Cash; Loan type: Treat as clear; No second mortgage indicated
- HOA & community: No homeowners association
Exterior
- Parking: Driveway; Garage facing rear; Attached 2-car garage; 2 covered parking spaces
- Utilities: City water; City sewer; Not in a municipal utility district
- Home design: Single-family residence; Residential property; One story; Year built: 1964; Preowned
- Construction: Brick construction
- Exterior features: Wood fencing; Interior lot in a subdivision
Interior
- Kitchen: Electric oven; Electric range
- Bedrooms: 4 bedrooms (primary bedroom on main level)
- Flooring: Brick; Combination
- Bathrooms: 2 full bathrooms
- Heating & cooling: Central heating; Central air conditioning
- Interior features: Built-in features; Cable TV available; High-speed internet available; One living area; One dining area; 2 total bathrooms; 1 fireplace with brick surround; Levels: One
- Laundry & utility: Full-size washer/dryer area
Neighborhood map
What this means for you Summary
Snapshot
- This is a 4-bed/2.0-bath single-family listed at $240k.
Deal economics
- At list price, monthly cash flow is $74 ($891/yr) — positive.
- The deal already cash-flows at list — no discount required.
- Meets the 1% rule at list price ($3k rent vs $240k).
- Cap rate 6.7% vs local median 2.6% in Irving — top-decile yield for the area; either an underpriced asset or a hidden risk that comps aren't pricing in. Stress-test before assuming the spread holds.
Location & tenants
- Location reads 80/100 on livability (#45 in TX, #1,913 nationally) — a professional / high-income tenant draw. Strengths: commute A+, cost of living A+, housing A+; Watch: amenities C-.
- Irving ISD (urban): math 19% / reading 25% proficiency, ranked #751 of 826 in TX (top 91%) — low school quality limits family demand, transient renter base, plan for 1-2y turnover; 72% free/reduced lunch — lower-income household profile, screen leases tightly.
- Zoned schools: Lively El (math 12% / reading 15%, grade F, #4,138 of 4,322 statewide, top 96%, 779 students, 89% FRL); Lorenzo De Zavala Middle (math 30% / reading 32%, grade F, #1,015 of 1,662 statewide, top 62%, 853 students, 86% FRL); Irving H S (math 21% / reading 25%, grade F, #1,348 of 1,632 statewide, top 83%, 2,519 students, 86% FRL).
- Market conditions: Rents flat; 104 active listings in the ZIP; 20 comparable units currently listed for rent nearby; rentals at typical pace (median 26d on market — plan ~3-4 weeks tenant-placement turnaround); 12,577 units permitted in Dallas County in 2024 (6,829 in 5+ unit buildings).
- At $2,720/mo this rent would consume 51% of the median local household income ($64k/yr) (locally 2930% of renters already pay >50% of income on rent) — very limited rent-growth headroom before tenants either downsize or default.
Forward outlook
- Local home prices are declining (-3.0%/yr); year-one equity from $2k of loan paydown is wiped out by about $7k of value loss. Plan a longer hold.
- Dallas County population projected at +35% by 2050 — long-run rental-demand tailwind backs the buy-and-hold thesis.
Negotiation context
- Only 11 days on market — expect competitive offers; lowballing is unlikely to land.
Risks & watch-outs
- Watch-outs: property tax is 3.6% of price.
- Climate carrying-cost: major wind risk, 27% chance of damaging wind over 30y; extreme-heat days projected 7→22/yr by 2055 (HVAC capex compounding) — expect insurance premiums to compound above CPI over the hold.
Questions for the listing agent
- Built in 1964 — when were the roof, HVAC, electrical panel, plumbing, and water heater last replaced?
- Property tax is high relative to price — has the assessment been appealed recently, and will the sale trigger a re-assessment?
- Is there a deadline driving the sale (1031 exchange, divorce, estate, relocation)? That informs how much negotiation room exists.
- What's the average days-on-market for RENTAL listings here right now (not sales)? A rising rental-DOM trend means longer vacancies and softer asking-rent achievability than the comps imply.
- What's the recent tenant-quality profile in this submarket — average credit score on applications, eviction rate, late-payment / NSF rate, and stable-employment percentage? A property-management company in the area should have these aggregated.
- How much new for-sale + rental construction is in the pipeline within 1–3 miles? Heavy new supply typically softens prices + rents 12–24 months out; constrained supply supports both.
Investment metrics
- 1% rule
- 1.13% ✓
- Cap rate
- 6.66%
- Cash-on-cash
- 1.33%
- DSCR
- 1.06
- GRM
- 7.4
CMA / ARV
- ARV (on-the-fly)
- $403,128
- Comps found
- 12
Show comp detail 12 sales within ~0.75 mi
| Address | Dist | Beds/Ba | Sqft | Sold | Price | $/sf | Match |
|---|---|---|---|---|---|---|---|
| 909 W Grauwyler Rd | 0.11mi | 3/2.0 (-1) | 2,057 (+1%) | 7mo | $385,000 | $187 | 82 |
| 1225 W Grauwyler Rd | 0.33mi | 3/2.0 (-1) | 2,002 (-2%) | 9mo | $474,900 | $237 | 69 |
| 1109 Colony Dr | 0.24mi | 4/2.0 | 1,891 (-7%) | 13mo | $340,000 | $180 | 66 |
| 907 Glen Dell Dr | 0.14mi | 4/2.5 | 2,276 (+12%) | 10mo | $395,000 | $174 | 63 |
| 1013 Sleepy Hollow Dr S | 0.35mi | 4/2.0 | 2,189 (+8%) | 11mo | $434,000 | $198 | 62 |
| 1205 N Macarthur Blvd | 0.37mi | 4/2.0 | 1,860 (-9%) | 9mo | $375,000 | $202 | 61 |
| 1805 Post Oak Dr | 0.16mi | 3/2.5 (-1) | 1,829 (-10%) | 14mo | $379,000 | $207 | 57 |
| 1904 Sunnybrook Dr | 0.51mi | 3/2.0 (-1) | 1,912 (-6%) | 8mo | $420,000 | $220 | 54 |
| 1912 Sunnybrook Dr | 0.53mi | 3/2.0 (-1) | 1,826 (-10%) | 1mo | $405,000 | $222 | 52 |
| 1004 Sleepy Hollow Dr N | 0.39mi | 3/2.0 (-1) | 2,261 (+11%) | 9mo | $439,490 | $194 | 51 |
| 1906 N O Connor Rd | 0.38mi | 3/2.0 (-1) | 2,233 (+10%) | 18mo | $325,000 | $146 | 47 |
| 1601 Briarwood Ln | 0.64mi | 4/2.0 | 1,787 (-12%) | 9mo | $349,999 | $196 | 43 |
Match score weights: distance 35% · size 25% · config 20% · recency 20%. Top-matched comps best support the ARV.
Projected returns pro-forma
-3.0% appreciation · 0.72% rent growth · sell at horizon
- IRR
- -17.3%
- Equity multiple
- 0.41×
- Total profit
- $-39,947
- Equity at exit
- $35,770
- IRR
- -15.5%
- Equity multiple
- 0.23×
- Total profit
- $-51,402
- Equity at exit
- $20,742
Cash invested: $67,172 (down + closing). Projections, not guarantees.
Landlord ↔ Tenant lean methodology
- Overall (STATE)
- 87 Strongly Landlord-Friendly
- State Texas
- 87 Strongly Landlord-Friendly · R+5
- County
- — inherits STATE
- City
- — inherits STATE
ZIP-level market 75061
- Rents YoY
- 0.7%
- Active inventory
- 104
- Price-to-rent
- 7.4×
Monthly cashflow live
- Estimated rent
- $2,720 high interval (Pro) →
- Mortgage (P&I)
- −$1,258
- Tax from tax record
- −$716 /mo · $8,595/yr
- Insurance
- −$100
- HOA
- −$0
- Vacancy / Maint / Mgmt
- −$571
- Net cashflow
- $74
Break-even live
Sensitivity live
| Price | -10% $210 | -5% $142 | +0% $74 | +5% $6 | +10% $-62 |
|---|---|---|---|---|---|
| Rent | -10% $-141 | -5% $-33 | +0% $74 | +5% $182 | +10% $289 |
| Rate | -1.0pp $195 | -0.5pp $135 | base $74 | +0.5pp $12 | +1.0pp $-51 |
UW: 25.0% down · 7.5% · 30yr · 1.5% tax · 5.0% vac · 8.0% maint · 8.0% mgmt
Financing live
Cash to close
- Down payment
- $59,975
- Closing costs
- $7,197
- Reserves months
- —
- Total cash needed
- —
Loan-product check · same deal, 3 products live
Conventional
25% down · 7.5% · 30yr
- Down + closing
- —
- Monthly P&I
- —
- Monthly cashflow
- —
- DSCR
- —
- Eligible?
- —
Personal DTI + credit; lowest rate.
DSCR
20% down · 8.5% · 30yr
- Down + closing
- —
- Monthly P&I
- —
- Monthly cashflow
- —
- DSCR
- —
- Eligible?
- —
No personal income docs; deal must DSCR.
Hard money
10% down · 12.0% · 12mo
- Down + closing
- —
- Monthly P&I
- —
- Monthly cashflow
- —
- DSCR
- —
- Eligible?
- —
Short-term bridge; refi at stabilization.
Rent comps 20 comps
| Address | Beds | Baths | Sqft | Rent | $/sqft | DOM | Units | Dist |
|---|---|---|---|---|---|---|---|---|
| 1800 Navajo Pl Irving, TX | 3.0 | 2.5 | 1557 | $2,300 | $1.48 | 9d | 1 | 0.33mi |
| 2003 N O Connor Rd Irving, TX | 3.0 | 2.0 | 1682 | $8,850 | $5.26 | 45d | 1 | 0.39mi |
| 2346 N MacArthur Blvd Irving, TX | 1.0–3.0 | 1.0–2.0 | 1031 | $1,616 | $1.57 | 1d | 27 | 0.62mi |
| 1431 Pearson St Irving, TX | 3.0 | 3.0 | 2433 | $2,450 | $1.01 | 26d | 1 | 0.62mi |
| 232 Seva Ct Irving, TX | 3.0 | 2.5 | 1812 | $2,250 | $1.24 | 45d | 1 | 0.80mi |
| 514 Lynn Dr E Irving, TX | 3.0 | 2.0 | 1704 | $2,350 | $1.38 | 1d | 1 | 0.83mi |
| 2613 Fairbrook St Irving, TX | 4.0 | 3.5 | 1876 | $2,699 | $1.44 | 9d | 1 | 0.88mi |
| 508 N O'Connor Rd Irving, TX | 3.0 | 3.0 | 2244 | $3,450 | $1.54 | 26d | 1 | 0.88mi |
| 510 N O'Connor Rd Irving, TX | 3.0 | 3.0 | 2244 | $3,400 | $1.52 | 6d | 1 | 0.88mi |
| 2404 Crestview Cir Irving, TX | 5.0 | 2.5 | 2497 | $5,000 | $2.00 | 4d | 1 | 0.91mi |
| 919 W Rochelle Rd Unit 921 Irving, TX | 3.0 | 2.5 | 1495 | $1,895 | $1.27 | 45d | 1 | 0.93mi |
| 1919 Puritan Dr Unit 1019566P Irving, TX | 5.0 | 2.0 | 1937 | $13,405 | $6.92 | 24d | 1 | 0.96mi |
| 1919 Puritan Dr Irving, TX | 5.0 | 2.0 | 1947 | $8,250 | $4.24 | 26d | 1 | 0.96mi |
| 504 N O'Connor Rd Irving, TX | 4.0 | 4.0 | 2244 | $3,900 | $1.74 | 45d | 1 | 0.96mi |
| 504 N O'Connor Rd Irving, TX | 4.0 | 4.0 | 2244 | $3,600 | $1.60 | 6d | 1 | 0.96mi |
| 2801 Clearbrook Dr Irving, TX | 3.0 | 2.0 | 2259 | $3,500 | $1.55 | 45d | 1 | 1.00mi |
| 516 S O Connor Rd Irving, TX | 4.0 | 4.0 | 2244 | $3,500 | $1.56 | 6d | 1 | 1.03mi |
| 502 Forest Cir Irving, TX | 4.0 | 2.0 | 1576 | $2,395 | $1.52 | 1d | 1 | 1.22mi |
| 2138 Onetta Dr Irving, TX | 3.0 | 2.0 | 1467 | $2,085 | $1.42 | 26d | 1 | 1.28mi |
| 1009 McCoy Dr Irving, TX | 4.0 | 3.0 | 2285 | $3,000 | $1.31 | 26d | 1 | 1.32mi |
Listing history 8 events
-
2026-06-15status $239,900 Pending 11 DOM
-
2026-06-15days on market $239,900 Active Option Contract 11 DOM
-
2026-06-13days on market $239,900 Active Option Contract 9 DOM
-
2026-06-13days on market $239,900 Active Option Contract 8 DOM
-
2026-06-09days on market $239,900 Active Option Contract 5 DOM
-
2026-06-08statusdays on market $239,900 Active Option Contract 4 DOM
-
2026-06-07remarks 699-char remark
-
2026-06-07$239,900 Active 3 DOM
ⓘ Source: listings_history table (triggers on properties + properties_extension) + one-shot
backfill from property_details.listing_events for pre-trigger history.
Tax reassessment forecast TX · Resets to sale price
- Current annual tax
- $8,595 · $716/mo
- Projected year-2 tax
- $8,595 · $716/mo
- Expected delta
- $0/yr ($0/mo · 0.0%)
ⓘ Screening estimate from a state-policy table — verify with the county assessor before closing.
Climate risk First Street
- Flood 1/10 Low FEMA zone X (unshaded) · 0% chance over 30 yrs
- Wildfire 1/10 Low
- Heat 7/10 Severe 7 d/yr ≥109°F today · 22 d/yr by 30 yrs out
- Wind 6/10 Major 27% chance of damaging wind over 30 yrs
- Air quality 3/10 Moderate 2 unhealthy d/yr today · 3 by 30 yrs out
Nearby sold comps map
Loading sold comps map…
Walkable amenities ~0.75 mi
Loading nearby amenities…
Taxation est. · year 1
- Rental income
- $32,637
- − Mortgage interest
- −$13,438
- − Property taxes
- −$8,595
- − Insurance
- −$1,200
- − Repairs & maintenance
- −$2,611
- − Management
- −$2,611
- − Depreciation
- −$6,979
- Taxable loss
- −$2,797
- Est. tax savings @ 24.0%
- +$671
- After-tax cash flow
- $1,563/yr
For passive investors: Depreciation is non-cash, so a rental often shows a tax loss while cash-flowing — sheltering income. Rental losses are passive: they offset passive income freely, and up to $25,000/yr can offset ordinary (W-2) income if you actively participate and your MAGI is under $100k (phasing out to $0 by $150k); unused losses carry forward. On sale, claimed depreciation is recaptured at up to 25%, and gains may owe capital-gains tax (a 1031 exchange can defer both). Figures are a year-1 estimate at your 24.0% rate — not tax advice; consult a CPA.
Schools (NCES district)
- District
- Irving ISD
- NCES district ID
- 4824420
- Math proficiency
- 19% ▼ -28.00%
- Reading proficiency
- 25% ▼ -11.00%
- Median HH income
- $44,870
- Composite
- 19.06/100
- National rank
- #8840
- State rank
- #751 of 826 in TX
Livability — Irving
- Score
- 80/100
- State rank
- #45
- US rank
- #1913
Category grades
Schools grade is shown separately in the Schools card above.
Census & demographics
- Census place
- Irving, TX
- County
- Dallas County · 2,612,404 people
- City population
- 258,488
- Metro
- Dallas-Fort Worth-Arlington, TX
- Population (ZIP)
- 56,013
- Household income
- $63,798
- Rent vs Own
- Severe rent burden
- 2930.0
Population outlook (Dallas County) Hauer SSP2
- Today (2025)
- 2,979,839 people
- By 2030
- 3,191,823 · +7.1%
- By 2040
- 3,619,611 · +21.5%
- By 2050
- 4,026,915 · +35.1%
- By 2075
- 4,957,073 · +66.4%
- By 2100
- 5,508,725 · +84.9%
Race, ethnicity, and origin ACS 2023
- Neighborhood character
- Predominantly Hispanic (71%)
- Race & ethnicity
- Hispanic / Latino 71% Two or more races 17% White 14% Black 8% Asian 5%
- Hispanic origin (detail)
- Mexican 41%
- Common ancestry
- Serbian 1% Italian 1% Slovak 1%
- Foreign-born
- 41% · Canada, Vietnam, China
- Languages at home
- 30% English-only · Spanish 64% Other Indo-European 3% Vietnamese 1%
Political lean MEDSL · Dallas
- 2024 margin
- Strong D (+22.2) · D 60.2% · R 38.0% · Other 1.8%
- 2008→2024 swing
- +6.9pp toward D · 2008: 15.3pp · 2024: 22.2pp
- All cycles
- 2024: D+22.2 2020: D+31.6 2016: D+26.2 2012: D+15.4 2008: D+15.3
Not yet ingested
- Civics
- —
Market trends
- HPI YoY
- ▼ -213.97%
- Current HPI
- 333.2765
- Rent YoY
- ▲ 0.72%
- Metro
- Dallas-Fort Worth-Arlington, TX
- State GDP YoY
- ▲ 3.95%
- F500 in state
- 110
Industry mix (Fortune 500 HQ in TX)
| Industry | F500 HQs | Revenue |
|---|---|---|
| Energy | 16 | $1,198B |
|
||
| Technology | 5 | $198B |
|
||
| Engineering / Construction | 4 | $72B |
|
||
| Energy Services | 3 | $60B |
|
||
| Utilities | 3 | $41B |
|
||
| Healthcare | 2 | $330B |
|
||
Price history
9 events — show timeline
- 2026-06-04 Listed $239,900 NTREIS
- 2026-01-05 Sold (Public Records) — Public Records
- 2026-01-05 Sold (Public Records) — Public Records
- 2026-01-05 Sold (Public Records) — Public Records
- 2026-01-05 Sold (Public Records) — Public Records
- 2026-01-05 Sold (Public Records) — Public Records
- 2026-01-05 Sold (Public Records) — Public Records
- 2025-06-05 Sold (Public Records) — Public Records
- 2025-06-05 Sold (Public Records) — Public Records
Property tax history
+4.7%/yrLatest (2025): $8,595 · +0.0% YoY. Source: county tax records.
Cash-flow waterfall
monthlySold comps — $/sqft
last 12 mo · ≤1 miLoading sold comps…