 Triplex
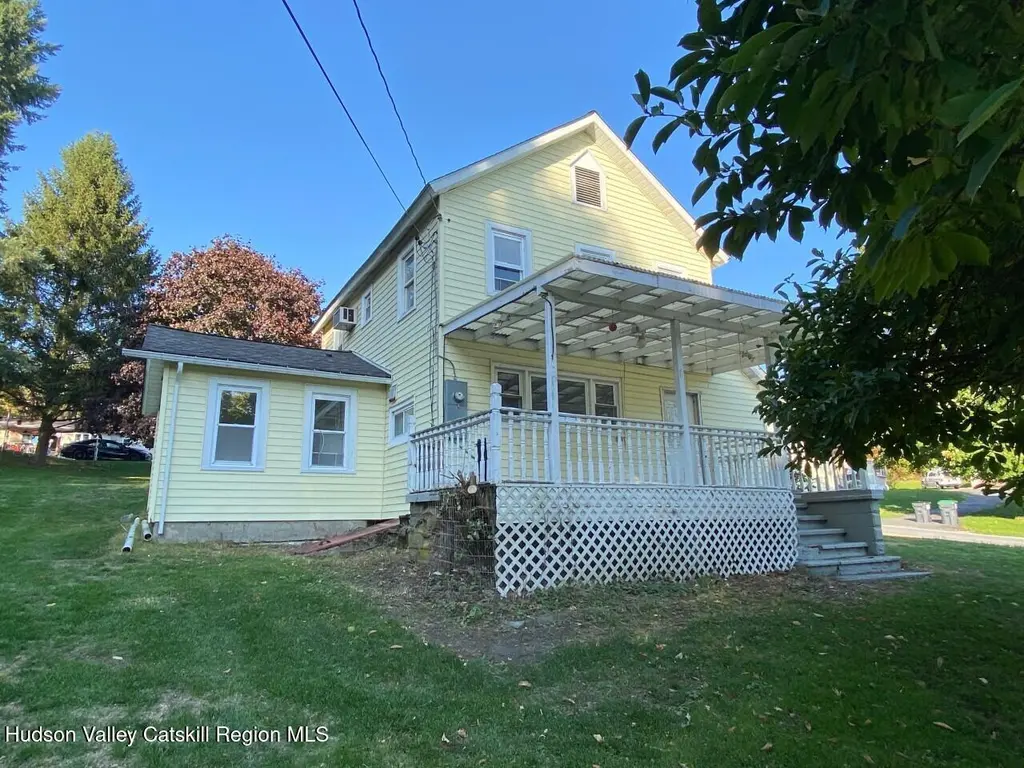
245-249 Lattintown Rd #0 · Marlboro, NY
Flood risk 1/10 · Minimal
- FEMA flood zone
- X (unshaded)
- Chance of flooding over 30 yrs
- 0.0%
- Est. flood insurance / yr
- $473 – $860
Fire risk 2/10 · Minimal
- Est. fire insurance / yr
- $691 – $1,283
Heat risk 4/10 · Minor
- Hot days now (above 100°F)
- 7 days/yr
- Hot days in 30 yrs
- 15 days/yr
Wind risk 4/10 · Minor
- Chance of severe wind over 30 yrs
- 13.0%
Air-quality risk 2/10 · Minimal
- Unhealthy air days now
- 1 days/yr
- Unhealthy air days in 30 yrs
- 2 days/yr
Risk factors via First Street. Map © Google.
Why this score? — see what drove the C grade
The composite is a weighted blend of 9 inputs, each scored 0–100. Each bar is that input's sub-score; the figure is the points it added to the 100-point composite (weight × sub-score).
- ARV discount +14.0/15.0
- Cash flow +12.5/30.0
- Appreciation +9.5/10.0
- Schools +4.4/10.0
- DSCR +3.7/10.0
- 1% rule +3.6/10.0
- Livability +3.6/5.0
- Condition / age +2.8/5.0
- Rent growth +2.5/5.0
$689,900
🖨 Deal sheet 📄 Offer letter ✓ Due diligence
Multi-family units
County records classify this as Multi-Family (2-4 Unit). Listing-text estimate: 3 units. confirmed
Listing remarks MLS
Great investment opportunity! Two Story house plus 2 mobile homes with two bedrooms and one bath each. All three units are rented out. There is also a three bay garage. Property is close to Route 84, thruway, metro North etc.
Key facts
- 1.2 acre lot
- 3 garage spots
- Built 1879
Neighborhood map
What this means for you Summary
Snapshot
- This is a 3 × 2-bed/1.3-bath units multifamily listed at $690k. Condition is rated average.
Deal economics
- At list price, monthly cash flow is $-96 ($-1k/yr) — negative. Per door: $-32/mo.
- To cash-flow at today's rent, offer at most $676k (2.0% below list).
- To meet the 1% rule (rent ≥ 1% of price), the offer needs to be $591k (14.3% below list).
- Recommended offer: $591k (14.3% below list) — sets the bar for 1% rule.
- Cap rate 6.1% vs local median 3.0% in Marlboro — top-decile yield for the area; either an underpriced asset or a hidden risk that comps aren't pricing in. Stress-test before assuming the spread holds.
Location & tenants
- Location reads 72/100 on livability (#347 in NY) — a middle-class / working-renter tenant base. Strengths: employment A+, housing A+, crime A; Watch: cost of living D+, amenities F, commute D-.
- Marlboro Central School District (suburban): math 43% / reading 55% proficiency, ranked #366 of 590 in NY (top 62%) — families likely to look elsewhere, expect single-tenant / working-renter base with shorter leases.
- Market conditions: 56 active listings in the ZIP; 464 units permitted in Ulster County in 2024 (170 in 5+ unit buildings).
Forward outlook
- In year one you build about $67k of equity ($5k loan paydown + $62k appreciation (9.0% local appreciation)).
- Ulster County population projected at -14% by 2050 — secular population decline; favor cash flow + early exit over multi-decade hold.
- By year 2, paydown + projected appreciation supports a ~$107k cash-out refi (75% LTV) — recoverable capital for the next deal without selling this one.
Negotiation context
- It's been on market 108 days — a 9% lower offer ($628k) is reasonable based on typical stale-listing flexibility.
- 7 sale attempts since 6y ago with the ask held roughly flat each time — persistent listings suggest the price (not the market) is what's stuck; bring a comps-based counter.
Risks & watch-outs
- Watch-outs: built in 1879 — expect roof / HVAC / electrical / plumbing capex.
Questions for the listing agent
- What do current leases actually rent for vs. the listed asking? Can we see a recent rent roll and the last 12 months of T-12 income?
- It's been on market 108 days. Have you received any prior offers? Is the seller open to a 14% concession, seller financing, or rate buy-down credit?
- Can we see the unit-by-unit rent roll, current vacancy, and any below-market leases? What's the average tenancy length?
- What capital expenditures (roof, boiler, parking lot, exteriors) have been made in the last 5 years, and what's planned in the next 2?
- Built in 1879 — when were the roof, HVAC, electrical panel, plumbing, and water heater last replaced?
- Why hasn't it sold? Are there any deal-killer items the seller is aware of (foundation, flood, title, zoning, code violations)?
- Is there a deadline driving the sale (1031 exchange, divorce, estate, relocation)? That informs how much negotiation room exists.
- Schools are B-rated — typically a magnet for longer-tenancy family renters. What's the average tenant stay here, and is there a school-zone premium baked into asking?
- What's the average days-on-market for RENTAL listings here right now (not sales)? A rising rental-DOM trend means longer vacancies and softer asking-rent achievability than the comps imply.
- What's the recent tenant-quality profile in this submarket — average credit score on applications, eviction rate, late-payment / NSF rate, and stable-employment percentage? A property-management company in the area should have these aggregated.
- How much new apartment / multifamily construction is in the pipeline within 1–3 miles? Heavy new supply (>2% of stock underway) typically softens rents 12–24 months out; light construction supports rent growth.
Investment metrics
- 1% rule
- 0.86% ✗
- Cap rate
- 6.13%
- Cash-on-cash
- -0.59%
- DSCR
- 0.97
- GRM
- 9.7
CMA / ARV
- ARV (median comp)
- $807,212
- List price
- $689,900
- Delta
- -14.53%
- Verdict
- UNDERPRICED
- Comps
- 2 within 1.0 mi
Projected returns pro-forma
8.97% appreciation · 3.0% rent growth · sell at horizon
- IRR
- 21.7%
- Equity multiple
- 2.66×
- Total profit
- $321,541
- Equity at exit
- $570,248
- IRR
- 19.7%
- Equity multiple
- 5.88×
- Total profit
- $942,126
- Equity at exit
- $1,178,998
Cash invested: $193,172 (down + closing). Projections, not guarantees.
Landlord ↔ Tenant lean methodology
- Overall (STATE)
- 15 Strongly Tenant-Friendly
- State New York
- 15 Strongly Tenant-Friendly · D+10
- County
- — inherits STATE
- City
- — inherits STATE
ZIP-level market 12542
- Home prices YoY
- 2.8%
- Active inventory
- 56
- Price-to-rent
- 29.2×
Monthly cashflow live
- Estimated rent
- $5,914 medium interval (Pro) →
- Mortgage (P&I)
- −$3,618
- Tax est. 1.5%
- −$862 /mo · $10,348/yr
- Insurance
- −$287
- HOA
- −$0
- Vacancy / Maint / Mgmt
- −$1,242
- Net cashflow
- $-96
Break-even live
3-unit breakdown (identical units grouped — click to expand)
| Units | Beds | Baths | Est. rent |
|---|---|---|---|
| 3× units | 2 | 1.3 | $5,913 |
| #1 | 2 | 1.3 | $1,971 |
| #2 | 2 | 1.3 | $1,971 |
| #3 | 2 | 1.3 | $1,971 |
| Total (3 units) | $5,914 | ||
UW: 25.0% down · 7.5% · 30yr · 1.5% tax · 5.0% vac · 8.0% maint · 8.0% mgmt
Financing live
Cash to close
- Down payment
- $172,475
- Closing costs
- $20,697
- Reserves months
- —
- Total cash needed
- —
Loan-product check · same deal, 3 products live
Conventional
25% down · 7.5% · 30yr
- Down + closing
- —
- Monthly P&I
- —
- Monthly cashflow
- —
- DSCR
- —
- Eligible?
- —
Personal DTI + credit; lowest rate.
DSCR
20% down · 8.5% · 30yr
- Down + closing
- —
- Monthly P&I
- —
- Monthly cashflow
- —
- DSCR
- —
- Eligible?
- —
No personal income docs; deal must DSCR.
Hard money
10% down · 12.0% · 12mo
- Down + closing
- —
- Monthly P&I
- —
- Monthly cashflow
- —
- DSCR
- —
- Eligible?
- —
Short-term bridge; refi at stabilization.
Listing history 25 events
-
2026-06-18days on market $689,900 Active 108 DOM
-
2026-06-17days on market $689,900 Active 107 DOM
-
2026-06-16days on market $689,900 Active 106 DOM
-
2026-06-15days on market $689,900 Active 105 DOM
-
2026-06-14days on market $689,900 Active 103 DOM
-
2026-06-13days on market $689,900 Active 102 DOM
-
2026-06-10days on market $689,900 Active 100 DOM
-
2026-06-09days on market $689,900 Active 99 DOM
-
2026-06-08days on market $689,900 Active 98 DOM
-
2026-06-07days on market $689,900 Active 97 DOM
-
2026-06-03days on market $689,900 Active 93 DOM
-
2026-06-02days on market $689,900 Active 92 DOM
-
2026-06-01days on market $689,900 Active 91 DOM
-
2026-05-31days on market $689,900 Active 90 DOM
-
2026-05-30days on market $689,900 Active 89 DOM
-
2026-03-02$689,900 Active 225-char remark
Show marketing remark (225 chars)
Great investment opportunity! Two Story house plus 2 mobile homes with two bedrooms and one bath each. All three units are rented out. There is also a three bay garage. Property is close to Route 84, thruway, metro North etc.
-
2025-03-05$689,000 Active
-
2025-03-01historical
-
2024-08-26$689,000 Active
-
2024-08-22$689,000 Active
-
2020-12-31historical
-
2020-12-31historical
-
2020-06-26$399,000
-
2020-06-14$399,000
-
2020-06-13$399,000
ⓘ Source: listings_history table (triggers on properties + properties_extension) + one-shot
backfill from property_details.listing_events for pre-trigger history.
Climate risk First Street
- Flood 1/10 Low FEMA zone X (unshaded) · 0% chance over 30 yrs
- Wildfire 2/10 Low
- Heat 4/10 Moderate 7 d/yr ≥100°F today · 15 d/yr by 30 yrs out
- Wind 4/10 Moderate 13% chance of damaging wind over 30 yrs
- Air quality 2/10 Low 1 unhealthy d/yr today · 2 by 30 yrs out
Nearby sold comps map
Loading sold comps map…
Walkable amenities ~0.75 mi
Loading nearby amenities…
Taxation est. · year 1
- Rental income
- $70,968
- − Mortgage interest
- −$38,645
- − Property taxes
- −$10,348
- − Insurance
- −$3,450
- − Repairs & maintenance
- −$5,677
- − Management
- −$5,677
- − Depreciation
- −$20,070
- Taxable loss
- −$12,900
- Est. tax savings @ 24.0%
- +$3,096
- After-tax cash flow
- $1,948/yr
For passive investors: Depreciation is non-cash, so a rental often shows a tax loss while cash-flowing — sheltering income. Rental losses are passive: they offset passive income freely, and up to $25,000/yr can offset ordinary (W-2) income if you actively participate and your MAGI is under $100k (phasing out to $0 by $150k); unused losses carry forward. On sale, claimed depreciation is recaptured at up to 25%, and gains may owe capital-gains tax (a 1031 exchange can defer both). Figures are a year-1 estimate at your 24.0% rate — not tax advice; consult a CPA.
Condition & rehab AI · 12 photos
This two-story multi-family home presents an average condition with moderate rehabilitation needs. Upgrading the kitchen and bathrooms, along with replacing the HVAC units, can significantly increase its value for both resale and rental purposes.
Repairs flagged
- Moderate kitchen cabinets — outdated and in need of replacement
- Moderate bathroom fixtures — dated and in need of replacement
- Moderate HVAC units — existing units show signs of wear
Value-add opportunities
- Both kitchen renovation — modernizing the kitchen can increase both resale and rental value
- Both bathroom renovation — updating bathrooms can significantly boost both resale and rental value
- Both HVAC replacement — replacing old HVAC units with energy-efficient models can improve comfort and reduce utility costs, thus increasing both resale and rental value
Renovation cost estimate screening
| Repair item | Severity | Est. cost |
|---|---|---|
| kitchen cabinets · outdated and in need of replacement | Moderate | $3,000–15,000 |
| bathroom fixtures · dated and in need of replacement | Moderate | $3,000–15,000 |
| HVAC units · existing units show signs of wear | Moderate | $3,000–15,000 |
| Total estimated repair cost · 3 items | $9,000–45,000 |
Value-add ROI direction
- Both kitchen renovation — modernizing the kitchen can increase both resale and rental value ↑
- Both bathroom renovation — updating bathrooms can significantly boost both resale and rental value ↑
- Both HVAC replacement — replacing old HVAC units with energy-efficient models can improve comfort and reduce utility costs, thus increasing both resale and rental value ↑
ⓘ Cost ranges are severity-bucket heuristics (US national rule-of-thumb). Get contractor quotes + a written scope before underwriting a rehab budget.
Schools (NCES district)
- District
- Marlboro Central School District
- NCES district ID
- 3618570
- Math proficiency
- 43% ▼ -10.00%
- Reading proficiency
- 55% ▲ 8.00%
- Median HH income
- $68,737
- Composite
- 43.7/100
- National rank
- #2953
- State rank
- #366 of 590 in NY
Livability — Marlboro
- Score
- 72/100
- State rank
- #347
- US rank
- #5847
Category grades
Schools grade is shown separately in the Schools card above.
Census & demographics
- Population (ZIP)
- 5,859
Population outlook (Ulster County) Hauer SSP2
- Today (2025)
- 175,887 people
- By 2030
- 171,876 · -2.3%
- By 2040
- 161,771 · -8.0%
- By 2050
- 151,470 · -13.9%
- By 2075
- 133,023 · -24.4%
- By 2100
- 113,504 · -35.5%
Race, ethnicity, and origin ACS 2023
- Neighborhood character
- Predominantly White (74%)
- Race & ethnicity
- White 74% Hispanic / Latino 14% Two or more races 11% Black 5%
- Hispanic origin (detail)
- Mexican 4% Puerto Rican 3% Dominican 2%
- Common ancestry
- Lithuanian 3% Romanian 3% Slovak 2%
- Foreign-born
- 7% · Canada, Jamaica
- Languages at home
- 88% English-only · Spanish 8% Other Indo-European 2% Arabic 1%
Political lean MEDSL · Ulster
- 2024 margin
- D (+18.7) · D 59.3% · R 40.7%
- 2008→2024 swing
- -4.9pp toward R · 2008: 23.6pp · 2024: 18.7pp
- All cycles
- 2024: D+18.7 2020: D+20.9 2016: D+9.1 2012: D+21.9 2008: D+23.6
Not yet ingested
- Civics
- —
Market trends
- HPI YoY
- ▲ 8.97%
- Current HPI
- 325.4749
- Rent YoY
- —
- Metro
- —
- State GDP YoY
- ▲ 2.60%
- F500 in state
- 92
Industry mix (Fortune 500 HQ in NY)
| Industry | F500 HQs | Revenue |
|---|---|---|
| Financial Services | 10 | $950B |
|
||
| Consumer Goods | 9 | $162B |
|
||
| Insurance | 4 | $225B |
|
||
| Telecommunications | 2 | $144B |
|
||
| Pharmaceuticals | 2 | $112B |
|
||
| Media / Entertainment | 2 | $69B |
|
||
Price history
+72.9% since first listed10 events — show timeline
- 2026-03-02 Listed $689,900 HVCRMLS
- 2025-03-05 Listed $689,000 HVCRMLS
- 2025-03-01 Listing Removed — OneKey® MLS as Distributed by MLS Grid
- 2024-08-26 Listed $689,000 HVCRMLS
- 2024-08-22 Listed $689,000 OneKey® MLS as Distributed by MLS Grid
- 2020-12-31 Listing Removed — OneKey® MLS as Distributed by MLS Grid
- 2020-12-31 Listing Removed — OneKey® MLS as Distributed by MLS Grid
- 2020-06-26 Listed $399,000 OneKey® MLS as Distributed by MLS Grid
- 2020-06-14 Listed $399,000 OneKey® MLS as Distributed by MLS Grid
- 2020-06-13 Listed $399,000 HVCRMLS
Cash-flow waterfall
monthlySold comps — $/sqft
last 12 mo · ≤1 miLoading sold comps…