7431 County Road 964 · Wylie, TX
Flood risk 1/10 · Minimal
- FEMA flood zone
- X (unshaded)
- Chance of flooding over 30 yrs
- 0.0%
- Est. flood insurance / yr
- $507 – $1,088
Fire risk 3/10 · Minor
- Est. fire insurance / yr
- $1,222 – $2,270
Heat risk 7/10 · Major
- Hot days now (above 109°F)
- 7 days/yr
- Hot days in 30 yrs
- 22 days/yr
Wind risk 6/10 · Moderate
- Chance of severe wind over 30 yrs
- 27.0%
Air-quality risk 3/10 · Minor
- Unhealthy air days now
- 3 days/yr
- Unhealthy air days in 30 yrs
- 3 days/yr
Risk factors via First Street. Map © Google.
Why this score? — see what drove the D grade
The composite is a weighted blend of 9 inputs, each scored 0–100. Each bar is that input's sub-score; the figure is the points it added to the 100-point composite (weight × sub-score).
- Cash flow +12.2/30.0
- Appreciation +10.0/10.0
- DSCR +3.6/10.0
- 1% rule +3.5/10.0
- Livability +3.5/5.0
- Schools +3.2/10.0
- Rent growth +2.5/5.0
- Condition / age +2.5/5.0
- ARV discount +0.0/15.0
$369,000
🖨 Deal sheet (PDF) 📄 Offer letter ✓ Due diligence
Listing remarks MLS
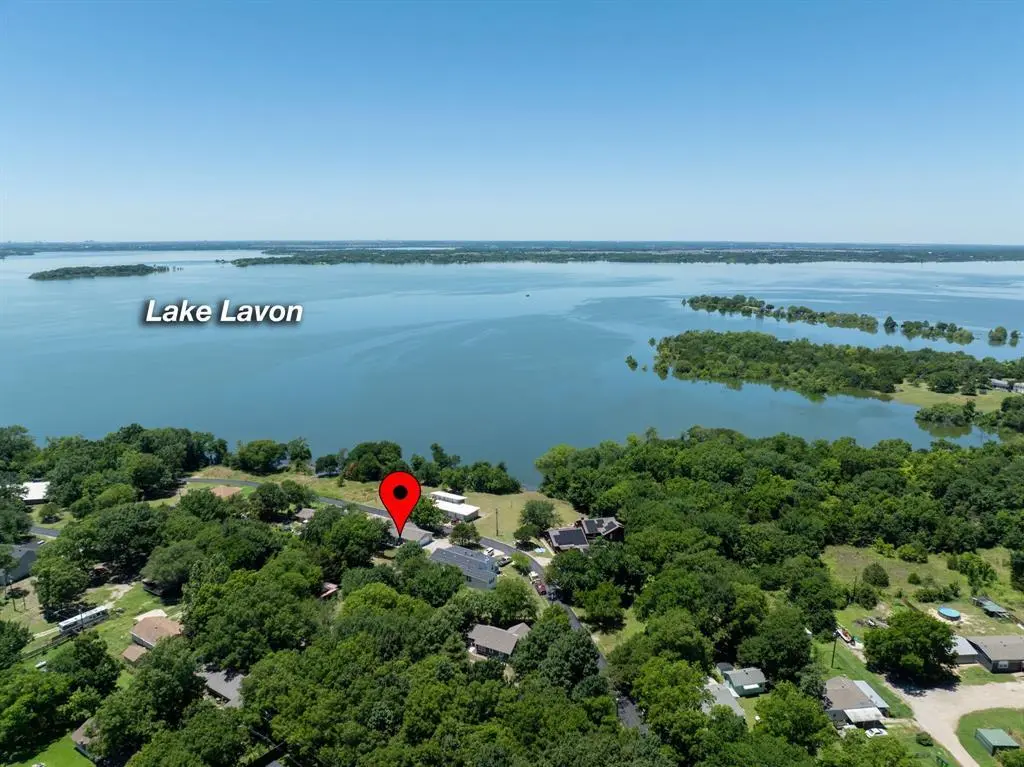
Just yards from the shoreline on the Deep Water Point peninsula of Lake Lavon, this updated 1.5-story ranch offers a rare combination of lifestyle, flexibility, and accessibility—including a potential 0% down USDA financing opportunity for qualified buyers (subject to lender approval). With water views from sunrise to sunset and close proximity to Little Ridge Park, this home brings the feel of lake living within reach—without the premium price point typically associated with waterfront properties. Inside, the home features 3 bedrooms, each with its own private ensuite bath—a layout that’s increasingly hard to find and ideal for everyday living, hosting guests, or creating separation of space when needed. The open-concept design connects the living, dining, and kitchen areas, filled with natural light and finished in a clean, modern coastal style. The kitchen serves as the centerpiece, complete with stainless steel appliances, stone countertops, farmhouse sink, herringbone backsplash, and a large center island with built-in seating—designed for both daily use and gathering. The primary suite on the first floor offers a spa-like retreat with a modern vanity, stone countertops, and a glass-enclosed shower with marble-style finishes. Upstairs, a private suite with its own exterior entrance and balcony adds another layer of versatility—whether for guests, workspace, or additional living flexibility. Outdoor spaces extend the experience with covered porches, a spacious backyard, hot tub, grill dock, and perimeter privacy fence—providing multiple areas to relax or entertain. Located outside city limits with no HOA, the property offers additional flexibility for full-time living, weekend use, or long-term investment potential.
Key facts
- Farm sink
- Open-concept living
- Granite counters
Tags
Neighborhood map
What this means for you Summary
Snapshot
- This is a 3-bed/3.0-bath single-family listed at $369k.
Deal economics
- At list price, monthly cash flow is $-71 ($-855/yr) — negative.
- To cash-flow at today's rent, offer at most $356k (3.4% below list).
- To meet the 1% rule (rent ≥ 1% of price), the offer needs to be $315k (14.6% below list).
- Recommended offer: $315k (14.6% below list) — sets the bar for 1% rule.
- Cap rate 6.1% vs local median 4.0% in Wylie — top-decile yield for the area; either an underpriced asset or a hidden risk that comps aren't pricing in. Stress-test before assuming the spread holds.
Location & tenants
- Location reads 69/100 on livability (#419 in TX) — a middle-class / working-renter tenant base. Strengths: crime A+, employment A+, housing A+; Watch: amenities F, commute F, health & safety F.
- Community ISD (rural): math 30% / reading 38% proficiency, ranked #479 of 826 in TX (top 58%) — families likely to look elsewhere, expect single-tenant / working-renter base with shorter leases.
- Zoned schools: Leland E Edge Middle (math 25% / reading 35%, grade F, #1,056 of 1,662 statewide, top 65%, 931 students, 53% FRL) — zoned schools average 53% FRL vs 36% district-wide (18 pts higher); higher-poverty schools than district average — tighter screening recommended.
- Market conditions: 421 active listings in the ZIP; 1 comparable units currently listed for rent nearby; 19,194 units permitted in Collin County in 2024 (3,988 in 5+ unit buildings).
Forward outlook
- In year one you build about $39k of equity ($3k loan paydown + $37k appreciation (10.0% local appreciation)).
- Collin County population projected at +60% by 2050 — long-run rental-demand tailwind backs the buy-and-hold thesis.
- At projected returns (10.0% appreciation + 3.0% rent growth), your $103k cash investment doubles in ~3 years — after that, you're playing with house money.
- By year 2, paydown + projected appreciation supports a ~$63k cash-out refi (75% LTV) — recoverable capital for the next deal without selling this one.
Negotiation context
- It's been on market 80 days — a 6% lower offer ($347k) is reasonable based on typical stale-listing flexibility.
- 7 sale attempts since 2y ago with the ask held roughly flat each time — persistent listings suggest the price (not the market) is what's stuck; bring a comps-based counter.
Risks & watch-outs
- Climate carrying-cost: major wind risk, 27% chance of damaging wind over 30y; extreme-heat days projected 7→22/yr by 2055 (HVAC capex compounding) — expect insurance premiums to compound above CPI over the hold.
Questions for the listing agent
- What do current leases actually rent for vs. the listed asking? Can we see a recent rent roll and the last 12 months of T-12 income?
- It's been on market 80 days. Have you received any prior offers? Is the seller open to a 15% concession, seller financing, or rate buy-down credit?
- Why hasn't it sold? Are there any deal-killer items the seller is aware of (foundation, flood, title, zoning, code violations)?
- Is there a deadline driving the sale (1031 exchange, divorce, estate, relocation)? That informs how much negotiation room exists.
- Schools are B-rated — typically a magnet for longer-tenancy family renters. What's the average tenant stay here, and is there a school-zone premium baked into asking?
- The area grade is low — what's the realistic commute time and amenity access for the typical tenant pool here? Any planned neighborhood developments (good or bad) we should know about?
- What's the average days-on-market for RENTAL listings here right now (not sales)? A rising rental-DOM trend means longer vacancies and softer asking-rent achievability than the comps imply.
- What's the recent tenant-quality profile in this submarket — average credit score on applications, eviction rate, late-payment / NSF rate, and stable-employment percentage? A property-management company in the area should have these aggregated.
- How much new for-sale + rental construction is in the pipeline within 1–3 miles? Heavy new supply typically softens prices + rents 12–24 months out; constrained supply supports both.
Investment metrics
- 1% rule
- 0.85% ✗
- Cap rate
- 6.06%
- Cash-on-cash
- -0.83%
- DSCR
- 0.96
- GRM
- 9.8
CMA / ARV
- ARV (median comp)
- $315,432
- List price
- $369,000
- Delta
- 16.98%
- Verdict
- OVERPRICED
- Comps
- 8 within 1.0 mi
Projected returns pro-forma
10.0% appreciation · 3.0% rent growth · sell at horizon
- IRR
- 23.7%
- Equity multiple
- 2.90×
- Total profit
- $196,482
- Equity at exit
- $332,424
- IRR
- 21.1%
- Equity multiple
- 6.64×
- Total profit
- $582,282
- Equity at exit
- $716,886
Cash invested: $103,320 (down + closing). Projections, not guarantees.
Landlord ↔ Tenant lean methodology
- Overall (STATE)
- 87 Strongly Landlord-Friendly
- State Texas
- 87 Strongly Landlord-Friendly · R+5
- County
- — inherits STATE
- City
- — inherits STATE
ZIP-level market 75173
- Home prices YoY
- 3.1%
- Active inventory
- 421
- Price-to-rent
- 9.8×
Monthly cashflow live
- Estimated rent
- $3,150 medium interval (Pro) →
- Mortgage (P&I)
- −$1,935
- Tax from tax record
- −$471 /mo · $5,651/yr
- Insurance
- −$154
- HOA
- −$0
- Vacancy / Maint / Mgmt
- −$662
- Net cashflow
- $-71
Break-even live
Sensitivity live
| Price | -10% $138 | -5% $33 | +0% $-71 | +5% $-176 | +10% $-280 |
|---|---|---|---|---|---|
| Rent | -10% $-320 | -5% $-196 | +0% $-71 | +5% $53 | +10% $178 |
| Rate | -1.0pp $115 | -0.5pp $23 | base $-71 | +0.5pp $-167 | +1.0pp $-264 |
UW: 25.0% down · 7.5% · 30yr · 1.5% tax · 5.0% vac · 8.0% maint · 8.0% mgmt
Financing live
Cash to close
- Down payment
- $92,250
- Closing costs
- $11,070
- Reserves months
- —
- Total cash needed
- —
Loan-product check · same deal, 3 products live
Conventional
25% down · 7.5% · 30yr
- Down + closing
- —
- Monthly P&I
- —
- Monthly cashflow
- —
- DSCR
- —
- Eligible?
- —
Personal DTI + credit; lowest rate.
DSCR
20% down · 8.5% · 30yr
- Down + closing
- —
- Monthly P&I
- —
- Monthly cashflow
- —
- DSCR
- —
- Eligible?
- —
No personal income docs; deal must DSCR.
Hard money
10% down · 12.0% · 12mo
- Down + closing
- —
- Monthly P&I
- —
- Monthly cashflow
- —
- DSCR
- —
- Eligible?
- —
Short-term bridge; refi at stabilization.
Rent comps 1 comps
| Address | Beds | Baths | Sqft | Rent | $/sqft | DOM | Units | Dist |
|---|---|---|---|---|---|---|---|---|
| 6430 Rock Ridge Dr Nevada, TX | 4.0 | 4.0 | 2500 | $3,150 | $1.26 | 0d | 1 | 1.43mi |
Listing history 43 events
-
2026-06-21days on market $369,000 Active 80 DOM
-
2026-06-18days on market $369,000 Active 77 DOM
-
2026-06-17days on market $369,000 Active 76 DOM
-
2026-06-16days on market $369,000 Active 75 DOM
-
2026-06-15days on market $369,000 Active 74 DOM
-
2026-06-13days on market $369,000 Active 72 DOM
-
2026-06-13days on market $369,000 Active 71 DOM
-
2026-06-09days on market $369,000 Active 68 DOM
-
2026-06-08days on market $369,000 Active 67 DOM
-
2026-06-07days on market $369,000 Active 66 DOM
-
2026-06-04days on market $369,000 Active 63 DOM
-
2026-06-03days on market $369,000 Active 62 DOM
-
2026-06-02days on market $369,000 Active 61 DOM
-
2026-06-01days on market $369,000 Active 60 DOM
-
2026-05-31days on market $369,000 Active 59 DOM
-
2026-04-02$369,000 Active 1798-char remark
Show marketing remark (1798 chars)
Just yards from the shoreline on the Deep Water Point peninsula of Lake Lavon, this updated 1.5-story ranch offers a rare combination of lifestyle, flexibility, and accessibility—including a potential 0% down USDA financing opportunity for qualified buyers (subject to lender approval). With water views from sunrise to sunset and close proximity to Little Ridge Park, this home brings the feel of lake living within reach—without the premium price point typically associated with waterfront properties. Inside, the home features 3 bedrooms, each with its own private ensuite bath—a layout that’s increasingly hard to find and ideal for everyday living, hosting guests, or creating separation of space when needed. The open-concept design connects the living, dining, and kitchen areas, filled with natural light and finished in a clean, modern coastal style. The kitchen serves as the centerpiece, complete with stainless steel appliances, stone countertops, farmhouse sink, herringbone backsplash, and a large center island with built-in seating—designed for both daily use and gathering. The primary suite on the first floor offers a spa-like retreat with a modern vanity, stone countertops, and a glass-enclosed shower with marble-style finishes. Upstairs, a private suite with its own exterior entrance and balcony adds another layer of versatility—whether for guests, workspace, or additional living flexibility. Outdoor spaces extend the experience with covered porches, a spacious backyard, hot tub, grill dock, and perimeter privacy fence—providing multiple areas to relax or entertain. Located outside city limits with no HOA, the property offers additional flexibility for full-time living, weekend use, or long-term investment potential.
-
2025-10-03price $369,000
-
2025-09-25price $370,000
-
2025-09-18price $371,000
-
2025-09-11price $372,000
-
2025-09-04price $373,000
-
2025-08-29price $374,000
-
2025-08-17status Active
-
2025-08-13historical Active Option Contract
-
2025-07-25price $375,000
-
2025-07-18price $385,000
-
2025-07-11price $395,000
-
2025-07-03price $405,000
-
2025-06-27price $415,000
-
2025-06-19price $425,000
-
2025-06-12price $435,000
-
2025-06-06$445,000 Active
-
2024-12-12historical
-
2024-11-08status Active
-
2024-11-07price $445,000
-
2024-09-07price $450,000
-
2024-08-17status Active
-
2024-06-13$460,000 Active
-
2024-04-17historical $3,399
-
2024-02-13$3,399
-
2021-12-30soldstatus
-
2010-08-20soldstatus
-
2000-08-23soldstatus
ⓘ Source: listings_history table (triggers on properties + properties_extension) + one-shot
backfill from property_details.listing_events for pre-trigger history.
Tax reassessment forecast TX · Resets to sale price
- Current annual tax
- $5,651 · $471/mo
- Projected year-2 tax
- $6,753 · $563/mo
- Expected delta
- +$1,101/yr (+$92/mo · 19.5%)
ⓘ Screening estimate from a state-policy table — verify with the county assessor before closing.
Climate risk First Street
- Flood 1/10 Low FEMA zone X (unshaded) · 0% chance over 30 yrs
- Wildfire 3/10 Moderate
- Heat 7/10 Severe 7 d/yr ≥109°F today · 22 d/yr by 30 yrs out
- Wind 6/10 Major 27% chance of damaging wind over 30 yrs
- Air quality 3/10 Moderate 3 unhealthy d/yr today · 3 by 30 yrs out
Nearby sold comps map
Loading sold comps map…
Walkable amenities ~0.75 mi
Loading nearby amenities…
Taxation est. · year 1
- Rental income
- $37,800
- − Mortgage interest
- −$20,670
- − Property taxes
- −$5,651
- − Insurance
- −$1,845
- − Repairs & maintenance
- −$3,024
- − Management
- −$3,024
- − Depreciation
- −$10,735
- Taxable loss
- −$7,149
- Est. tax savings @ 24.0%
- +$1,716
- After-tax cash flow
- $860/yr
For passive investors: Depreciation is non-cash, so a rental often shows a tax loss while cash-flowing — sheltering income. Rental losses are passive: they offset passive income freely, and up to $25,000/yr can offset ordinary (W-2) income if you actively participate and your MAGI is under $100k (phasing out to $0 by $150k); unused losses carry forward. On sale, claimed depreciation is recaptured at up to 25%, and gains may owe capital-gains tax (a 1031 exchange can defer both). Figures are a year-1 estimate at your 24.0% rate — not tax advice; consult a CPA.
Schools (NCES district)
- District
- Community ISD
- NCES district ID
- 4814850
- Math proficiency
- 30% ▼ -23.00%
- Reading proficiency
- 38% ▼ -11.00%
- Median HH income
- $71,841
- Composite
- 31.58/100
- National rank
- #5951
- State rank
- #479 of 826 in TX
Livability — Wylie
- Score
- 69/100
- State rank
- #419
- US rank
- #8623
Category grades
Schools grade is shown separately in the Schools card above.
Census & demographics
- City population
- 69,325
- Population (ZIP)
- 9,284
Population outlook (Collin County) Hauer SSP2
- Today (2025)
- 1,210,074 people
- By 2030
- 1,358,201 · +12.2%
- By 2040
- 1,654,061 · +36.7%
- By 2050
- 1,937,359 · +60.1%
- By 2075
- 2,567,039 · +112.1%
- By 2100
- 2,952,048 · +144.0%
Race, ethnicity, and origin ACS 2023
- Neighborhood character
- Majority White (65%)
- Race & ethnicity
- White 65% Hispanic / Latino 28% Two or more races 15% Black 2% Native American 1%
- Hispanic origin (detail)
- Mexican 26%
- Common ancestry
- Slovak 2% Serbian 1% Iranian 1%
- Foreign-born
- 17% · Canada, Jamaica
- Languages at home
- 74% English-only · Spanish 24% Arabic 1%
Political lean MEDSL · Collin
- 2024 margin
- R (+11.1) · D 43.1% · R 54.3% · Other 2.6%
- 2008→2024 swing
- +14.4pp toward D · 2008: -25.6pp · 2024: -11.1pp
- All cycles
- 2024: R+11.1 2020: R+4.3 2016: R+17.0 2012: R+31.6 2008: R+25.6
Not yet ingested
- Civics
- —
Market trends
- HPI YoY
- ▲ 10.09%
- Current HPI
- 331.12
- Rent YoY
- —
- Metro
- —
- State GDP YoY
- ▲ 3.95%
- F500 in state
- 110
Industry mix (Fortune 500 HQ in TX)
| Industry | F500 HQs | Revenue |
|---|---|---|
| Energy | 16 | $1,198B |
|
||
| Technology | 5 | $198B |
|
||
| Engineering / Construction | 4 | $72B |
|
||
| Energy Services | 3 | $60B |
|
||
| Utilities | 3 | $41B |
|
||
| Healthcare | 2 | $330B |
|
||
Price history
+10756.1% since first listed28 events — show timeline
- 2026-04-02 Listed $369,000 NTREIS
- 2025-10-03 Price Changed $369,000 NTREIS
- 2025-09-25 Price Changed $370,000 NTREIS
- 2025-09-18 Price Changed $371,000 NTREIS
- 2025-09-11 Price Changed $372,000 NTREIS
- 2025-09-04 Price Changed $373,000 NTREIS
- 2025-08-29 Price Changed $374,000 NTREIS
- 2025-08-17 Relisted — NTREIS
- 2025-08-13 Contingent — NTREIS
- 2025-07-25 Price Changed $375,000 NTREIS
- 2025-07-18 Price Changed $385,000 NTREIS
- 2025-07-11 Price Changed $395,000 NTREIS
- 2025-07-03 Price Changed $405,000 NTREIS
- 2025-06-27 Price Changed $415,000 NTREIS
- 2025-06-19 Price Changed $425,000 NTREIS
- 2025-06-12 Price Changed $435,000 NTREIS
- 2025-06-06 Listed $445,000 NTREIS
- 2024-12-12 Listing Removed — NTREIS
- 2024-11-08 Relisted — NTREIS
- 2024-11-07 Price Changed $445,000 NTREIS
- 2024-09-07 Price Changed $450,000 NTREIS
- 2024-08-17 Relisted — NTREIS
- 2024-06-13 Listed $460,000 NTREIS
- 2024-04-17 Rental Removed $3,399 Avail
- 2024-02-13 Listed for Rent $3,399 Avail
- 2021-12-30 Sold (Public Records) — Public Records
- 2010-08-20 Sold (Public Records) — Public Records
- 2000-08-23 Sold (Public Records) — Public Records
Property tax history
+18.0%/yrLatest (2025): $5,651 · +10.5% YoY. Source: county tax records.
Cash-flow waterfall
monthlySold comps — $/sqft
last 12 mo · ≤1 miLoading sold comps…