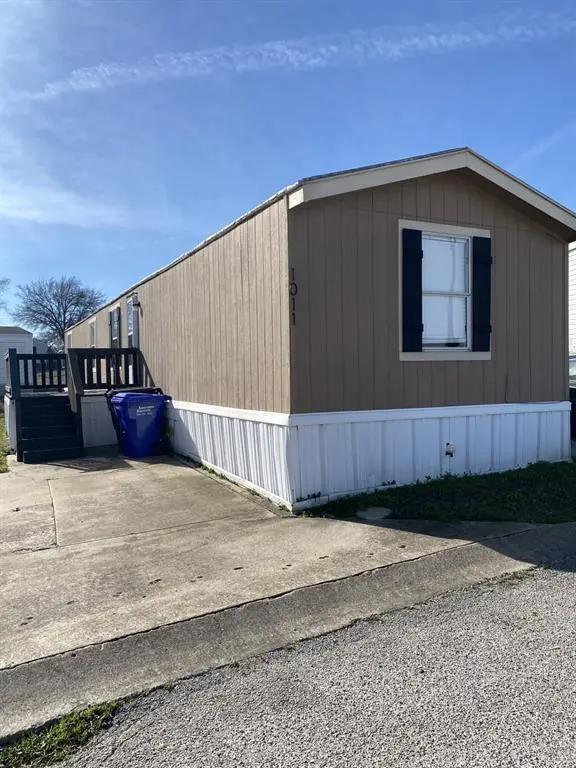
1011 Lavon Ct · Royse City, TX
Flood risk No data
- FEMA flood zone
- —
- Chance of flooding over 30 yrs
- —
- Est. flood insurance / yr
- —
Fire risk No data
- Est. fire insurance / yr
- —
Heat risk No data
- Hot days now (above threshold)
- —
- Hot days in 30 yrs
- —
Wind risk No data
- Chance of severe wind over 30 yrs
- —
Air-quality risk No data
- Unhealthy air days now
- —
- Unhealthy air days in 30 yrs
- —
Risk factors via First Street. Map © Google.
Why this score? — see what drove the B- grade
The composite is a weighted blend of 9 inputs, each scored 0–100. Each bar is that input's sub-score; the figure is the points it added to the 100-point composite (weight × sub-score).
- Cash flow +30.0/30.0
- 1% rule +10.0/10.0
- DSCR +10.0/10.0
- ARV discount +7.5/15.0
- Schools +3.8/10.0
- Livability +3.8/5.0
- Condition / age +2.5/5.0
- Rent growth +2.2/5.0
- Appreciation +0.0/10.0
$60,000
🖨 Deal sheet (PDF) 📄 Offer letter ✓ Due diligence
Listing remarks MLS
The owner is willing to OWNER FINANCE. Contact agent for details. Cash offer DISCOUNT. Contact agent for details. The mobile home has been updated and painted. Mailboxes and swimming pool at the entrance of the park. Utilities included in the mobile home space, rented for $845 monthly, except for electricity to be paid by owner. Leased through June 2026.
Key facts
- 1,300 sq ft lot
- Pool
- Built 2001
Neighborhood map
What this means for you Summary
Snapshot
- This is a 3-bed/2.0-bath manufactured listed at $60k.
Deal economics
- At list price, monthly cash flow is $832 ($10k/yr) — positive.
- The deal already cash-flows at list — no discount required.
- Meets the 1% rule at list price ($2k rent vs $60k).
- Recommended offer: $53k (12.0% below list) — sets the bar for market timing.
- Cap rate 22.9% vs local median 4.2% in Royse City — top-decile yield for the area; either an underpriced asset or a hidden risk that comps aren't pricing in. Stress-test before assuming the spread holds.
Location & tenants
- Location reads 75/100 on livability (#158 in TX, #4,292 nationally) — a middle-class / working-renter tenant base. Strengths: crime A+, employment A+, housing A+; Watch: amenities F, commute F.
- Royse City ISD (rural): math 42% / reading 42% proficiency, ranked #266 of 826 in TX (top 32%) — families likely to look elsewhere, expect single-tenant / working-renter base with shorter leases.
- Zoned schools: Anita Scott El (math 53% / reading 40%, grade D-, #1,080 of 4,322 statewide, top 25%, 712 students, 47% FRL); Ouida Baley Middle (math 32% / reading 35%, grade F, #911 of 1,662 statewide, top 56%, 934 students, 43% FRL); Royse City H S (math 38% / reading 55%, grade D-, #621 of 1,632 statewide, top 38%, 2,526 students, 37% FRL).
- Market conditions: Rents soft (-1.1%/yr); 1310 active listings in the ZIP; 3 comparable units currently listed for rent nearby; rentals at typical pace (median 23d on market — plan ~3-4 weeks tenant-placement turnaround); high-income renter base; 1,810 units permitted in Rockwall County in 2024 (0 in 5+ unit buildings).
- This rent is only 16% of the median local income ($117k/yr) — well below the 30% rent-burden line; pricing power to push rent on renewal without tenant pushback.
Forward outlook
- Local home prices are declining (-3.0%/yr); year-one equity from $415 of loan paydown is wiped out by about $2k of value loss. Plan a longer hold.
- Rockwall County population projected at +56% by 2050 — long-run rental-demand tailwind backs the buy-and-hold thesis.
- At projected returns (-3.0% appreciation + 0.0% rent growth), your $17k cash investment doubles in ~2 years — after that, you're playing with house money.
Negotiation context
- It's been on market 182 days — a 12% lower offer ($53k) is reasonable based on typical stale-listing flexibility.
- 3 sale attempts since 2y ago; this cycle's ask has dropped $5k (8%) from the opening price — seller is motivated, your offer sets the floor, not the list.
Questions for the listing agent
- It's been on market 182 days. Have you received any prior offers? Is the seller open to a 12% concession, seller financing, or rate buy-down credit?
- Why hasn't it sold? Are there any deal-killer items the seller is aware of (foundation, flood, title, zoning, code violations)?
- Is there a deadline driving the sale (1031 exchange, divorce, estate, relocation)? That informs how much negotiation room exists.
- What's the average days-on-market for RENTAL listings here right now (not sales)? A rising rental-DOM trend means longer vacancies and softer asking-rent achievability than the comps imply.
- What's the recent tenant-quality profile in this submarket — average credit score on applications, eviction rate, late-payment / NSF rate, and stable-employment percentage? A property-management company in the area should have these aggregated.
- How much new for-sale + rental construction is in the pipeline within 1–3 miles? Heavy new supply typically softens prices + rents 12–24 months out; constrained supply supports both.
Investment metrics
- 1% rule
- 2.57% ✓
- Cap rate
- 22.94%
- Cash-on-cash
- 59.45%
- DSCR
- 3.65
- GRM
- 3.2
CMA / ARV
No comps found within radius.
Projected returns pro-forma
-3.0% appreciation · 0.0% rent growth · sell at horizon
- IRR
- 54.8%
- Equity multiple
- 3.31×
- Total profit
- $38,779
- Equity at exit
- $8,946
- IRR
- 58.7%
- Equity multiple
- 6.04×
- Total profit
- $84,599
- Equity at exit
- $5,188
Cash invested: $16,800 (down + closing). Projections, not guarantees.
Landlord ↔ Tenant lean methodology
- Overall (STATE)
- 87 Strongly Landlord-Friendly
- State Texas
- 87 Strongly Landlord-Friendly · R+5
- County
- — inherits STATE
- City
- — inherits STATE
ZIP-level market 75189
- Home prices YoY
- -25.0%
- Rents YoY
- -1.1%
- Active inventory
- 1310
- Price-to-rent
- 3.2×
Monthly cashflow live
- Estimated rent
- $1,541 medium interval (Pro) →
- Mortgage (P&I)
- −$315
- Tax from tax record
- −$45 /mo · $542/yr
- Insurance
- −$25
- HOA
- −$0
- Lot rent leased land?
- −$0
- Vacancy / Maint / Mgmt
- −$324
- Net cashflow
- $832
Break-even live
Sensitivity live
| Price | -10% $866 | -5% $849 | +0% $832 | +5% $815 | +10% $798 |
|---|---|---|---|---|---|
| Rent | -10% $711 | -5% $771 | +0% $832 | +5% $893 | +10% $954 |
| Rate | -1.0pp $863 | -0.5pp $848 | base $832 | +0.5pp $817 | +1.0pp $801 |
UW: 25.0% down · 7.5% · 30yr · 1.5% tax · 5.0% vac · 8.0% maint · 8.0% mgmt
Financing live
Cash to close
- Down payment
- $15,000
- Closing costs
- $1,800
- Reserves months
- —
- Total cash needed
- —
Loan-product check · same deal, 3 products live
Conventional
25% down · 7.5% · 30yr
- Down + closing
- —
- Monthly P&I
- —
- Monthly cashflow
- —
- DSCR
- —
- Eligible?
- —
Personal DTI + credit; lowest rate.
DSCR
20% down · 8.5% · 30yr
- Down + closing
- —
- Monthly P&I
- —
- Monthly cashflow
- —
- DSCR
- —
- Eligible?
- —
No personal income docs; deal must DSCR.
Hard money
10% down · 12.0% · 12mo
- Down + closing
- —
- Monthly P&I
- —
- Monthly cashflow
- —
- DSCR
- —
- Eligible?
- —
Short-term bridge; refi at stabilization.
Rent comps 3 comps
| Address | Beds | Baths | Sqft | Rent | $/sqft | DOM | Units | Dist |
|---|---|---|---|---|---|---|---|---|
| 1023 Lakes Dr Royse City, TX | 2.0–3.0 | 2.0 | 1194 | $1,749 | $1.46 | 4d | 1 | 0.09mi |
| 309 S Bell St Royse City, TX | 2.0 | 1.0 | 1013 | $1,500 | $1.48 | 46d | 1 | 0.58mi |
| 913 Live Oak St Unit B Royse City, TX | 3.0 | 2.0 | 1120 | $1,600 | $1.43 | 23d | 1 | 1.06mi |
Listing history 24 events
-
2026-06-22days on market $60,000 Active 182 DOM
-
2026-06-21remarks 365-char remark
-
2026-06-21pricedays on market $60,000 Active 181 DOM
-
2026-06-18days on market $65,000 Active 178 DOM
-
2026-06-17days on market $65,000 Active 177 DOM
-
2026-06-16days on market $65,000 Active 176 DOM
-
2026-06-15days on market $65,000 Active 175 DOM
-
2026-06-13days on market $65,000 Active 173 DOM
-
2026-06-09days on market $65,000 Active 169 DOM
-
2026-06-08days on market $65,000 Active 168 DOM
-
2026-06-07days on market $65,000 Active 167 DOM
-
2026-06-04days on market $65,000 Active 164 DOM
-
2026-06-03days on market $65,000 Active 163 DOM
-
2026-06-02days on market $65,000 Active 162 DOM
-
2026-06-01days on market $65,000 Active 161 DOM
-
2026-05-31days on market $65,000 Active 160 DOM
-
2025-12-21$65,000 Active 362-char remark
Show marketing remark (362 chars)
The owner is willing to OWNER FINANCE. Contact agent for details. Cash offer DISCOUNT. Contact agent for details. The mobile home has been updated and painted. Mailboxes and swimming pool at the entrance of the park. Utilities included in the mobile home space, rented for $845 monthly, except for electricity to be paid by owner. Leased through June 2026.
-
2025-11-09historical $1,500
-
2025-10-29price $1,500
-
2025-09-17$1,699
-
2024-11-08soldstatus Closed 206-char remark
Show marketing remark (206 chars)
Property is being sold as-is and is priced below market value. Minor cosmetic updates needed. Excellent starter home in Royse City. HVAC and Roof are in good condition. Close to highway, parks, and Walmart.
-
2024-10-29status Pending 206-char remark
Show marketing remark (206 chars)
Property is being sold as-is and is priced below market value. Minor cosmetic updates needed. Excellent starter home in Royse City. HVAC and Roof are in good condition. Close to highway, parks, and Walmart.
-
2024-10-21historical Active Option Contract 206-char remark
Show marketing remark (206 chars)
Property is being sold as-is and is priced below market value. Minor cosmetic updates needed. Excellent starter home in Royse City. HVAC and Roof are in good condition. Close to highway, parks, and Walmart.
-
2024-10-14$42,000 Active 206-char remark
Show marketing remark (206 chars)
Property is being sold as-is and is priced below market value. Minor cosmetic updates needed. Excellent starter home in Royse City. HVAC and Roof are in good condition. Close to highway, parks, and Walmart.
ⓘ Source: listings_history table (triggers on properties + properties_extension) + one-shot
backfill from property_details.listing_events for pre-trigger history.
Tax reassessment forecast TX · Resets to sale price
- Current annual tax
- $542 · $45/mo
- Projected year-2 tax
- $1,098 · $92/mo
- Expected delta
- +$556/yr (+$46/mo · 102.4%)
ⓘ Screening estimate from a state-policy table — verify with the county assessor before closing.
Nearby sold comps map
Loading sold comps map…
Walkable amenities ~0.75 mi
Loading nearby amenities…
Taxation est. · year 1
- Rental income
- $18,489
- − Mortgage interest
- −$3,361
- − Property taxes
- −$542
- − Insurance
- −$300
- − Repairs & maintenance
- −$1,479
- − Management
- −$1,479
- − Depreciation
- −$1,745
- Taxable income
- $9,582
- Est. tax owed @ 24.0%
- −$2,300
- After-tax cash flow
- $7,688/yr
For passive investors: Depreciation is non-cash, so a rental often shows a tax loss while cash-flowing — sheltering income. Rental losses are passive: they offset passive income freely, and up to $25,000/yr can offset ordinary (W-2) income if you actively participate and your MAGI is under $100k (phasing out to $0 by $150k); unused losses carry forward. On sale, claimed depreciation is recaptured at up to 25%, and gains may owe capital-gains tax (a 1031 exchange can defer both). Figures are a year-1 estimate at your 24.0% rate — not tax advice; consult a CPA.
Schools (NCES district)
- District
- Royse City ISD
- NCES district ID
- 4838220
- Math proficiency
- 42% ▼ -10.00%
- Reading proficiency
- 42% ▼ -5.00%
- Median HH income
- $73,810
- Composite
- 38.44/100
- National rank
- #4197
- State rank
- #266 of 826 in TX
Livability — Royse City
- Score
- 75/100
- State rank
- #158
- US rank
- #4292
Category grades
Schools grade is shown separately in the Schools card above.
Census & demographics
- Census place
- Royse City, TX
- County
- Rockwall County · 132,930 people
- City population
- 48,739
- Metro
- Dallas-Fort Worth-Arlington, TX
- Population (ZIP)
- 48,739
- Household income
- $117,125
- Rent vs Own
- Severe rent burden
- 569.0
Population outlook (Rockwall County) Hauer SSP2
- Today (2025)
- 118,396 people
- By 2030
- 132,209 · +11.7%
- By 2040
- 159,538 · +34.7%
- By 2050
- 185,299 · +56.5%
- By 2075
- 243,489 · +105.7%
- By 2100
- 277,814 · +134.6%
Race, ethnicity, and origin ACS 2023
- Neighborhood character
- Diverse neighborhood (Simpson 0.57)
- Race & ethnicity
- White 60% Hispanic / Latino 25% Two or more races 12% Black 10% Asian 2%
- Hispanic origin (detail)
- Mexican 20%
- Common ancestry
- Slovak 2% Serbian 1% Lithuanian 1%
- Foreign-born
- 10% · Canada, Philippines, Jamaica
- Languages at home
- 80% English-only · Spanish 15% Other Indo-European 1%
Political lean MEDSL · Rockwall
- 2024 margin
- Solid R (+40.9) · D 29.1% · R 70.0%
- 2008→2024 swing
- +5.3pp toward D · 2008: -46.2pp · 2024: -40.9pp
- All cycles
- 2024: R+40.9 2020: R+37.7 2016: R+47.5 2012: R+53.3 2008: R+46.2
Not yet ingested
- Civics
- —
Market trends
- HPI YoY
- ▼ -71.10%
- Current HPI
- 212.8422
- Rent YoY
- ▼ -1.13%
- Metro
- Dallas-Fort Worth-Arlington, TX
- State GDP YoY
- ▲ 3.95%
- F500 in state
- 110
Industry mix (Fortune 500 HQ in TX)
| Industry | F500 HQs | Revenue |
|---|---|---|
| Energy | 16 | $1,198B |
|
||
| Technology | 5 | $198B |
|
||
| Engineering / Construction | 4 | $72B |
|
||
| Energy Services | 3 | $60B |
|
||
| Utilities | 3 | $41B |
|
||
| Healthcare | 2 | $330B |
|
||
Price history
+54.8% since first listed8 events — show timeline
- 2025-12-21 Listed $65,000 NTREIS
- 2025-11-09 Rental Removed $1,500 NTREIS
- 2025-10-29 Price Changed $1,500 NTREIS
- 2025-09-17 Listed for Rent $1,699 NTREIS
- 2024-11-08 Sold (MLS) — NTREIS
- 2024-10-29 Pending — NTREIS
- 2024-10-21 Contingent — NTREIS
- 2024-10-14 Listed $42,000 NTREIS
Property tax history
+4.6%/yrLatest (2025): $542 · -0.2% YoY. Source: county tax records.
Cash-flow waterfall
monthlySold comps — $/sqft
last 12 mo · ≤1 miLoading sold comps…