 Fourplex
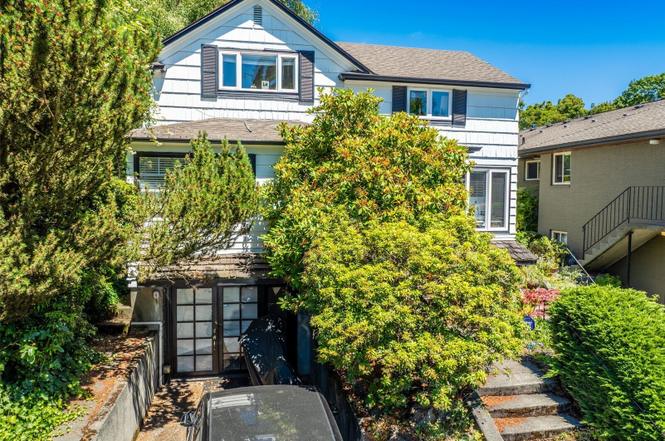
910 E Prospect St · Seattle, WA
Flood risk 1/10 · Minimal
- FEMA flood zone
- X (unshaded)
- Chance of flooding over 30 yrs
- 0.0%
- Est. flood insurance / yr
- $473 – $860
Fire risk 1/10 · Minimal
- Est. fire insurance / yr
- $604 – $1,122
Heat risk 3/10 · Minor
- Hot days now (above 86°F)
- 6 days/yr
- Hot days in 30 yrs
- 13 days/yr
Wind risk 1/10 · Minimal
- Chance of severe wind over 30 yrs
- —
Air-quality risk 7/10 · Major
- Unhealthy air days now
- 11 days/yr
- Unhealthy air days in 30 yrs
- 11 days/yr
Risk factors via First Street. Map © Google.
Why this score? — see what drove the B- grade
The composite is a weighted blend of 9 inputs, each scored 0–100. Each bar is that input's sub-score; the figure is the points it added to the 100-point composite (weight × sub-score).
- Cash flow +23.3/30.0
- ARV discount +14.5/15.0
- DSCR +7.5/10.0
- Schools +6.1/10.0
- 1% rule +5.6/10.0
- Livability +3.8/5.0
- Rent growth +3.1/5.0
- Condition / age +2.5/5.0
- Appreciation +0.0/10.0
$1,095,000
🖨 Deal sheet (PDF) 📄 Offer letter ✓ Due diligence
Multi-family units
County records classify this as Multi-Family (2-4 Unit). Listing-text estimate: 4 units. confirmed
Listing remarks
The Mansion District Fourplex is a charming 4-unit multifamily property nestled in the heart of Seattle’s desirable North Capitol Hill neighborhood next to Volunteer Park. Two units are nonconforming units, but can be permitted with SDIC as a value-add opportunity (buyer to verify). This historic gem, built in 1905, blends timeless appeal with modern potential, offering investors a rare chance to capitalize on one of the city’s most desirable areas. Whether you’re looking to boost rental income through market-rate adjustments, legalize the two lower non-conforming units for added value, owner-occupy a unit while generating passive revenue, or redevelop the site into higher
Key facts
- Historic gem
- Multifamily property
- 4,000 sq ft lot
Tags
Property features AI
Finance
- Other: Property listed as residential income / multi-family
- Financial info: Gross scheduled income approximately $78,060; Gross adjusted income approximately $75,718; Total monthly income approximately $6,505; Net operating income approximately $53,745; Total annual expenses approximately $21,973; Insurance expense approximately $2,500; Other expenses approximately $3,000; Gross rent multiplier about 14.03; Listing terms: Cash or Conventional
- HOA & community: No HOA information provided
Exterior
- Parking: Two uncovered parking spaces
- Security: Fully fenced property
- Utilities: Electric service; Sewer connected; Water/sewer/garbage fee recorded
- Home design: Residential income property; Multi-family (duplex/4-unit building); Three stories; Electric energy source
- Construction: Brick, stone and wood construction; Composition roof; Poured concrete foundation; Duplex/structure type
- Exterior features: Brick, stone and wood exterior; Curbs, paved access and sidewalks; Fully fenced site
Interior
- Kitchen: Kitchens in each unit (appliance specifics not provided)
- Bedrooms: One 2-bedroom unit; One 1-bedroom unit; Other units are studios/efficiencies
- Flooring: Ceramic tile; Vinyl plank
- Bathrooms: All units have 1 bathroom
- Heating & cooling: Forced air heating; No central air conditioning
- Interior features: Ceramic tile and vinyl plank flooring; Fully fenced
- Laundry & utility: Coin-operated laundry on-site
Neighborhood map
What this means for you Summary
Snapshot
- This is a 4 × 3-bed/4.0-bath units multifamily listed at $1.09M.
Deal economics
- At list price, monthly cash flow is $2k ($24k/yr) — positive. Per door: $502/mo.
- The deal already cash-flows at list — no discount required.
- Meets the 1% rule at list price ($12k rent vs $1.09M).
- Cap rate 8.5% vs local median 1.6% in Seattle — top-decile yield for the area; either an underpriced asset or a hidden risk that comps aren't pricing in. Stress-test before assuming the spread holds.
Location & tenants
- Location reads 75/100 on livability (#166 in WA, #4,033 nationally) — a middle-class / working-renter tenant base. Strengths: amenities A+, commute A+, employment A+; Watch: crime F, cost of living F.
- Seattle Public Schools (urban): math 64% / reading 72% proficiency, ranked #19 of 291 in WA (top 6%) — acceptable for families but not a draw, mixed tenant base, ~2y average lease.
- Market conditions: Rents rising (+2.5%/yr); 192 active listings in the ZIP; 34 comparable units currently listed for rent nearby; rentals leasing fast (median 3d on market — plan ~1-2 weeks tenant-placement turnaround); high-income renter base; 10,555 units permitted in King County in 2024 (7,119 in 5+ unit buildings).
- At $11,608/mo this rent would consume 121% of the median local household income ($115k/yr) (locally 1711% of renters already pay >50% of income on rent) — very limited rent-growth headroom before tenants either downsize or default.
Forward outlook
- Local home prices are declining (-3.0%/yr); year-one equity from $8k of loan paydown is wiped out by about $33k of value loss. Plan a longer hold.
- King County population projected at +44% by 2050 — long-run rental-demand tailwind backs the buy-and-hold thesis.
Negotiation context
- Only 2 days on market — expect competitive offers; lowballing is unlikely to land.
- 5 sale attempts since 26y ago with the ask held roughly flat each time — persistent listings suggest the price (not the market) is what's stuck; bring a comps-based counter.
- Current owner paid $852k; 29% above their basis — modest negotiation headroom, anchor on the comps not their cost.
Risks & watch-outs
- Watch-outs: built in 1905 — expect roof / HVAC / electrical / plumbing capex.
Questions for the listing agent
- Can we see the unit-by-unit rent roll, current vacancy, and any below-market leases? What's the average tenancy length?
- What capital expenditures (roof, boiler, parking lot, exteriors) have been made in the last 5 years, and what's planned in the next 2?
- Built in 1905 — when were the roof, HVAC, electrical panel, plumbing, and water heater last replaced?
- Is there a deadline driving the sale (1031 exchange, divorce, estate, relocation)? That informs how much negotiation room exists.
- Schools are A-rated — typically a magnet for longer-tenancy family renters. What's the average tenant stay here, and is there a school-zone premium baked into asking?
- Crime grade is F in this area — have there been break-ins, vandalism, or insurance claims at this property in the last 3 years? What carrier currently insures it and at what premium?
- What's the average days-on-market for RENTAL listings here right now (not sales)? A rising rental-DOM trend means longer vacancies and softer asking-rent achievability than the comps imply.
- What's the recent tenant-quality profile in this submarket — average credit score on applications, eviction rate, late-payment / NSF rate, and stable-employment percentage? A property-management company in the area should have these aggregated.
- How much new apartment / multifamily construction is in the pipeline within 1–3 miles? Heavy new supply (>2% of stock underway) typically softens rents 12–24 months out; light construction supports rent growth.
Investment metrics
- 1% rule
- 1.06% ✓
- Cap rate
- 8.49%
- Cash-on-cash
- 7.85%
- DSCR
- 1.35
- GRM
- 7.9
CMA / ARV
- ARV (on-the-fly)
- $1,298,400
- Comps found
- 2
Show comp detail 2 sales within ~0.75 mi
| Address | Dist | Beds/Ba | Sqft | Sold | Price | $/sf | Match |
|---|---|---|---|---|---|---|---|
| 611 20th Ave E | 0.73mi | 3/2.2 | 2,680 (+12%) | 8mo | $1,450,000 | $541 | 37 |
| 1202 E Denny Way | 0.71mi | 3/2.0 | 2,620 (+9%) | 17mo | $1,070,000 | $408 | 33 |
Match score weights: distance 35% · size 25% · config 20% · recency 20%. Top-matched comps best support the ARV.
Projected returns pro-forma
-3.0% appreciation · 2.52% rent growth · sell at horizon
- IRR
- -4.9%
- Equity multiple
- 0.82×
- Total profit
- $-55,320
- Equity at exit
- $163,268
- IRR
- 4.3%
- Equity multiple
- 1.30×
- Total profit
- $93,381
- Equity at exit
- $94,676
Cash invested: $306,600 (down + closing). Projections, not guarantees.
Landlord ↔ Tenant lean methodology
- Overall (CITY)
- 0 Strongly Tenant-Friendly
- State Washington
- 28 Tenant-Leaning · D+8
- County
- — inherits STATE
- City Seattle
- 0 Strongly Tenant-Friendly · D+52
ZIP-level market 98102
- Rents YoY
- 2.5%
- Active inventory
- 192
- Price-to-rent
- 31.4×
Monthly cashflow live
- Estimated rent
- $11,608 high interval (Pro) →
- Mortgage (P&I)
- −$5,742
- Tax from tax record
- −$966 /mo · $11,588/yr
- Insurance
- −$456
- HOA
- −$0
- Vacancy / Maint / Mgmt
- −$2,438
- Net cashflow
- $2,006
Break-even live
Sensitivity live
| Price | -10% $2,626 | -5% $2,316 | +0% $2,006 | +5% $1,696 | +10% $1,386 |
|---|---|---|---|---|---|
| Rent | -10% $1,089 | -5% $1,548 | +0% $2,006 | +5% $2,465 | +10% $2,923 |
| Rate | -1.0pp $2,558 | -0.5pp $2,285 | base $2,006 | +0.5pp $1,722 | +1.0pp $1,434 |
4-unit breakdown (identical units grouped — click to expand)
| Units | Beds | Baths | Est. rent |
|---|---|---|---|
| 4× units | 3 | 4 | $11,608 |
| #1 | 3 | 4 | $2,902 |
| #2 | 3 | 4 | $2,902 |
| #3 | 3 | 4 | $2,902 |
| #4 | 3 | 4 | $2,902 |
| Total (4 units) | $11,608 | ||
UW: 25.0% down · 7.5% · 30yr · 1.5% tax · 5.0% vac · 8.0% maint · 8.0% mgmt
Financing live
Cash to close
- Down payment
- $273,750
- Closing costs
- $32,850
- Reserves months
- —
- Total cash needed
- —
Loan-product check · same deal, 3 products live
Conventional
25% down · 7.5% · 30yr
- Down + closing
- —
- Monthly P&I
- —
- Monthly cashflow
- —
- DSCR
- —
- Eligible?
- —
Personal DTI + credit; lowest rate.
DSCR
20% down · 8.5% · 30yr
- Down + closing
- —
- Monthly P&I
- —
- Monthly cashflow
- —
- DSCR
- —
- Eligible?
- —
No personal income docs; deal must DSCR.
Hard money
10% down · 12.0% · 12mo
- Down + closing
- —
- Monthly P&I
- —
- Monthly cashflow
- —
- DSCR
- —
- Eligible?
- —
Short-term bridge; refi at stabilization.
Rent comps 34 comps
| Address | Beds | Baths | Sqft | Rent | $/sqft | DOM | Units | Dist |
|---|---|---|---|---|---|---|---|---|
| 1005 E Roy St Seattle, WA | 3.0 | 2.0 | 1627 | $4,795 | $2.95 | 1d | 1 | 0.27mi |
| 1522 E Howe St Seattle, WA | 3.0 | 3.5 | 2460 | $8,500 | $3.46 | 16d | 1 | 0.63mi |
| 2226 Harvard Ave E Seattle, WA | 3.0 | 2.5 | 3060 | $8,950 | $2.92 | 3d | 1 | 0.71mi |
| 2229 Boylston Ave E Seattle, WA | 3.0 | 2.5 | 1720 | $5,500 | $3.20 | 44d | 1 | 0.71mi |
| 224 Pontius Ave N Seattle, WA | 4.0 | 1.0–3.5 | 2938 | $12,336 | $4.20 | 1d | 119 | 0.79mi |
| 2364 Franklin Ave E Unit B Seattle, WA | 3.0 | 2.0 | 1680 | $4,750 | $2.83 | 44d | 1 | 0.89mi |
| 112 Boren Ave N Seattle, WA | 1.0–3.0 | 1.0–3.0 | 1058 | $8,120 | $7.67 | 1d | 54 | 0.95mi |
| 1823 Minor Ave Seattle, WA | 2.0 | 1.0–2.0 | 1083 | $6,923 | $6.39 | 1d | 28 | 0.96mi |
| 2019 Boren Ave Seattle, WA | 3.0 | 1.0–3.0 | 1420 | $17,995 | $12.67 | 1d | 15 | 1.01mi |
| 1708 18th Ave Seattle, WA | 3.0 | 3.5 | 1780 | $4,995 | $2.81 | 1d | 1 | 1.02mi |
| 2010 Terry Ave Seattle, WA | 2.0 | 1.0–2.5 | 1415 | $17,995 | $12.72 | 1d | 27 | 1.03mi |
| 2618 Eastlake Ave E Unit B Seattle, WA | 3.0 | 2.5 | 1971 | $5,007 | $2.54 | 44d | 1 | 1.04mi |
| 615 E Pike St #402 Seattle, WA | 2.0 | 2.5 | 1761 | $8,500 | $4.83 | 3d | 1 | 1.05mi |
| 120 Westlake Ave N Seattle, WA | 1.0–2.0 | 1.0–2.5 | 1221 | $7,156 | $5.86 | 1d | 17 | 1.05mi |
| 137 23rd Ave E Seattle, WA | 3.0 | 2.5 | 1740 | $4,950 | $2.84 | 14d | 1 | 1.05mi |
| 1713 Dexter Ave N Unit 501 Seattle, WA | 2.0 | 2.0 | 1750 | $4,245 | $2.43 | 1d | 1 | 1.09mi |
| 113 24th Ave E Unit A Seattle, WA | 2.0 | 2.5 | 1606 | $3,800 | $2.37 | 12d | 1 | 1.13mi |
| 2038 8th Ave N Seattle, WA | 2.0 | 1.5 | 1600 | $3,950 | $2.47 | 1d | 1 | 1.14mi |
| 1634 21st Ave Seattle, WA | 2.0 | 2.0 | 1600 | $3,800 | $2.38 | 1d | 1 | 1.17mi |
| 809 Olive Way Seattle, WA | 1.0–2.0 | 1.0–2.0 | 1379 | $7,889 | $5.72 | 1d | 12 | 1.18mi |
| 1510 Taylor Ave N Seattle, WA | 3.0 | 2.5 | 1697 | $3,995 | $2.35 | 21d | 1 | 1.18mi |
| 2613 E Madison St Seattle, WA | 2.0 | 2.5 | 1700 | $4,075 | $2.40 | 24d | 1 | 1.19mi |
| 501 Highland Dr Unit 402 Seattle, WA | 3.0 | 2.0 | 1915 | $4,950 | $2.58 | 21d | 1 | 1.22mi |
| 312 27th Ave E Unit A Seattle, WA | 3.0 | 2.5 | 1595 | $4,695 | $2.94 | 44d | 1 | 1.23mi |
| 113 27th Ave E Seattle, WA | 3.0 | 3.0 | 1928 | $4,695 | $2.44 | 44d | 1 | 1.27mi |
| 200 27th Ave E Seattle, WA | 4.0 | 3.0 | 2080 | $3,800 | $1.83 | 1d | 1 | 1.27mi |
| 2109 Aurora Ave N Seattle, WA | 4.0 | 2.0 | 2490 | $4,550 | $1.83 | 1d | 1 | 1.27mi |
| 2610 Glenwilde Pl E Seattle, WA | 3.0 | 2.0 | 2200 | $3,995 | $1.82 | 44d | 1 | 1.37mi |
| 1920 4th Ave Seattle, WA | 2.0 | 2.0 | 1955 | $7,950 | $4.07 | 1d | 1 | 1.40mi |
| 1920 4th Ave Seattle, WA | 1.0–2.0 | 1.0–2.0 | 1432 | $7,950 | $5.55 | 24d | 3 | 1.40mi |
| 1920 4th Ave Seattle, WA | 1.0–2.0 | 1.0–2.0 | 1432 | $7,950 | $5.55 | 10d | 2 | 1.40mi |
| 2116 4th Ave Seattle, WA | 2.0 | 1.0–2.0 | 1164 | $4,495 | $3.86 | 14d | 19 | 1.40mi |
| 2315 4th Ave Seattle, WA | 3.0 | 1.0–2.0 | 1052 | $8,495 | $8.08 | 1d | 9 | 1.45mi |
| 702 Spring St Seattle, WA | 3.0 | 1.0–2.0 | 1172 | $7,115 | $6.07 | 1d | 34 | 1.48mi |
Listing history 3 events
-
2026-06-21days on market $1,095,000 Active 2 DOM
-
2026-06-18remarks 681-char remark
-
2026-06-18$1,095,000 Active 1 DOM
ⓘ Source: listings_history table (triggers on properties + properties_extension) + one-shot
backfill from property_details.listing_events for pre-trigger history.
Tax reassessment forecast WA · Resets to sale price
- Current annual tax
- $11,588 · $966/mo
- Projected year-2 tax
- $11,588 · $966/mo
- Expected delta
- $0/yr ($0/mo · 0.0%)
ⓘ Screening estimate from a state-policy table — verify with the county assessor before closing.
Climate risk First Street
- Flood 1/10 Low FEMA zone X (unshaded) · 0% chance over 30 yrs
- Wildfire 1/10 Low
- Heat 3/10 Moderate 6 d/yr ≥86°F today · 13 d/yr by 30 yrs out
- Wind 1/10 Low
- Air quality 7/10 Severe 11 unhealthy d/yr today · 11 by 30 yrs out
Nearby sold comps map
Loading sold comps map…
Walkable amenities ~0.75 mi
Loading nearby amenities…
Taxation est. · year 1
- Rental income
- $139,296
- − Mortgage interest
- −$61,337
- − Property taxes
- −$11,588
- − Insurance
- −$5,475
- − Repairs & maintenance
- −$11,144
- − Management
- −$11,144
- − Depreciation
- −$31,855
- Taxable income
- $6,754
- Est. tax owed @ 24.0%
- −$1,621
- After-tax cash flow
- $22,452/yr
For passive investors: Depreciation is non-cash, so a rental often shows a tax loss while cash-flowing — sheltering income. Rental losses are passive: they offset passive income freely, and up to $25,000/yr can offset ordinary (W-2) income if you actively participate and your MAGI is under $100k (phasing out to $0 by $150k); unused losses carry forward. On sale, claimed depreciation is recaptured at up to 25%, and gains may owe capital-gains tax (a 1031 exchange can defer both). Figures are a year-1 estimate at your 24.0% rate — not tax advice; consult a CPA.
Schools (NCES district)
- District
- Seattle Public Schools
- NCES district ID
- 5307710
- Math proficiency
- 64% ▼ -1.00%
- Reading proficiency
- 72% ▬ 0.00%
- Median HH income
- $68,695
- Composite
- 60.76/100
- National rank
- #1649
- State rank
- #19 of 291 in WA
Livability — Seattle
- Score
- 75/100
- State rank
- #166
- US rank
- #4033
Category grades
Schools grade is shown separately in the Schools card above.
Census & demographics
- Census place
- Seattle, WA
- County
- King County · 2,251,916 people
- City population
- 706,262
- Metro
- Seattle-Tacoma-Bellevue, WA
- Population (ZIP)
- 27,333
- Household income
- $114,925
- Rent vs Own
- Severe rent burden
- 1711.0
Population outlook (King County) Hauer SSP2
- Today (2025)
- 2,576,485 people
- By 2030
- 2,803,316 · +8.8%
- By 2040
- 3,255,921 · +26.4%
- By 2050
- 3,706,444 · +43.9%
- By 2075
- 4,746,063 · +84.2%
- By 2100
- 5,407,730 · +109.9%
Race, ethnicity, and origin ACS 2023
- Neighborhood character
- Predominantly White (68%)
- Race & ethnicity
- White 68% Asian 12% Two or more races 12% Hispanic / Latino 8% Black 2%
- Hispanic origin (detail)
- Mexican 4%
- Common ancestry
- Italian 4% Portuguese 3% Slovak 3%
- Foreign-born
- 15% · Canada, China, South Korea
- Languages at home
- 84% English-only · Spanish 4% Chinese 3% Other Indo-European 2%
Political lean MEDSL · King
- 2024 margin
- Solid D (+51.7) · D 74.2% · R 22.5% · Other 3.4%
- 2008→2024 swing
- +9.6pp toward D · 2008: 42.1pp · 2024: 51.7pp
- All cycles
- 2024: D+51.7 2020: D+52.7 2016: D+50.4 2012: D+39.9 2008: D+42.1
Not yet ingested
- Civics
- —
Market trends
- HPI YoY
- ▼ -386.18%
- Current HPI
- 213.5569
- Rent YoY
- ▲ 2.52%
- Metro
- Seattle-Tacoma-Bellevue, WA
- State GDP YoY
- ▲ 4.65%
- F500 in state
- 22
Industry mix (Fortune 500 HQ in WA)
| Industry | F500 HQs | Revenue |
|---|---|---|
| Retail | 2 | $269B |
|
||
| Technology / Retail | 1 | $638B |
|
||
| Technology | 1 | $245B |
|
||
| Telecommunications | 1 | $38B |
|
||
| Food / Beverage | 1 | $36B |
|
||
| Automotive / Trucks | 1 | $34B |
|
||
Price history
+200.0% since first listed11 events — show timeline
- 2026-06-18 Listed $1,095,000 NWMLS as Distributed by MLS Grid
- 2020-04-15 Delisted — NWMLS as Distributed by MLS Grid
- 2020-01-22 Listed — NWMLS as Distributed by MLS Grid
- 2019-12-13 Delisted — NWMLS as Distributed by MLS Grid
- 2019-10-09 Listed — NWMLS as Distributed by MLS Grid
- 2015-04-30 Sold (Public Records) $852,000 Public Records
- 2015-04-30 Sold (MLS) $852,000 NWMLS as Distributed by MLS Grid
- 2015-04-02 Pending — NWMLS as Distributed by MLS Grid
- 2015-03-31 Listed $850,000 NWMLS as Distributed by MLS Grid
- 2000-05-10 Sold (MLS) $353,000 NWMLS as Distributed by MLS Grid
- 2000-04-25 Listed $365,000 NWMLS as Distributed by MLS Grid
Property tax history
+7.2%/yrLatest (2025): $11,588 · +6.7% YoY. Source: county tax records.
Cash-flow waterfall
monthlySold comps — $/sqft
last 12 mo · ≤1 miLoading sold comps…